
HANDLING THE IMPACT OF LOW FREQUENCY EVENTS ON
CO-OCCURRENCE BASED MEASURES OF WORD SIMILARITY
A Case Study of Pointwise Mutual Information
Franc¸ois Role and Mohamed Nadif
LIPADE, Universit
´
e Paris Descartes, 45, rue des Saints P
`
eres, 75006 Paris, France
Keywords:
Text mining, Word similarity measures, Pointwise mutual information.
Abstract:
Statistical measures of word similarity are widely used in many areas of information retrieval and text mining.
Among popular word co-occurrence based measures is Pointwise Mutual Information (PMI). Altough widely
used, PMI has a well-known tendency to give excessive scores of relatedness to word pairs that involve low-
frequency words. Many variants of it have therefore been proposed, which correct this bias empirically. In
contrast to this empirical approach, we propose formulae and indicators that describe the behavior of these
variants in a precise way so that researchers and practitioners can make a more informed decision as to which
measure to use in different scenarios.
1 INTRODUCTION
The ability to automatically discover semantically as-
sociated words is at the heart of many information
retrieval and extraction applications. For example,
when querying a search engine, many terms can be
used to express the same or very similar thing (e.g.
”city” and ”town”). As a consequence, some relevant
documents may not be retrieved just because they do
not contain exactly the same words as those in the
query text. A common technique for overcoming this
lack of flexibility is to expand an initial query using
synonyms and related words. Being able to identify
semantically similar words can also be useful in clas-
sification applications to reduce feature dimension-
ality by grouping similar terms into a small number
of clusters. Many measures of word semantic simi-
larity rely on word co-occurrence statistics computed
from a large corpus of text: the assumption is that
words that frequently appear together in text are con-
ceptually related (Manning and Schutze, 1999; Lee,
1999; Thanopoulos et al., 2002; Evert, 2004; Pecina
and Schlesinger, 2006; Bullinaria and Levy, 2007;
Hoang et al., 2009). Among the most popular word
co-occurrence based measures is Pointwise Mutual
Information (PMI). For two words (or terms) a and
b , PMI is defined as:
log
p(a, b)
p(a)p(b)
p(a) (resp. p(b)) is the probability that word a
(resp. b) occurs in a text window of a given size
while p(a, b) denotes the probability that a and b co-
occur in the same window. PMI is thus the log of
the ratio of the observed co-occurrence frequency to
the frequency expected under independence. It mea-
sures the extent to which the words occur more than
by chance or are independent. The assumption is
that if two words co-occur more than expected un-
der independence there must be some kind of seman-
tic relationship between them. Initially used in lexi-
cography (Church and Hanks, 1990), PMI has since
found many applications in various areas of informa-
tion retrieval and text mining where there is a need
for measuring word semantic relatedness. In (Vech-
tomova and Robertson, 2000), the authors show how
to use PMI to combine a corpus information on word
collocations with the probabilistic model of informa-
tion retrieval. In the context of passage retrieval PMI
is used to expand the queries using lexical affinities
computed using statistics generated from a terabyte
corpus (Terra and Clarke, 2005). Other examples in-
clude the use of PMI in projects devoted to extracting
entities from search query logs, discovering indexing
phrases, predicting user click behavior to simulate hu-
man visual search behavior, etc. Last but not least, au-
tomatic synonym dicovery is another area where PMI
has been extensively used (Turney, 2001; Terra and
Clarke, 2003).
However, a well-known problem with PMI is its
226
Role F. and Nadif M..
HANDLING THE IMPACT OF LOW FREQUENCY EVENTS ON CO-OCCURRENCE BASED MEASURES OF WORD SIMILARITY - A Case Study of
Pointwise Mutual Information.
DOI: 10.5220/0003655102180223
In Proceedings of the International Conference on Knowledge Discovery and Information Retrieval (KDIR-2011), pages 218-223
ISBN: 978-989-8425-79-9
Copyright
c
2011 SCITEPRESS (Science and Technology Publications, Lda.)

tendency to give very high association scores to pairs
involving low-frequency words, as the denominator
is small in such cases, while one generally prefers a
higher score for pairs of words whose relatedness is
supported by more evidence.
The impact of the bias is apparent in tasks directly
related to query transformation. For example, in
(Croft et al., 2010), while talking about query expan-
sion, the authors take a collection of TREC news as
example, and show that, according to PMI, the most
strongly associated words for ”tropical” in this cor-
pus are: ”trmm”, ”itto”, ”ortuno”, ”kuroshio”, ”bio-
function”, etc. though the collection contains words
such as ”forest”, ”tree”, ”rain”, ”island” etc. They
then conclude that these low-frequency words ”are
unlikely to be much use for many queries”.
Nonetheless, the basic straightforwardness of PMI
over other approaches is still appealing, and several
empirical variants have therefore been proposed to
overcome this limitation. Since the product of two
marginal probabilities in the denominator favors pairs
with low-frequency words, a common feature of these
variants is to assign more weight to the joint probabil-
ity p(a, b) either by raising it to some power k in the
denominator (log
p(a,b)
k
p(a)p(b)
) or by using it to globally
weight PMI as in the case of the so-called ”Expected
Mutual Information” (p(a, b)log
p(a,b)
p(a)p(b)
). However,
as pointed out by (Croft et al., 2010), the correction
introduced may result in too general words being top-
ranked.
Whether it is preferable to discover specialized
or general related terms depends on the context. In
any case, the point is that failing to precisely quantify
the impact of the bias and its possible corrections in-
evitably leads to empirical results that are very depen-
dent on the data. The aim of this paper is therefore to
propose precise indicators of sensitivity to frequency.
The plan of the paper is as follows. In section 2,
we review PMI and some common variants in order
to give insight into how each measure works, factors
influencing them, and their differences. We also pro-
pose formulae for assessing the impact of the correc-
tions brought by several widely used variants. Section
3 provides experimental validation of these formulae
and investigates how to give some simple visual hints
at the differences in behaviour to be expected when
migrating from one measure to the other. We con-
clude by summarizing our contribution and indicating
directions for future research.
2 A FORMAL STUDY OF SOME
IMPORTANTS VARIANTS OF
PMI
Although widely used, PMI
1
has two main limitations
: first, it may take positive or negative values and lacks
fixed bounds, which complicates interpretation. Sec-
ondly, it has a well-known tendency to give higher
scores to low-frequency events. While this may be
seen as beneficial in some situations, one generally
prefers a higher score for pairs of words whose relat-
edness is supported by more evidence.
In order to overcome these limitations, several
variants of PMI have therefore been proposed over
the years. In contrast to more general relatedness
measures for which numerous comparative studies are
available (Pecina and Schlesinger, 2006; Hoang et al.,
2009; Thanopoulos et al., 2002; Lee, 1999; Petro-
vic et al., 2010; Evert, 2004), no systematic and for-
mal comparison specifically addressing these variants
seems to have been conducted so far.
Among the most widely used variants are those
of the so-called PMI
k
family (Daille, 1994). These
variants consist in introducing one or more factors of
p(a, b) inside the logarithm to empirically correct the
bias of PMI towards low frequency events. The PMI
2
and PMI
3
measures commonly employed are defined
as follows:
PMI
2
(a, b) = log
p(a, b)
2
p(a)p(b)
and
PMI
3
(a, b) = log
p(a, b)
3
p(a)p(b)
.
Note that from the expression of PMI
2
(a, b), a sim-
ple derivation shows that it is in fact equal to
2log p(a, b) − (log p(a) +log p(b)), and thus to
PMI(a, b) + log p(a, b).
That is to say the correction is obtained by
adding some value increasing with p(a, b), namely
log p(a, b) to PMI, which, in fact, will boost the scores
of frequent pairs. However, for comparison purposes
it may be more convenient to express PMI
2
(a, b) as:
PMI
2
(a, b) = PMI(a, b) − (−log p(a, b)) (1)
1
PMI is not to be confused with the Mutual Information
between two discrete random variables X and Y , denoted
I(X ;Y ), which is the expected value of PMI.
I(X ;Y ) =
∑
a,b
p(a, b)log
p(a, b)
p(x)p(y)
=
∑
a,b
p(a, b)PMI(a, b).
HANDLING THE IMPACT OF LOW FREQUENCY EVENTS ON CO-OCCURRENCE BASED MEASURES OF
WORD SIMILARITY - A Case Study of Pointwise Mutual Information
227

The transformation may seem purely cosmetic
but it will allow us to better analyze the PMI vari-
ants in information-theoretic terms. Indeed, frequent
word pairs convey less information (in information-
theoretic sense) than infrequent ones. Therefore,
when writing
PMI(a, b) − (−log p(a, b)),
the reasoning is that the more frequent a pair, the less
information we substract from the PMI. Note that, a
generalization of (1) is easily obtained by writing:
PMI
k
(a, b) = PMI(a, b) − (−(k − 1) log p(a, b)).
This expression of PMI
k
measures allows us to
compare them in a precise way to the NPMI (Normal-
ized PMI) recently proposed in (Gerlof, 2006). The
main motivation for this new variant is to give PMI
a fixed upper bound of 1 in the case of perfect de-
pendence, that is to say when two words only occur
together. In this case
PMI(a, b) = −log p(a) = − log p(b) = − log p(a, b).
One option to normalize PMI is then to divide it by
−log p(a, b), which results in the following defini-
tion:
NPMI(a, b) =
PMI(a, b)
−log p(a, b)
(2)
Another common variant consists of removing the
log that appears in the definition of PMI. We then ob-
tain a new positive variant of PMI noted PPMI and
defined as:
PPMI(a, b) = 2
PMI(a,b)−(−log p(a,b))
(3)
We eventually end up with expressions of the vari-
ants which exhibit what they have in common.
We conclude this review by comparing PMI
2
,
PPMI and NPMI, based on how their sensitivity to
low frequencies is affected by the correction factors
we have just described. In table 1, we first recap the
values taken by the variants in three cases: complete
dependence (both words only occur together), inde-
pendence, and when p(x, y) = 0.
Table 1: Variation intervals of PMI, NPMI, PMI
2
and
PPMI.
Variants Comp. Ind. null
PMI −log p(a, b) 0 −∞
NPMI 1 0 -1
PMI
2
0 log p(a, b) −∞
PPMI 1 p(a, b) 0
Let us now assess to what extent the correction
factors used by the three different variants influence
the scores assigned to the pairs. In order to quantify
this influence of frequencies, it is easy to prove the
following proposition concerning PMI
2
:
Proposition 1.
Let k ≥ 0, if PMI(c, d) = PMI(a, b) + k, then
PMI
2
(c, d) = PMI
2
(a, b) if log
p(a,b)
p(c,d)
= k
PMI
2
(c, d) > PMI
2
(a, b) if log
p(a,b)
p(c,d)
< k
PMI
2
(c, d) < PMI
2
(a, b) if log
p(a,b)
p(c,d)
> k
Using the second implication, we can also show that
PMI
2
increases with p(a, b). Indeed, in the case when
k = 0, the implication says that if
log
p(a, b)
p(c, d)
< 0
then
PMI
2
(c, d) ≥ PMI
2
(a, b).
In addition, since PPMI(a, b) = 2
PMI
2
the same im-
plications can be used for PPMI.
In the same manner, in the following proposition,
we can prove and therefore quantify the influence of
the frequencies for the NPMI measure.
Proposition 2.
Let PMI(z,t) = kPMI(x, y) we have:
* NPMI(z,t) = NPMI(x, y)
- if log p(z, t) = k log p(x, y).
* NPMI(z,t) > NPMI(x, y)
- if (k > 0, PMI(z, t) < 0 and
log p(z,t)
log p(x,y)
< k),
- or (k > 0, PMI(z, t) > 0 and
log p(z,t)
log p(x,y)
> k),
- or (k < 0 and PMI(z, t) > 0).
* NPMI(z,t) < NPMI(x, y)
- if (k > 0, PMI(z,t) > 0 and
log p(z,t)
log p(x,y)
< k),
- or (k > 0, PMI(z, t) < 0 and
log p(z,t)
log p(x,y)
> k),
- or (k < 0 and PMI(z, t) < 0).
3 NUMERICAL EXPERIMENTS
The k thresholds derived in the previous section allow
us to predict the consequences of switching from one
measure to another. Take for example the following
pairs (ba=basidiomycota, champ=champignon) and
KDIR 2011 - International Conference on Knowledge Discovery and Information Retrieval
228

(cha=chanson, si=single)
2
extracted from the French
Wikipedia corpus described and used later.
The marginal and joint probabilities, and the com-
puted PMI and PMI
2
measures of each pair are re-
ported in table 2. As we have
PMI(ba, champ) − PMI(cha, si) = 3.05 = k
and
log
p(cha, si)
p(ba, champ)
= 3.16 > 3.05,
we observe that
PMI
2
(cha, si) > PMI
2
(ba, champ),
despite
PMI(cha, si) < PMI(ba, champ).
Table 2: Marginal, joint probabilities, PMI and PMI
2
for
two pairs.
(a, b) basidiomycota chanson
champignon single
p(a, b) 3.70 × 10
−5
3.31 × 10
−4
p(a) 3.95 × 10
−5
5.68 × 10
−4
p(b) 7.21 × 10
−5
3.72 × 10
−4
PMI(a, b) 13.66 10.61
PMI
2
(a, b) −1.05 −0.94
Given that (chanson,single) is a much more
frequent pair than (basidiomycota, champignon)
PMI
2
was able to correct the bias of PMI so as
to assign a higher score to the more frequent pair.
Continuing with the previous example, this time
using PMI and NPMI, one can show that in this case,
k = 1.28 and log p(basidiomycota, champigon) ≥
1.28 × log p(single, chanson). This leads to
NPMI(basidiomycota, champigon) = 0.92 ≥
NPMI(single, chanson) = 0.91. The more frequent
pair is ranked after the less frequent one. In contrast
to PMI
2
, NPMI was not able to correct the bias of
PMI.
To stress how dramatic an impact this divergence
may have on the ranking of related terms, table 3
shows the most strongly associated words (obtained
using a large set of Wikipedia titles and categories we
used as a corpus) for ’football’ according to PMI and
PMI
3
, which is a commonly used variant of PMI. As
can be seen, we end up with two very different lists.
PMI tends to rank domain-specific words at the top
of the list whereas the top-ranked terms for PMI
3
are
much more general.
2
Translations: basidiomycota=basidiomycota;
champignon=mushroom; chanson=song; single=single.
Table 3: Most strongly associated words for ’football’
ranked according to the scores assigned by PMI (left) and
PMI
3
(right). PMI considers the pair ”football”, ”mid-
fielder” to be the most strongly connected pair whereas
PMI
3
ranks the pair ”football”, ”league” first.
midfielder 5.581 league -19.840
midfielders 5.575 clubs -20.667
cornerbacks 5.545 england -20.915
goalkeepers 5.543 players -21.326
safeties 5.530 season -21.677
goalkeeper 5.529 team -21.922
linebackers 5.475 college -22.043
striker 5.4750 club -22.244
defenders 5.408 national -22.891
defender 5.270 managers -23.142
quarterbacks 5.262 cup -23.498
This suggests a more global way of looking at
the levels of correction brought about by the differ-
ent variants for a particular corpus. First select a
large corpus of word pairs. For each association mea-
sure, compute the score for every pair and rank the
pairs by their scores. Then plot the rankings against
each other so as to see whether the measures agree on
which pairs of words contain the most strongly associ-
ated words. In order to have a statistically significant
set of word pairs, we parsed the XML dump of the
French Wikipedia dated September 14, 2009 (5 Gb of
text). After filtering, we kept about one million arti-
cles that had at least a Wikipedia category associated
with them
3
. We then parsed the articles, and for each
word appearing in a category name, we recorded its
co-occurrences with all the other words also appear-
ing in category name. After removing French gram-
matical stop words as well as words occurring in less
than 100 documents, we eventually ended up with a
set of 70 922 word pairs. We then ranked these pairs
according to the different measures and then plotted
the so obtained ranks against each other.
The scatter plot in figure 1 shows that, compared
to PMI, NPMI only slightly improves the bias towards
low frequency pairs. The graph follows a rough diag-
onal. In contrast, figure 2 shows that moving from
NPMI to PMI
3
has a dramatic effect as far as the as-
signed ranks are concerned. By looking at this kind of
graph one can get a visual insight on the global effects
of switching from one variant to another.
To get a more precise view, it is useful to focus
on the most frequent pairs. The plots in figure 3 and
figure 4 compare the ranks assigned by NPMI, PMI
2
and PMI
3
to the 500 most frequent pairs in the corpus.
3
Categories are short phrases that represent the main
topics of an article. Usually several categories are assigned
to a given article.
HANDLING THE IMPACT OF LOW FREQUENCY EVENTS ON CO-OCCURRENCE BASED MEASURES OF
WORD SIMILARITY - A Case Study of Pointwise Mutual Information
229
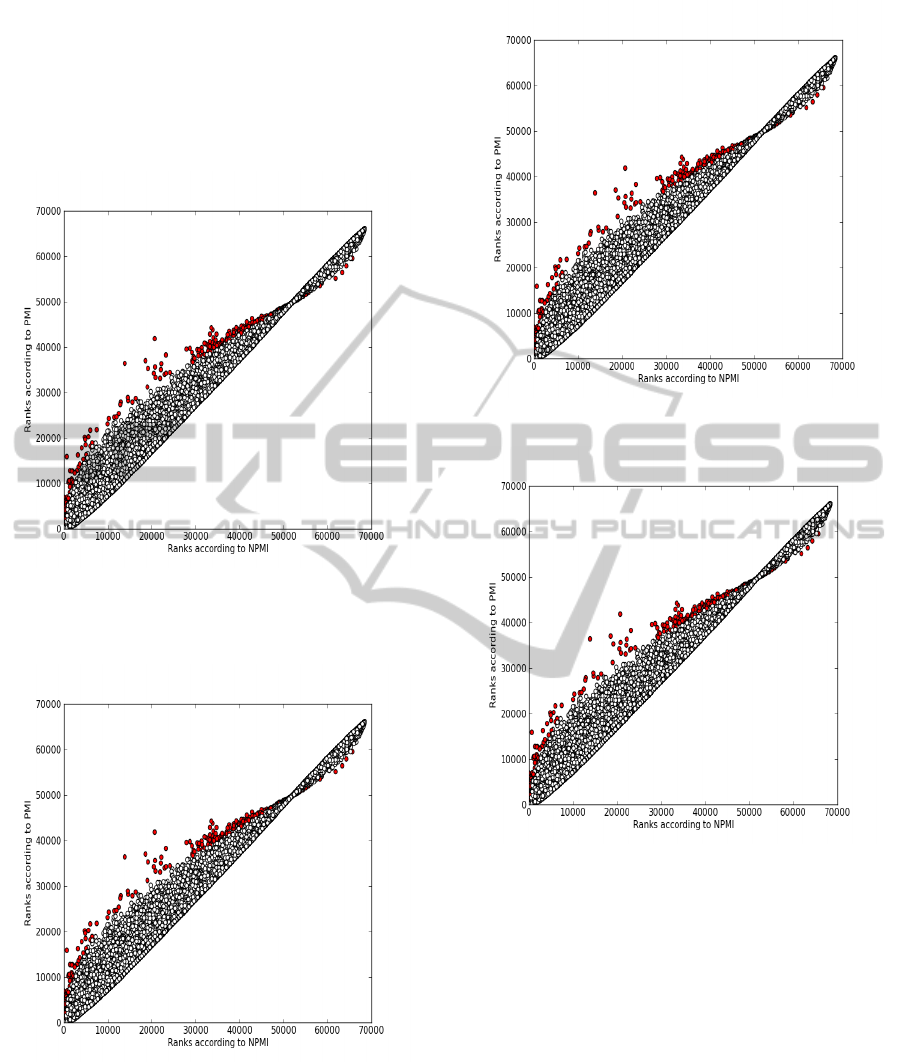
From figure 3, it is clear that these pairs are ranked
among the first by PMI
3
while the ranks assigned by
NPMI are more variable. This is a confirmation of fig-
ure 2 and shows that using PMI
3
to find words related
to another word would certainly result in quite more
general terms than if using NPMI.
Figure 1: Scatter plot of the ranks assigned by PMI (vertical
axis) and NPMI (horizontal axis). The plot reveals a near-
linear relationship. The correction brought about by NPMI
is not very significant for this corpus.
Figure 2: Scatter plot of the ranks assigned by NPMI (ver-
tical axis) and PMI
3
(horizontal axis).
4 CONCLUSIONS
We have proposed formulae that help better under-
stand and predict the behaviour of some important
word assocation measures based on PMI, especially
Figure 3: The 500 most frequent pairs as ranked by NPMI
and PMI
3
.
Figure 4: The 500 most frequent pairs as ranked by PMI
3
and PMI
2
. The most frequent pairs are clearly ranked first
by both measures.
concerning the way these measures behaves w.r.t fre-
quency. More specifically, to the best of our knowl-
edge, it is the first time that the notorious bias of PMI
towards low frequency and the ways to correct it have
been examined in detail. We also feel that this study
will help fill a gap in the literature by providing a
comprehensive formalization and comparison of sev-
eral importants variants of PMI. In future, we plan
to use rank correlation methods such as Spearman’s
Rho and Kendall’s Tau to get another indicators of
differences in sensitivity to frequency. Additional vi-
sualization methods will also be investigated in order
to determine how to best help researchers and corpus
practitioners in choosing the right PMI based associ-
ation measure given the corpus and the task at hand.
KDIR 2011 - International Conference on Knowledge Discovery and Information Retrieval
230

REFERENCES
Bullinaria, J. and Levy, J. (2007). Extracting semantic
representations from word co-occurrence statistics: A
computational study. Behavior Research Methods,
page 510.
Church, K. W. and Hanks, P. (1990). Word association
norms, mutual information, and lexicography. Com-
putational Linguistics, 16(1):22–29.
Croft, W. B., Metzler, D., and Strohman, T. (2010). Search
engines: information retrieval in practice. Pearson -
Addison Wesley.
Daille, B. (1994). Approche mixte pour l’extraction au-
tomatique de terminologie : statistiques lexicales et
filtres linguistiques. PhD thesis, Universit Paris 7
(1994).
Evert, S. (2004). The statistics of word cooccurrences: word
pairs and collocations. Unpublished doctoral disser-
tation, Institut f
¨
ur maschinelle Sprachverarbeitung,
Universit
¨
at Stuttgart.
Gerlof, B. (2006). Normalized (pointwise) mutual informa-
tion in collocation extraction. In Proceedings of the
Biennial GSCL Conference, pages 31–40, Gunter Narr
Verlag. Chiarcos, Eckart de Castilho & Stede (eds).
Hoang, H. H., Kim, S. N., and Kan, M.-Y. (2009). A re-
examination of lexical association measures. In MWE
’09: Proceedings of the Workshop on Multiword Ex-
pressions, pages 31–39, Morristown, NJ, USA. Asso-
ciation for Computational Linguistics.
Lee, L. (1999). Measures of distributional similarity. In
37th Annual Meeting of the Association for Computa-
tional Linguistics, pages 25–32.
Manning, C. D. and Schutze, H. (1999). Foundations of
Statistical Natural Language Processing. The MIT
Press.
Pecina, P. and Schlesinger, P. (2006). Combining associa-
tion measures for collocation extraction. In Proceed-
ings of the COLING/ACL on Main conference poster
sessions, pages 651–658, Morristown, NJ, USA. As-
sociation for Computational Linguistics.
Petrovic, S., Snajder, J., and Basic, B. D. (2010). Extend-
ing lexical association measures for collocation ex-
traction. Computer Speech & Language, 24(2):383–
394.
Terra, E. and Clarke, C. L. A. (2003). Frequency estimates
for statistical word similarity measures. In NAACL
’03: Proceedings of the 2003 Conference of the North
American Chapter of the Association for Computa-
tional Linguistics on Human Language Technology,
pages 165–172, Morristown, NJ, USA. Association
for Computational Linguistics.
Terra, E. and Clarke, C. L. A. (2005). Comparing query
formulation and lexical affinity replacements in pas-
sage retrieval. In SIGIR Workshop on Methodolo-
gies and Evaluation of Lexical Cohesion Techniques
in Real-world Applications. Salvador, Brazil, August
2005, pages 11–18. ACM Press.
Thanopoulos, A., Fakotakis, N., and Kokkinakis, G. (2002).
Comparative evaluation of collocation extraction met-
rics. In Proceedings of the LREC 2002 Conference,
pages 609–613.
Turney, P. D. (2001). Mining the Web for synonyms: PMI-
IR versus LSA on TOEFL. In ECML-01, pages 491–
502, Freiburg, Germany.
Vechtomova, O. and Robertson, S. (2000). Integration
of collocation statistics into the probabilistic retrieval
model. In Proceedings of the 22nd British Computer
Society - Information Retrieval Specialist Group Con-
ference 2000, pages 165–177.
HANDLING THE IMPACT OF LOW FREQUENCY EVENTS ON CO-OCCURRENCE BASED MEASURES OF
WORD SIMILARITY - A Case Study of Pointwise Mutual Information
231
