
EFFECT OF CORRELATION BETWEEN CLINICAL TESTS ON
THE PERFORMANCE OF A MULTIPLE TEST-BASED
DIAGNOSTIC SYSTEM
Study with a Logistic Model and Neural Nets
Noriaki Ikeda
1
, Kai Ishida
2
, Harukazu Tsuruta
1
and Akihiro Takeuchi
1
1
Medical Informatics, School of AHS, Kitasato University, Sagamihara, Kanagawa Japan
2
Graduate School of Medical Sciences, Kitasato University, Sagamihara, Kanagawa Japan
Keywords:
Multiple tests, Diagnostic performance, Correlation between tests, Logistic model, Neural nets.
Abstract:
To examine the improvement of diagnostic performance by combining multiple tests, an algorithm was de-
veloped for generation of simulated data with arbitrary sensitivity, specificity and inter-test correlations. The
effects of the number of tests and inter-test correlations on the diagnostic performance were studied using a
logistic model and neural network (NN) models. The diagnostic performance measured by the concordance
index, c, increased as the number of tests increased. For the same number of tests, the diagnostic performance
was lowered by positive correlation and was elevated by negative correlation. Improvement of the performance
was not obtained by increasing the number of NN layers.
1 INTRODUCTION
It is a common practice in clinical medicine to de-
velop a better (more reliable) diagnostic system using
multiple tests that individually are less reliable (Ikeda
et al., 2006; Ikeda et al., 2007). For example, Hara et
al. reported that a better diagnostic index for predic-
tion of improvement of left ventricular ejection frac-
tion (LVEF) after cardiac resynchronization therapy
(CRT) in patients with heart failure could be obtained
using a combination of three indices of cardiac func-
tion, such as Radial, OWD and IVMD (Hara, 2008).
A logistic model is often used for combining mul-
tiple tests, each of which has a sensitivity and speci-
ficity. The factor with a greater sensitivity and speci-
ficity has a larger regression coefficient. A neural net-
work (NN) model may be effectively used for a case
with strong nonlinearity.
If the tests are mutually independent the diagnos-
tic performance is expected to increase as the number
of combined tests becomes large. The first problem is
to determine the relationship between the diagnostic
performance and the number of tests. However, there
are often correlations among tests. Improvement in
diagnosis is clearly not possible if these correlations
are strongly positive, whereas the effect of a negative
correlation is less clear. Therefore, the second prob-
lem is to determine the effect of inter-test correlations
on the diagnostic performance.
The purpose of the present study was to develop
an algorithm that calculates the probability of the
outcome of combined tests when the sensitivity and
specificity of each test and the inter-test correlations
are given, and to study the two problems described
above based on simulated data generated by the algo-
rithm.
In this study, we only deal with binary tests with
outcomes that are positive (1) or negative (0).
2 METHODS
2.1 Joint Probability of Two Tests
The relationship between disease D and a clinical test
T
i
can be presented as a contingency table (Table 1),
in which D reflects the status of the patient (D = 1
indicates having the disease and D = 0 indicates not
having the disease) and T
i
indicates the result of the
i-th test (positive T
i
=1, negative T
i
= 0).
The sensitivity and specificity of the test are rep-
resented by α
i
and β
i
, respectively. For D = 1, the
correlation coefficient between test T
i
and test T
j
is
326
Ikeda N., Ishida K., Tsuruta H. and Takeuchi A..
EFFECT OF CORRELATION BETWEEN CLINICAL TESTS ON THE PERFORMANCE OF A MULTIPLE TEST-BASED DIAGNOSTIC SYSTEM - Study
with a Logistic Model and Neural Nets.
DOI: 10.5220/0003655703260329
In Proceedings of the International Conference on Neural Computation Theory and Applications (NCTA-2011), pages 326-329
ISBN: 978-989-8425-84-3
Copyright
c
2011 SCITEPRESS (Science and Technology Publications, Lda.)

Table 1: Contingency table of test Ti and diagnosis D.
D = 1 D = 0
T
i
= 1 α
i
1− β
i
T
i
= 0 1− α
i
β
i
r
+
ij
; and for D = 0, the correlation coefficient is r
−
ij
.
For a case with D = 1, the joint probability
p
+
km
,(k,m = 0, 1) of T
i
and T
j
are given by:
p
+
11
= Pr(T
i
= 1,T
j
= 1) = α
i
α
j
+ φ
+
ij
(1)
p
+
10
= Pr(T
i
= 1,T
j
= 0) = α
i
(1− α
j
) − φ
+
ij
(2)
p
+
01
= Pr(T
i
= 0,T
j
= 1) = (1− α
i
)α
j
− φ
+
ij
(3)
p
+
00
= Pr(T
i
= 0,T
j
= 0) = (1− α
i
)(1− α
j
) + φ
+
ij
, (4)
where
φ
+
ij
= r
+
ij
q
α
i
α
j
(1− α
i
)(1− α
j
). (5)
For a case with D = 0, similar relationships are
obtained by replacing α
i
by 1− β
i
Cα
j
by 1− β
j
Cr
+
ij
by r
−
ij
Cand φ
+
ij
by φ
−
ij
,
p
−
11
= Pr(T
i
= 1, T
j
= 1) = (1− β
i
)(1− β
j
) + φ
−
ij
(6)
p
−
10
= Pr(T
i
= 1,T
j
= 0) = (1− β
i
)β
j
− φ
−
ij
(7)
p
−
01
= Pr(T
i
= 0,T
j
= 1) = β
i
(1− β
j
) − φ
−
ij
(8)
p
−
00
= Pr(T
i
= 0, T
j
= 0) = β
i
β
j
+ φ
−
ij
(9)
where
φ
−
ij
= r
−
ij
q
β
i
β
j
(1− β
i
)(1− β
j
) (10)
2.2 Data Generation Algorithm
A general theory of the distribution of n binary items
has been established (Bahadur, 1961).
Let X denote the set of all points x = (x
1
,x
2
,...,x
n
)
with each x
i
= 0 or 1. Let p(x) be a given probability
distribution on X, i.e.,
p(x) ≥ 0,
∑
x∈X
p(x) = 1. (11)
For each i = 1,...,n, let
α
i
= E
p
(x
i
), 0 < α
i
< 1, i = 1,...,n (12)
where E
p
denotes the expected value about p. If the
variables x
1
,x
2
,...,x
n
are mutually independent, we
have
p(x) =
n
∏
i=1
α
x
i
i
(1− α
i
)
1−x
i
(13)
When there are correlation among the variables, Ba-
hadur gave the following theorem (Bahadur, 1961).
mTheoremn@For all x = (x
1
,x
2
,...,x
n
) on X
p(x) =
n
∏
i=1
α
x
i
i
(1− α
i
)
1−x
i
f(x) (14)
with
f(x) = 1 +
∑
i< j
r
ij
y
i
y
j
+
∑
i< j<k
r
ijk
y
i
y
j
y
k
+... + r
12···n
y
1
y
2
· · · y
n
(15)
y
i
= (x
i
− α
i
)/
p
α
i
(1− α
i
) (16)
r
ij
= E
p
(y
i
y
j
) (17)
r
ijk
= E
p
(y
i
y
j
y
k
) (18)
... (19)
r
12···n
= E
p
(y
1
y
2
· · · y
n
), (20)
where r
ij
is the second-order correlation, r
ijk
is the
third-order correlation, etc.
Similarly, if we set
1− β
i
= Pr(x
i
= 1|D = 0) (21)
z
i
= (x
i
− 1+ β
i
)/
p
β
i
(1− β
i
), (22)
then the probability distribution q(x) for D = 0 is
given by
q(x) =
n
∏
i=1
β
1−x
i
i
(1− β
i
)
x
i
g(x) (23)
with
g(x) = 1+
∑
i< j
s
ij
z
i
z
j
+
∑
i< j<k
s
ijk
z
i
z
j
z
k
+... + s
12···n
z
1
z
2
· · · z
n
(24)
s
ij
= E
p
(z
i
z
j
) (25)
s
ijk
= E
p
(z
i
z
j
z
k
) (26)
... (27)
s
12···n
= E
p
(z
1
z
2
· · · z
n
). (28)
With this theory, all probabilities of combination
of outcomes of tests with arbitrary sensitivity, speci-
ficity and correlations among the tests can be com-
puted.
2.3 Example of Test Data
A data set of N tests with the following conditions was
generated by the method described in section 2.2. The
sensitivity and specificity of each test were both set to
0.6:
α
i
= β
i
= 0.6, i = 1,2,...,N. (29)
We define R
+
as the correlation matrix among
tests for the population with disease (D
+
), and R
−
as
that for the population with no disease (D
−
). Higher
order correlations (> 2) were set to zero in this study,
EFFECT OF CORRELATION BETWEEN CLINICAL TESTS ON THE PERFORMANCE OF A MULTIPLE
TEST-BASED DIAGNOSTIC SYSTEM - Study with a Logistic Model and Neural Nets
327

although they can easily be considered. An example
data set with N = 4 and the correlation matrix
R
+
= R
−
=
1.0 −0.3 0.0 0.0
−0.3 1.0 0.0 0.0
0.0 0.0 1.0 0.0
0.0 0.0 0.0 1.0
(30)
is shown in Table 2. The frequency of each outcome
of the tests was calculated according to p(x) and with
the number of cases of D
+
and D
−
set at 1000.
2.4 Diagnostic Systems
The following three models were examined as the di-
agnostic system.
(1) LG1: Logistic model.
(2) NN1: Neural net with a single layer.
(3) NN2: Neural net with two layers with 5 cells.
Table 2: Test data generated by the simulation.
Outcome of the tests Frequency
T
1
T
2
T
3
T
4
D
+
D
−
0 0 0 0 14 104
1 0 0 0 21 69
0 1 0 0 21 69
1 1 0 0 32 46
0 0 1 0 50 112
1 0 1 0 75 75
0 1 1 0 75 75
1 1 1 0 112 50
0 0 0 1 50 112
1 0 0 1 75 75
0 1 0 1 75 75
1 1 0 1 112 50
0 0 1 1 46 32
1 0 1 1 69 21
0 1 1 1 69 21
1 1 1 1 104 14
2.5 Evaluation of Diagnostic
Performance
As the indices of performance of the system, we cal-
culated the Somers’D (Gini coefficient), Goodman-
Kruskal gamma, Kendall’s Tau-a, and the concor-
dance index, c, which are closely related to each other.
We chose to use the value of the concordance index
for each result, because this index is known to give the
area under the receiver operating characteristic (ROC)
curve of the diagnostic system.
2.6 Computation Methods
SAS 9.1.3 was used for logistic analysis and MAT-
LAB (Neural Net Toolbox) was used for the NN1 and
NN2 calculations.
3 RESULTS
For cases with N = 3 − 7, the sensitivity and speci-
ficity were set to 0.6. For each case, computation was
performed under the following three conditions:
(a) Independent: R
+
= R
−
= I
(b) Positive correlation: R
+
(1,2) = R
−
(1,2) = 0.3
(c) Negative correlation: R
+
(1,2) = R
−
(1,2) = −0.3
3.1 Comparison of the Diagnostic
Systems
We did not find any significant differences among the
three diagnostic systems, LG1, NN1 and NN2. The
results from NN1 are shown in Table 3.
Table 3: Concordance index c.
N (a)Independent (b)Positive R (c)Negative R
3 0.683 0.665 0.697
4 0.710 0.693 0.714
4 0.737 0.720 0.740
4 0.758 0.745 0.761
4 0.759 0.757 0.781
3.2 Effect of the Number of Tests
The concordance index, c, increased as the number
of tests increased. The ROC curve for each case is
shown in Figure 1.
3.3 Effect of Correlation between Tests
As shown in Table 3, the diagnostic performance of
the combined tests was worse in a case of positive cor-
relation between tests and better in a case of negative
correlation, compared to the independent case.
4 CONCLUSIONS
Examination of the improvement of diagnostic per-
formance by combining multiple tests requires an al-
gorithm for generating simulated data with arbitrary
sensitivity, specificity and inter-test correlations.
NCTA 2011 - International Conference on Neural Computation Theory and Applications
328
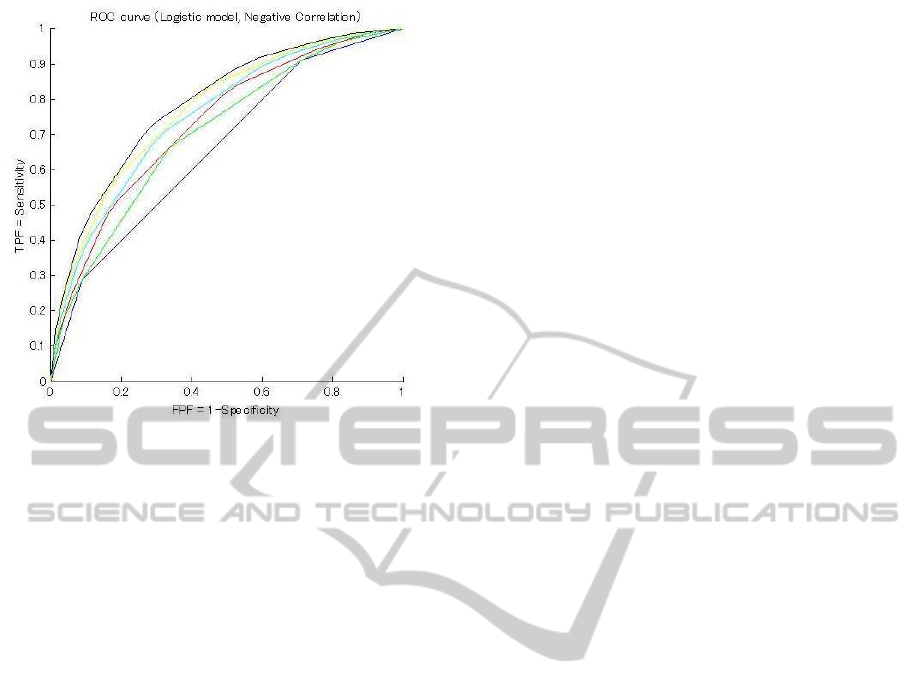
Figure 1: ROC curve of the diagnostic system for different
number of tests, N. N=2 (blue), 3 (green), 4 (red), 5 (cyan),
6 (yellow) and 7 (black).
The effects of the number of tests and inter-test
correlations on the diagnostic performance were stud-
ied using a logistic model and neural network models.
The diagnostic performance measured by the con-
cordance index, c, increased as the number of tests
increased. For the same number of tests, the diagnos-
tic performance was reduced by positive correlation
and elevated by negative correlation. Improvement of
the performance was not obtained by increasing the
number of NN layers.
ACKNOWLEDGEMENTS
This study was funded in part by a grant from the
Kitasato University School of Allied Health Sciences
(No. 2010-6604).
REFERENCES
Bahadur, R. R. (1961). A representation of the joint dis-
tribution of responses to n dichotomous items. In
Solomon, H., editor, Studies in Item Analysis and Pre-
diction, pages Chapter 9:158–160. Stanford Univer-
sity Press.
Hara, H. (2008). A logistic analysis of left ventricular ejec-
tion fraction (LVEF) after CRT. In American Heart
Association 2008.
Ikeda, N., Bax, L., Henmi, O., Mamorita, N., Tsuruta, H.,
Shibata, S., and Takeuchi, A. (2007). Study of a lo-
gistic model with mutually correlated variables using
a generation algorithm of dichotomous data with arbi-
trary sensitivity, specificity and correlation. In MED-
INFO 2007. , Brisbane, Australia. (Proc 2486-2488).
Ikeda, N., Shibata, S., Bax, L., Henmi, O., Mamorita, N.,
Tsuruta, H., and Takeuchi, A. (2006). Diagnostic per-
formance of combined tests using a generation algo-
rithm of multiple tests with arbitrary sensitivity, speci-
ficity and correlation. In MEDSIP 2006. Glasgow,
UK.
EFFECT OF CORRELATION BETWEEN CLINICAL TESTS ON THE PERFORMANCE OF A MULTIPLE
TEST-BASED DIAGNOSTIC SYSTEM - Study with a Logistic Model and Neural Nets
329
