
MEASURING THE CAPABILITY OF LIVING A HEALTHY LIFE
WITH FUZZY LOGIC IN A GENDER PERSPECTIVE
Tindara Addabbo
1
, Gisella Facchinetti
2
and Tommaso Pirotti
1
1
Dipartimento di Economia Politica, Facolt
`
a di Economia, Universit
`
a di Modena e Reggio Emilia
Viale Berengario 51, Modena (MO), Italy
2
Dipartimento di Scienze Economiche e Matematico Statistiche, Universit
`
a del Salento
Centro Ecotekne Pal. C - S.P. 6, Lecce - Monteroni, Lecce (LE), Italy
Keywords:
Fuzzy logic, Health, Capabilities, Gender perspective.
Abstract:
The capability of living a healthy life may be considered a key dimension in the construction of individual
well-being. It is itself the outcome of a complex set of indicators also including subjective indicators. This
paper measures health at an individual level by using fuzzy logic to maintain the complexity of its definition
while providing a crisp indicator of the level of health which may be disaggregated in relevant intermediate
variables. The system has been implemented on the basis of the Italian National Statistical Institute (ISTAT)
survey on health conditions, the results of which show a higher level of gender inequality in health than ,may
be obtained by the traditional techniques used to measure health. We do find that when controlling for age,
women are still characterized by poorer health conditions. Data disaggregated by regional area show a degree
of variability in the outcome which may be connected to the varying policies implemented in different regions
of Italy.
1 INTRODUCTION
This paper presents the initial results of a wider re-
search project supported by the Italian Ministry of
Health on gender and health
1
. It is made up of six
projects, each dealing with different aspects from a
gender perspective. One of these projects, that devel-
oped by the research unit of the University of Mod-
ena & Reggio Emilia, is concerned with the socio-
economic determinants of health from a gender per-
spective. We thank the expert group on health (Sivana
Borsari, Maria Cristina Florini and Erica Villa) for
their comments on the construction of the model used
to measure health; Anna Maccagnan for her elabo-
rations of the microdata and the other participants in
the project for their comments on a previous version
of this paper.
This idea is supported by the increasing attention
given in recent years to gender differences and in-
1
This paper is part of the research activities of the Uni-
versity of Modena & Reggio Emilia research unit within the
broader project funded by the Italian Ministry of Health:
“La medicina di genere come obiettivo strategico per la
sanit
`
a pubblica: l’appropriatezza della cura per la salute
della donna”.
equalities, which no longer come down to mere bi-
ological factors also seen within a wider perspective
that includes the concept of women’s capability of
living a healthy life. Nonetheless, in Italy we ob-
serve a systematic lack of appreciation of “gender-
oriented health”, fundamental to guaranteeing equity
and planning efficient health and social services. In
our group’s project, the evaluation of the gender fac-
tor will refer to four dimensions: access to services,
objective and subjective health, life styles and states
of well-being. The classical definition of a country’s
welł-being is usually connected with GDP measure-
ments. The need to take the health dimension into
account in the evaluation of well-being in order to go
beyond GDP and towards an extended measurement
of human development has been widely recognized
in the literature (Fleurbaey, 2009), (Stiglitz et al.,
2009) leading to the proposal of indicators that mea-
sure human development and explicitly include mea-
sures of the health dimension such as the Human De-
velopment Index (United Nations Development Pro-
grammes, 1990). Here we follow Sen’s capability
approach (Sen, 1993) by measuring well-being in its
multidimensional setting devoting special attention to
one dimension: the capability of living a healthy life.
389
Addabbo T., Facchinetti G. and Pirotti T..
MEASURING THE CAPABILITY OF LIVING A HEALTHY LIFE WITH FUZZY LOGIC IN A GENDER PERSPECTIVE.
DOI: 10.5220/0003672403890398
In Proceedings of the International Conference on Evolutionary Computation Theory and Applications (FCTA-2011), pages 389-398
ISBN: 978-989-8425-83-6
Copyright
c
2011 SCITEPRESS (Science and Technology Publications, Lda.)

In defining this capability we are aware of its com-
plexity stemming from various dimensions (physical
vs mental health; subjective vs objective) and bound
up in the social environment that affects its develop-
ment. In order not to lose its complexity while mea-
suring it, we adopt fuzzy logic. Fuzzy logic is ideal,
in our opinion, since it allows us to get to the heart
of the development process of the capability without
losing the various dimensions that interact to define it.
An attempt to exploit fuzzy logic to measure
healthy living has previously been undertaken by
Pirotti (2006) using Italian microdata (yet with a lim-
ited number of variables to define health) and by
Addabbo et al. (2010a) to measure the capability of
living a healthy life in the Modena district. However,
this is the first attempt to implement a fuzzy infer-
ence system on the definition of living a healthy life
with a large number of dimensions at national level
in Italy. Due to the different methodology adopted,
this work differs in methodological terms, from other
previously published papers, dealing with the issue of
health from a capability perspective (Kuklys, 2003).
The fuzzy technique in fact allows us to preserve the
complexity of the measuring issue and, at the same
time through a system of rules,to make explicit the
relationships between the variables that help to assess
the degree of capability development. The presence in
the project of experts in health problems has helped us
in fuzzy inference building, in the fuzzification of in-
puts and in the rule construction. But our purpose is
also to compare our “non main stream” approach with
a classical method to look at differences, faults and
values. So we have looked at the SF12 questionnaire,
which is an instrument adoptedto measure the “health
level” widely used (in over 40 countries) and vali-
dated by the international scientific community. It has
been in use since 1992, when the Medical Outcomes
Study (MOS) developed a standardized survey form
made up of 115 items synthesized in 12 steps. The
MOS was a two year study of patients with chronic
conditions that set up to measure the quality of life,
including physical, mental and general health. The
SF-12 requires only two minutes to be filled in, and it
can be self-reported. It can be added to larger surveys
or printed on a single sheet and easily faxed away.
Due to its handiness, yet still being of great meaning-
fulness as stated before, during the last decade the use
of SF-12 has spread throughout the world. Even the
Italian National Institute of Statistics (ISTAT) decided
to add an SF-12 section to its 2005 national health sur-
vey. So we carried out our analysis using the Italian
Statistical National Institute survey on health condi-
tions in 2004-2005, which provides a set of variables
well-suited to the information needs for the treatment
of the topic in question. Particularly relevant for the
purposes of this work is the information on the mea-
surement of health-related elements of quality of life,
such as obesity, certain diseases, disabilities, on spe-
cialist visits and visits to the ER. Moreover, the survey
contains information on factors that may affect the ca-
pability of living a healthy life and/or its conversion in
functionings. Amongst them, we may identify in the
light of Sen’s capability approach: Socio/Institutional
factors. These refer to the presence of social services
in the region where the individual lives. In a fur-
ther extension, we will also include data on the health
structure available. In this specification of the model,
we do take into account these factors by including re-
gional dummies (given the uneven presence of health
services in the Italian regions). The individual fac-
tors:age, gender, educational level and employment
conditions. We expect to find a negative correlation
between age and health status due to the worsening
of health conditions experienced by the elderly. As
regards the level of education, it is now documented
extensively in the international literature that higher
education is usually associated to a better health. This
is due to a greater awareness of the importance of
lifestyles on health and also to improved access to
health services(Mackenbach et al., 2003). Further-
more a higher education level allows for a wider
choice about of jobs that individuals may take and ac-
cess to posts characterized by healthier conditions as
well as a higher income, which may improve access to
health services. Individuals employment status may
be considered a crucial individual conversion factor:
some contractual arrangements, like temporary work
contracts, given their high level of instability, may
have a negative effect on health, mainly due to the
stress induced by the uncertainty linked to the job se-
curity (Addabbo and Favaro, 2011). Individual health
status, as experienced in literature, is also influenced
by familiar conversion factors such as parents’ educa-
tion level, marital status, parents’ level of health, fam-
ily income and housing conditions. These factors can
affect lifestyles, for example, or access to health ser-
vices.The fuzzy approach we propose provides all the
values of the knowledge-based systems. Everything
is transparent; the rule blocks, which translate the
weights proposed by the experts, are readable and al-
ways justified and may be changed if necessary. SF12
applied to the ISTAT 2005 national survey on health is
not able to produce this effect as its results are based
on a weighted average. Moreover, the weights used
to compute the weighted average were evaluated in
1994 using data based on the 1992 MOS survey for
the USA (Ware Jr et al., 1998); thus, one may question
the validity of the same weights years later and in a
FCTA 2011 - International Conference on Fuzzy Computation Theory and Applications
390

different country. On the other hand, though affected
by the reliability of experts and the need to use a more
complex methodology, fuzzy logic with its tree struc-
ture of the inference system, allows us to understand
the inputs that produce the final result and to improve
the final outcome by devising policies in those areas
that appear to be less developed.
2 THE USE OF A FUZZY
INFERENCE SYSTEM WITHIN
A CAPABILITY APPROACH
FRAMEWORK
Fuzzy logic has been previously used to measure
poverty and well-being by Cheli & Lemmi (1995)
and, by following the capability approach, by Chi-
appero Martinetti (2000). However the method they
follow is different from the one adopted in our con-
tribution. In fact they use a mix of probability theory
and fuzzy logic and data are used to build variables
distributions similar to aleatory distributions, while
the aggregation functions are similar to weighted av-
erages, explained on the basis of weights that are de-
termined ex-ante. In this method the creation of the
membership functions relies on the distribution of ev-
ery single variable in the population of reference. In
our contribution, we use fuzzy logic following more
heuristic methods, which, in our opinion, are more ef-
fective and able to reflect the multidimensionality of
the issue of measuring capabilities without depending
on current data. The system is constructed by follow-
ing experts’ judgments and rules based on their ex-
perience and/or on the literature. The experts start by
choosing the ‘input’ variables, they then propose their
aggregation with ‘intermediate’ variables and then to
an output variable. The latter is interpreted as the fi-
nal evaluation of the development of the functionings
of the capability under analysis. Experts are also re-
sponsible for identifying the membership functions of
the initial variables; therefore, unlike the method fol-
lowed by Chiappero Martinetti (2000) the latter do
not depend on the current available data, but are set
by the experts on the basis of their experience. Ex-
perts suggest how to aggregate input variables by us-
ing only linguistic rules and attributes without seing
the data in advance. The experts’ linguistic rules are
translated formally by mathematicians. The proposed
system of rules is then explicitly described ‘rule by
rule’, allowing us to understand to what extent the re-
sults depend on the ratings determined by the experts.
The method we apply here to measure of the capabil-
ity of living a healthy life has already been used on an
experimental basis for the measurement of well-being
within the capability approach, (Addabbo et al., 2004;
Addabbo et al., 2006; Addabbo and Di Tommaso,
2008; Addabbo et al., 2010b) and specifically for the
measurement of the capability of living a healthy life
by Pirotti (2006) and by Addabbo, Chiarolanza, Fus-
caldo and Pirotti (2010).
3 THE SHORT FORM 12 (SF-12)
This questionnaire is a set of 12 questions relating to
the condition perceived over the four weeks prior to
the interview, allowing us to compile two indexes: the
Physical Component Summary (PCS) (index of phys-
ical health) and Mental Component Summary (MCS)
(index of mental health), with values from 0 to 100.
Because of its brevity and simplicity, it is widely used
in more than 40 countries and has been validated by
the international scientific community(Gandek et al.,
1998). SF-12 is based upon a 12 questions tool of
analysis that has its roots in the instruments used since
1992, when the Medical Outcomes Study (MOS) de-
veloped a standardized survey form consisting of 115
items synthesized in 12 steps. MOS was a two-
year study of patients with chronic illnesses which
aimed to measure the quality of life, including phys-
ical, mental and general health. As part of the MOS,
RAND, (acronym of Research and Development) de-
veloped the 36-Item Short Form Health Survey (SF-
36): a set of generic, coherent and easily adminis-
tered quality-of-life indicators. These measurements
rely upon patient’s self-reporting; thus the adminis-
tration of the survey is very handy, yet a wide range
of literature has backed up the quality of the results
assessed by this survey. Through the analysis of case
studies collected during the MOS project, RAND se-
lected eight groups of questions, or health concepts,
from the original 40 (Ware Jr et al., 1996). Those
chosen represent the most frequently measured con-
cepts in widely-used health surveys and those most af-
fected by disease and treatment (Ware Jr et al., 1993).
The questionnaire items selected also represent mul-
tiple operational indicators of health, including: be-
havioural function and dysfunction, distress and well-
being, objective reports and subjective ratings, and
both favourable and unfavourable self-evaluations of
general health status (Ware Jr et al., 1993). This psy-
chometric survey was first developed in the US and
then developed internationally over the last 10 years.
The SF-36 idea is based on a three-level tree scheme,
starting from the single 36 items, aggregating them
in eight scales and defining the summary measures of
physical and mental health on the third level (respec-
MEASURING THE CAPABILITY OF LIVING A HEALTHY LIFE WITH FUZZY LOGIC IN A GENDER
PERSPECTIVE
391
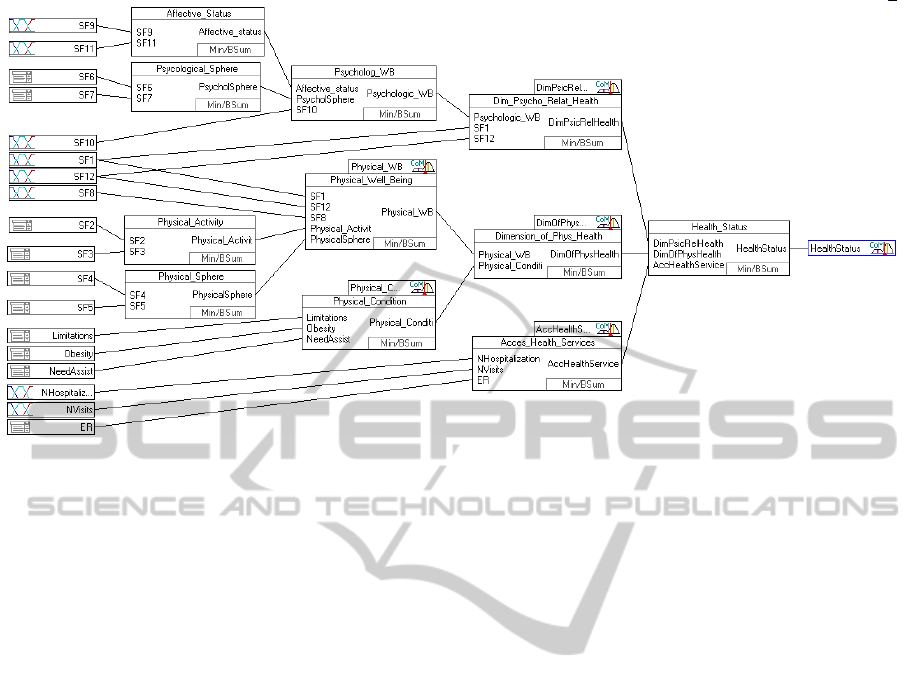
Figure 1: The chosen fuzzy inference system tree.
tively PCS and MCS). The discovery that SF-36 phys-
ical and mental component summary scales (referred
to as PCS-36 and MCS-36 respectively) capture about
85% of the reliable variance in the eight-scale SF-36
health profile provided a new strategy for meeting this
challenge. While two outcome measures are satisfac-
tory for many purposes, a survey with fewer ques-
tionnaire items could be constructed to estimate these
outcomes. Predictive studies supported this strategy.
12 SF-36 items and improved scoring algorithms re-
produced at least 90% of the variance in PCS-36 and
MCS-36 in both general and patient populations, and
reproduced the profile of eight SF-36 health concepts
sufficiently for large sample studies. The reproduc-
tions of PCS-36 and MCS-36 proved to be accurate
enough to warrant the use of published norms for SF-
36 summary measures in interpreting SF-12 summary
measures. The SF-12 Survey represents an efficient
synthesis of SF-36. Several empirical studies also
conducted in European populations showed that the
synthetic indices of the SF-12 correlated with the cor-
responding indices of the SF-36 with a range of values
between 0.93 and 0.97 (Gandek et al., 1998). SF-12
requires only two minutes to be filled in, and it may
be self-reported. It can be added to larger surveys or
printed on a single sheet and easily faxed away. Due
to its handiness, yet still being of great meaningful-
ness as stated before, over the last decade the use of
SF-12 has spread all over the world. Even the Ital-
ian National Institute of Statistics (ISTAT) decided to
add an SF-12 section to its 2005 national survey on
health. We will use variables collected in the ISTAT
Survey by using SF-12s to construct our fuzzy infer-
ence system (FIS) on the capability of living a healthy
life and compare the results obtained through FIS to
the original SF-12 outputs.
4 A FUZZY INFERENCE SYSTEM
TO MEASURE THE HEALTH
OF THE ITALIAN
POPULATION
A fuzzy inference system (FIS) (Figure 1) may be
graphically represented as a tree. Starting from the
right hand side we see the output of the system: the
health status. Moving to the left, the tree grows and
presents various nodes, representing the intermediate
variables describing the macro-indicators, through to
the smallest branches which show the initial inputs.
The basic input variables that appear on the left side
of the tree conceptually pertain to three different ar-
eas: the first, concerning perceived physical and men-
tal health; the second, whicj attains to more objective
indicators of physical health, and the third, which re-
gards access to health services. Lifestyles were not
taken into account because they represent risk fac-
tors in the medium and long term but they are not
“manifestations” of the immediate state of health of
individuals. What we aim to do here is instead to
understand the health status over a relatively short
period, such as the last four weeks. Instead of di-
rectly using SF-12 outcomes, available as a ready to
use variable, we decided to build a “fuzzy SF-12”,
the results of which (Physical Well-being and Dimen-
FCTA 2011 - International Conference on Fuzzy Computation Theory and Applications
392

Table 1: The system variables: abbreviations and relative questions.
ER Did you need assistance from the ER during the last 12 months?
Limitations Did you experience limitations during at least the last six months?
NeedAssist Do you think that you need house care assistance?
NHospitalizations Number of Hospitalizations in the last 3 months
NVisits Number of visits during the last 4 weeks
Obesity Are you obese?
SF1 In general, would you say your health is: excellent, very good, good, fair or poor?
SF10 How much of the time during the past 4 weeks did you have a lot of energy?
SF11 How much of the time during the past 4 weeks have you felt downhearted and blue?
SF12 During the past 4 weeks, how much of the time has your physical health or emo-
tional problems interfered with your social activities (like visiting with friends, rela-
tives, etc.)?
SF2 Does your health now limit you in moderate activities, such as moving a table, pushing
a vacuum cleaner, bowling, or playing golf
SF3 Does your health now limit you in climbing several flights of stairs?
SF4 During the past 4 weeks (relatively to your work or other regular daily activities as a
result of any physical problems) did you accomplished less than you would like?
SF5 During the past 4 weeks, as a result of any physical problems, were you limited in the
kind of work or other regular daily activities?
SF6 During the past 4 weeks (relatively to your work or other regular daily activities as a
result of any emotional problems such as feeling depressed or anxious) did you accom-
plished less than you would like?
SF7 During the past 4 weeks, as a result of any emotional problems such as feeling de-
pressed or anxious, didn’t you do work or other regular daily activities as carefully as
usual?
SF8 During the past 4 weeks, how much did pain interfere with your normal work (includ-
ing both paid work and housework)?
SF9 How much of the time during the past 4 weeks have you felt calm and peaceful?
AccHealthService Access to the Health Services
DimOfPhysHealth Dimension of Physical Health
DimPsicRelHealth Dimension of Psycho-Relational Health
HealthStatus Health Status
Physical Conditi Physical Condition
Physical WB Physical Well-being
Affective status Affective Status
Physical Activit Physical Activity
PhysicalSphere Physical Sphere
PsycholSphere Psychological Sphere
sion of Psychological and Relational Health) could
be used as intermediate variables for the final “sta-
tus of health index” and at the same time, be com-
pared to the original Physical Component Summary
(PCS) SF-12 index of physical health and the Mental
Component Summary (MCS) SF-12 index of men-
tal health. The reason for this choice is that, as al-
ready stated, even though the SF-36 idea relies on a
tree scheme basis, SF-12 outcomes are obtained as a
reduction of the variables based on a statistical ba-
sis that makes impossible to reconnect the final SF-
12 analysis scheme to the original logic that guided
the researchers in first place. According to the SF-
12 operative manual, MCS and PCS are built through
the use of weighted means, using regressive coeffi-
cients coming from analysis based on the American
population. However, the coefficients are given and
derived from SF-36 coefficients that, in turn, come
from the original 115 questions of the MOS survey;
therefore, it is hard to trace back the path that led
to the construction of the coefficients. Moreover, we
believe that the assumption that the coefficients esti-
mated using a sample representative of the American
population in the mid ‘90s remains valid even when
applied to the analysis of other countries and almost
ten years later is rather strained. There is no guaran-
tee of the validity of results. As a last consideration,
we must notice that MCS and PCS are two indica-
MEASURING THE CAPABILITY OF LIVING A HEALTHY LIFE WITH FUZZY LOGIC IN A GENDER
PERSPECTIVE
393

tors that have been designed to be two well separated
indexes, not to be bundled toghether in a single syn-
thetic health indicator. Instead in our opinion, sup-
ported by our health experts’ opinions and by the lit-
erature, it is possible to proceed with the construction
of a third synthetic index that takes into account ele-
ments of both dimensions. For this reason, even if we
assume that SF-12 results are proven to be reliable,
we wanted to produce indexes whose results could
arise from immediately understandable choices and
that could also produce a unified health index. Our
“fuzzy SF-12” is hence an expert system, driven by
experts’ judgments, so that the survey outcomes are
the direct reflection of a precise will, connected to the
analysis of the specific Italian framework. Moreover
in our evaluation system, following Wagstaff et alt.
(1991) we have decided to propose not just the PCS
and MCS scheme, but three macro-indicators (physi-
cal and mental health, physical condition and access
to the health services). The “health” of the fuzzy sys-
tem’s final output (Health Status) investigated from
a physical point of view (physical health dimension)
and a mental or psychological point of view (mental
health dimension) use the items in the SF-12 survey;
however, it is not just the result of the use of these
items: firstly we have a third dimension, bound up in
the actual use of services and structures connected to
the healthcare service. Thus in our vision there are
not just two dimensions but three. We have noticed
that SF-12 items are far too connected to a subjec-
tive evaluation of health. This third leg of the tree
helps to connect subjective to objective information.
In addition to this the physical health dimension is not
just the result of the elaboration of the SF-12 items,
but, for the same reason, we have added physical ob-
jective data. Looking at the PCS items, it becomes
clear that the items attain to “Physical Well-being”.
For a comprehensive evaluation of health, its percep-
tion represents an important reference as it helps to
capture the multidimensionality of the concept itself,
defined according to the World Health Organization
as a state of “complete physical, mental and social
wellbeing” (Di Martino, 2008). Adding information
about people’s physical conditions greatly helps to
better evaluate the dimension of physical health. In
this way functional indicators define health in rela-
tion to the loss of skills in performing ‘normal’ daily
activities. Medical indicators identify the presence of
specific diseases or disabling conditions diagnosed by
physicians. Subjective ones,on the other hand, de-
fine health according to the perception of the indi-
vidual. In a fuzzy system, the same variable can be
used several times. The complexity of relationships
between different determinants of individual health is
indicated by the presence of some input variables, in
keeping with the literature in more than one dimen-
sion of the state of individual health. The “access to
health care services” dimension comprises informa-
tion (or basic variables) as the number of hospital-
izations (excluding childbirth hospitalizations), over
the past three months, the number of accesses to the
Emergency Room (ER) over the past 12 months, not
counting the so called white codes, meaning wrong
or unnecessary accesses to the ER, and the number
of doctors’s visits, excluding dental visits. As may be
easily understood, the effect of these variables (and of
the intermediate index) on the final variable, “individ-
ual health status” is negative because a high number
of accesses to health services is likely to be connected
to a poor health status. In order to fuzzify the inputs,
the experts have decided to identify three linguistic
membership functions per each variable, respectively
named “none”, “some” and “many”. These are ap-
plied to “number of visits”, for which 0 is connected
to the spike of none, 2 to the spike of some and 4 to
the spike of many.
Figure 2: Fuzzyfication scheme and membership functions
of N Visits.
The same membership functions (MBFs) were ap-
plied to the number of hospitalizations, so that 0 is
associated to none, some to 3 and many to 5. The ac-
cess to the ER instead is just a dummy and it tells us
whether an individual had to ask for assistance over
the previous 12 months.
Figure 3: Fuzzyfication scheme and membership functions
of N Hospitaliz.
The aggregation method amongst fuzzified vari-
ables is not an explicit function, but it is expressed in
the form of the explicit rule block, where every pos-
sible interaction between the fuzzy sets (for instance
none, some and many( is represented by a block line
FCTA 2011 - International Conference on Fuzzy Computation Theory and Applications
394

in the “IF” part, while the effect on the variable on
which they insist is represented by a synthetic lexical
effect in the “THEN” part. Since more than one rule
may be activated at the same time, every rule is ac-
tivated with the MIN aggregating rule, which stands
for the minimum level of activation between the sets
(always between 0 and 1), acting in the “IF” part. If
a term is activated with a level of 0, it means that it
is absolutely not activated (the data do not belong to
that fuzzy set). On the other hand if the level is 1 it
means that the term is fully activated, meaning that
the data belongs entirely to that specific term and just
to that one. Every number in between stands for a
partial belonging between different fuzzy sets. The
way the membership degree to a particular fuzzy set
is decided depends on the specific membership func-
tion of every fuzzy set. On the THEN side, there may
be many lines that lead to the same lexical effect. If
there are more activated lines in the same rule block
with the same effect, the chosen aggregation rule is
the bounded sum (BSUM): all the effect activation
levels get summed up tol the level of 1. Any effect
added to that level produces no result. The described
aggregating process, through the use of rule blocks, is
iterated from the left to the right of the system tree. At
the end of the process, to make the results intelligible
to human beings it is necessary to de-fuzzify them.
This is done with a system called “Center of Maxi-
mum” or, in short, CoM: if more effect are active at
the same time in the final rule block, only the highest
will be considered and the result will be equivalent to
the peak of its membership function.
The variable named “Dimension of Physical
Health” was designed to be an aggregation between
the “Physical condition” and the “Physical Well-
being”. The “Physical condition” identifies health
conditions caused by chronic or incapacitating dis-
eases through objective indicators such as the pres-
ence of limitations for at least six months, need for
home care, and finally the presence of obesity, dis-
criminated by body mass index values over 30 among
over 18s, while in the population below 18 years of
age, the corrections suggested in the literature were
adopted (Cole et al., 2000). While the first of the
three basic indicators may be seen as a categorical
variable on three levels, the other two are dummy
variables. “Physical well-being”, contributing to the
definition of the “Dimension of physical health”, uses
some of the 12 items that make up the SF-12 ques-
tionnaire. The reason was to identify the most signif-
icant scales underlying the conceptual model, which
lead to the creation of the PCS of the SF-12 survey
(Apolone et al., 2005; Gandek et al., 1998). There-
fore, in detail the input variables are conceptually re-
Table 2: A rule-block example:the access to health services.
If Then
Hospitalizations Visits E.R. Health Service
none none No very low
none none Yes low
none some No low
none some Yes low
none many No low
some none No low
none many Yes medium
some none Yes medium
some some No medium
some some Yes medium
some many No medium
many none No medium
some many Yes high
many none Yes high
many some No high
many some Yes high
many many No high
many many Yes very high
lated to the following scales: general health, bodily
pain, physical functioning play their role into the def-
inition of the “Physical well-being” intermediate fac-
tor. This intermediate variable therefore contains the
subjective evaluation of individual general health con-
ditions, given by the interviewee, his perception of
physical limitation due to pain at work and during
usual social activities with family. The other interme-
diate variable taken into account is the “Dimension of
Psychological and Relational Health”, whose purpose
is to evaluate individual health from a psychological-
well being point of view. The dimension of Psycho-
logical and Relational Health is deliberately made up
of many variables relying on the scales that are the
main components of PCS in the SF-12 analysis: vi-
tality, social functioning, emotional role and mental
health. The aggregating process described, through
the use of rule blocks, is iterated from the left to the
right of the system tree. At the end of the process, to
make the results intelligible to human beings it is nec-
essary to de-fuzzify the results. This is done by using
the Center of Maximum method described above.
5 THE INDIVIDUAL HEALTH
STATUS IN ITALY AND THE
ROLE OF OBSERVABLE
CONVERSION FACTORS
In this paragraph we will analyze the results of the
FIS applied to health, trying to place some personal
MEASURING THE CAPABILITY OF LIVING A HEALTHY LIFE WITH FUZZY LOGIC IN A GENDER
PERSPECTIVE
395
or social factors in relationship with the development
of the capability of living a healthy life. The degree
of development will be approximated using the final
output of the FIS presented in the previous paragraph.
The sample for this analysis, as already stated, comes
from the Italian National Institute of Statistics survey
on health for 2004-2005. In particular, the object of
our investigation is the subset of people over 14 who
did not present any missing values on the variables
chosen to run the FIS. In fact, one of the main prereq-
uisites of an FIS is that the data matrix has to be dense.
Since our dataset contains a relatively high number of
observations, this prerequisite can be easily satisfied:
the final sample is made up of 111,151 individuals,
weighted to be significant both at a national and at a
regional level. In Table 3 we compare the results on
the measurement of the two Phsycological Health in-
dicators: the fuzzy DPRH and the SF-12 MCS, while
in Table 4 we compare the results obtained for the two
Physical Health indicators the fuzzy PWB and the SF-
12 PCS. Table 5 contains the results of the Fuzzy final
output value on Health by gender and age.
Table 3: A comparison between the two Psychological
Health indicators: DPRH and MCS.
Age Classes
DPRH MCS
Men Women Men Women
15-24 88.64 84.34 53.70 51.36
25-34 85.56 81.05 52.58 50.52
35-44 82.14 78.34 51.59 49.88
45-54 78.50 72.89 50.81 48.60
55-64 74.21 67.73 50.43 48.03
65-74 68.20 59.99 49.67 46.43
75+ 56.21 47.84 47.16 44.09
Standardizing both the outputs of the evaluation
system on a 0-100 range, we discovered that the fuzzy
indexes are generally higher than MCS and PCS with
respect to all the age classes, for both genders, but it
is also pretty clear that the variability of the fuzzy in-
dexes is much higher; hence the fuzzy outcomes are
more sensitive to the changes caused by age. Further-
more, even though the results are generally higher, the
trends are the same: women’s health is worse than
men’s at every age, with a strong and constant de-
crease over time.
This result is also confirmed by the trend in the
main index (Health Status), which is higher, on av-
erage, among the youngest individuals, a little better
for men than for women, decreasing with age. All the
indexes obtained and analyzed present a similar trend.
If we consider people’s health status and we com-
pare it now with their employment status, we see that
the results are fairly consistent with what we might
Table 4: A comparison between the two Physical Health
indicators: PWB and PCS.
Age Classes
PWB PCS
Men Women Men Women
15-24 92.35 90.60 55.28 55.31
25-34 90.45 87.71 54.52 53.95
35-44 88.19 85.98 53.59 53.12
45-54 85.49 80.93 52.43 51.13
55-64 80.99 74.22 50.38 48.27
65-74 72.97 63.55 46.96 44.10
75+ 55.46 44.23 40.39 36.87
Table 5: The average Health Status index by gender and age
class.
Age Classes Men Women
15-24 87.19 85.13
25-34 88.46 85.87
35-44 85.91 84.02
45-54 83.20 80.02
55-64 79.83 75.79
65-74 74.87 69.48
75+ 65.50 59.61
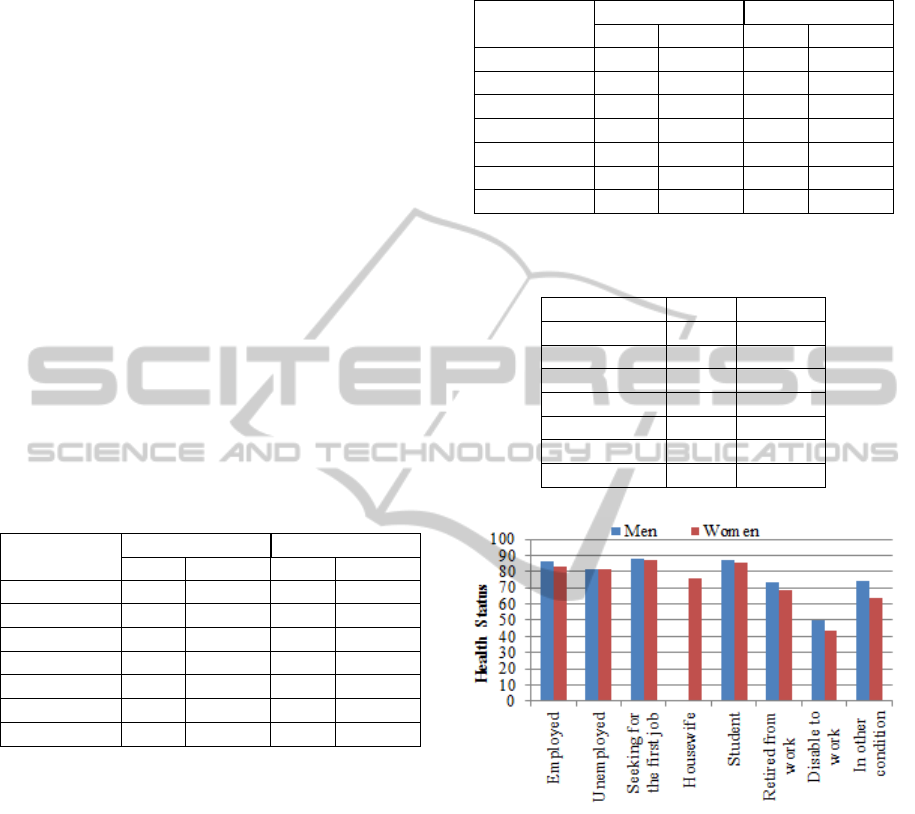
Figure 4: The average Health Status by gender and employ-
ment status.
expect: students and people seeking their first job are
expected to be younger and they actually receive the
highest marks. On the other hand, we find people who
are retired from work whose health status is worse
given their average higher age.
But if we consider employed and unemployed
people (Figure 4) we see that these two groups, which
apparently should not differ so much as regards their
average age, present quite different marks: 85.95 for
the employed males against 81.62 for the unemployed
and 83.48 for the employed women, compared to
81.48 of the unemployed women. This is in line with
the health costs linked to unemployment status as out-
lined in Sen (1997). Turning to education (Figure 5),
FCTA 2011 - International Conference on Fuzzy Computation Theory and Applications
396
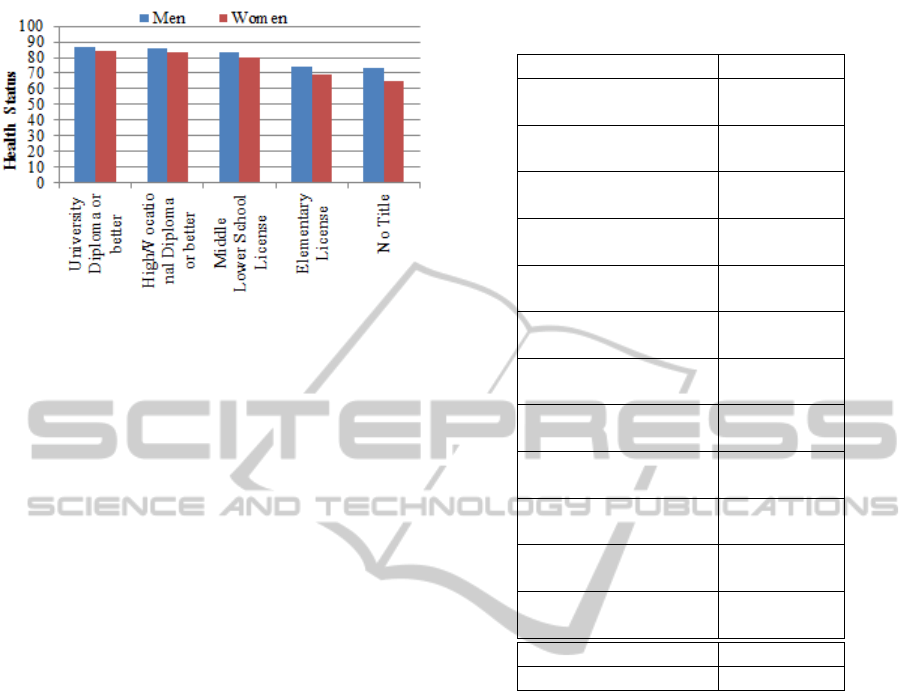
Figure 5: The average Health Status by gender and educa-
tional level.
the data confirm what the literature claims as com-
mon ground: a higher educational level is positively
related to individual health. We then completed our
analysis by estimating a multivariate OLS regression
model that allows us to take into account the weight
of the different conversion factors on the index of liv-
ing a healthy life resulting from the implementation
of our FIS model (Table 6) to the data.The results ob-
tained confirm a negative effect of ageing on the fuzzy
measure of health and, having controlled for age, one
can see that women are still characterized by worse
health than men. Health improves when the education
level is higher. Turning to employment conditions, we
may see that controlling for age and education lev-
els, if one holds a temporary work position, his/her
health status deteriorates (the control variable being
employed on a permanent basis). Joblessness is also
consistent with Sen’s analysis (1997) leading to lower
health. Those living in the South of Italy show a lower
level of health achievement, and this is probably con-
nected to worse health infrastructures in the South of
Italy. Deeper analyses on regional variability will be
performed in further research by matching our popu-
lation data with health infrastructures administrative
data.
6 CONCLUSIONS
In the analysis of individual well-being, health status
is a central dimension. In this paper we have analyzed
the individual health status by considering its multidi-
mensional nature. In order not to lose its complexity
we have proposed a modular approach (the fuzzy tree
diagram) which allows us to obtain an index on health
without losing single macro-index information. The
choice, interaction and the effects of the various avail-
able indicators were chosen by the authors on the ba-
Table 6: Health Status: a multivariate analyses (standard
errors in parenthesis).
Variables Health
Age
-0.184***
(0.00186)
Woman
-0.0401***
(0.00142)
Married/Cohabiting
0.0516***
(0.00143)
Diploma
0.0487***
(0.00151)
Degree and more
0.0712***
(0.00237)
Temporary
-0.00978***
(0.00330)
Retired
-0.0772***
(0.00212)
Disable to work
-0.539***
(0.00551)
Other empl. condition
-0.0563***
(0.00178)
Unemployed
-0.0282***
(0.00302)
South
-0.0125***
(0.00139)
Constant
5.060***
(0.00671)
Observations 111.151
R-squared 0.187
sis of health experts’ opinions, expressed through lin-
guistic rules. This methodology reduces the debated
problem of the numerical attribution of weights. The
health status (the final output of our fuzzy inference
system) is determined by the interaction in the FIS
of access to health services, the dimension of mental
health and that of physical health. The first innova-
tive product is thus precisely the use of a fuzzy in-
ference system on the health status since it shows the
individual settlement through the combination of the
observable variables in the survey on the health status
of the Italian population. We then analyzed the crisp
value produced in relation to individual and family
variables which may interact with the very fundation
of a healthy condition. During the construction of the
intermediate variables and of the whole system, the
method that we applied maintains the complexity of
the definition of health status, while at the same time,
is able to produce a synthetic and numeric index. On
average, the health status index of the Italian popu-
lation is found to be lower for women than for men
and for people holding unstable working positions,
without work or living in the South. Further devel-
opments are at two different levels. The first, follow-
MEASURING THE CAPABILITY OF LIVING A HEALTHY LIFE WITH FUZZY LOGIC IN A GENDER
PERSPECTIVE
397

ing Addabbo et alt.(2010a) will be in a local direction,
the analysis will be replicated to a more homogeneous
area (the province of Modena). At national level we
aim to match the survey data on the population with
regional administrative data on the health infrastruc-
tures to allow for a deeper analysis of the impact of
health services on individual health outcomes.The re-
sults of our research on the construction of a new in-
dex of the capability of living a healthy life can then
be transferred - by a researcher from our research unit
- to the Italian Commission on the Definition of the
Quality of Life created in April 2011 by the Italian
National Institute of Statistics (ISTAT) and the Na-
tional Centre of Economics and Labour (Cnel) both
because health is a relevant dimension in the construc-
tion of the quality of life, and because of the innova-
tive methodology used for its measurement.
REFERENCES
Addabbo, T., Chiarolanza, A., Fuscaldo, M., and Pirotti, T.
(2010a). Una valutazione estesa del benessere sec-
ondo lapproccio delle capacit
`
a: vivere una vita sana,
chapter 7. In Baldini, M., Bosi, P., and Silvestri, P., ed-
itors, Le citt
`
a incartate, Mutamenti nel modello emil-
iano alle soglie della crisi, Bologna. Il Mulino.
Addabbo, T. and Di Tommaso, M. L. (2008). Children’s ca-
pabilities and family characteristics in Italy. Materiali
di discussione del Dipartimento di Economia Politica,
(590).
Addabbo, T., Di Tommaso, M. L., and Facchinetti, G.
(2004). To what extent fuzzy set theory and structural
equation modelling can measure functionings? An ap-
plication to child well-being. Materiali di Discussione
del Dipartimento di Economia Politica, (468).
Addabbo, T., Facchinetti, G., Maccagnan, A., Mastroleo,
G., and Pirotti, T. (2010b). A fuzzy system to evaluate
how parents interact with their children. In Metody
Informatyki Stosowanej, volume 3/2010.
Addabbo, T., Facchinetti, G., and Mastroleo, G. (2006). Ca-
pability and functionings. a fuzzy way to measure in-
teraction between father and child. In Saeed Khalid,
Pejas, Jerzy, and Mosdorf Romuald, editors, Biomet-
rics, Computer Security Systems and Artificial Intelli-
gence Applications, pages 185–195. Springer Science.
Addabbo, T. and Favaro, D. (2011). Part-time and tempo-
rary employment in a gender perspective, chapter 3.
In Addabbo, T. and Solinas, G., editors, Non standard
employment and quality of work. The case of Italy.
Springer Verlag, forthcoming.
Apolone, G., Mosconi, P., and Ware, J. E. (2005). Ques-
tionario sullo stato di salute SF12. versione italiana.
Milano. Istituto di Ricerche Farmacologiche Mario
Negri.
Cheli, B. and Lemmi, A. (1995). A “totally” fuzzy and
relative approach to the multidimensional analysis of
poverty. Economic Notes, pages 115–134.
Chiappero Martinetti, E. (2000). A multidimensional as-
sessment of well-being based on Sens functioning ap-
proach. Rivista Internazionale di Scienze Sociali,
2:207–239.
Cole, T. J., Bellizzi, M. C., Flegal, K. M., and Dietz, W. H.
(2000). Establishing a standard definition for child
overweight and obesity worldwide: international sur-
vey. British Medicine Journal, 320(7244):1240–1243.
Di Martino, M. (2008). Le condizioni di salute della popo-
lazione: Un’analisi multilivello delle disuguaglianze
sociali. In XXIX Conferenza Italiana di Scienze Re-
gionali, Bari.
Fleurbaey, M. (2009). Beyond gdp: the quest for a mea-
sure of social welfare. Journal of Economic Litera-
ture, 47(4):1029–1075.
Gandek, B., Ware Jr, J. E., Aaronson, N. K., Apolone, G.,
Bjorner, J. B., Brazier, J. E., Bullinger, M., Kaasa, S.,
Leplege, A., Prieto, L., et al. (1998). Cross-validation
of item selection and scoring for the sf-12 health sur-
vey in nine countries:: Results from the iqola project.
Journal of Clinical Epidemiology, 51(11):1171–1178.
Kuklys, W. (2003). Measurement and determinants of wel-
fare achievement-evidence. In 3rd Conference on the
Capability Approach, Pavia.
Mackenbach, J. P., Bakker, M. J., et al. (2003). Tackling so-
cioeconomic inequalities in health: analysis of Euro-
pean experiences. The Lancet, 362(9393):1409–1414.
Pirotti, T. (2006). Le dimensioni del benessere: la salute.
misure sfocate nellapproccio delle capacit
`
a. Master’s
thesis, Universit
`
a di Modena e Reggio Emilia.
Sen, A. K. (1993). Capability and well-being. In Nuss-
baum, M. and Sen, A. K., editors, The Quality of Life,
Oxford. Clarendon Press.
Sen, A. K. (1997). Inequality, unemployment and contem-
porary europe. Int’l Lab. Rev., 136:155.
Stiglitz, J. E., Sen, A. K., Fitoussi, J. P., et al. (2009). Re-
port by the commission on the measurement of eco-
nomic performance and social progress. Commission
on the Measurement of Economic Performance and
Social Progress, Paris.
United Nations Development Programmes (1990). Human
development report 1990: Concept and measurement
of human development. In UNDP, New York Oxford.
Oxford University Press.
Wagstaff, A., Paci, P., and Van Doorslaer, E. (1991). On the
measurement of inequalities in health. Social Science
& Medicine, 33(5):545–557.
Ware Jr, J. E., Kosinski, M., and Keller, S. D. (1996). A 12-
item short-form health survey: construction of scales
and preliminary tests of reliability and validity. Medi-
cal care, 34(3):220.
Ware Jr, J. E., Kosinski, M., Keller, S. D., and Institute, N.
E. M. C. H. (1998). Sf-12: How to score the sf-12
physical and mental health summary scales.
Ware Jr, J. E., Snow, K. K., Kosinski, M., and Gandek, B.
(1993). SF-36 health survey: manual and interpreta-
tion guide. The Health Institute, New England Medi-
cal Center.
FCTA 2011 - International Conference on Fuzzy Computation Theory and Applications
398
