
OPTIMIZING TOPOLOGY OF THE POWER DISTRIBUTION
NETWORK USING GENETIC ALGORITHM
Martin Paar
1
, Lukas Oliva
2
and Jana Jilkova
3
1
Center for Research and Utilization of Renewable Energy Sources, Brno University of Technology
Technicka 3058/10, Brno, Czech Republic
2
Department of Radio Electronic, Brno University of Technology, Purkyňova 118, Brno, Czech Republic
3
Department of Radar Technology, University of Defence, Kounicova 65, Brno, Czech Republic
Keywords: Distribution network reliability, Genetic algorithm, Power losses, Reconfiguration, Multi-criterion
optimization.
Abstract: The article deals with application of genetic algorithm to the minimization of the operational cost of
distribution network. The optimization is achieved by the change of the network topology or reconfiguration
in terms of power network terminology. The optimization algorithm changes the setup of the switchgears to
get such a configuration which leads to the minimum costs for power loss and minimum financial
penalization for not delivering the electric power and therefore violating standards of the power supply
continuity. The Finnish continuity standard at systems level and Portuguese continuity standard at single-
customer level were selected for evaluation of the impact of power supply discontinuity and their impact is
compared and discussed. The Genetic algorithm is designed as multi-attribute optimization with mono-
objective evaluation using binary coding. Also since the optimization involves reconfiguration of the
topology a simple solution to cope with invalid solution is described and discussed.
1 INTRODUCTION
During past decade, new challenges caused by the
liberation process in electrical energy market of the
European Union were introduced. While the
liberation does not carry only new opportunities for
the business but also new requirements given by
state regulator, a way to minimize the risks of the
penalization for the violation of the regulations was
necessary to be found. The method of estimating
these risks is well known and widely used and is
based on the probabilistic model of the outages in
the power network. Because the distribution
companies are naturally monopolistic, the market in
this area needs to be regulated by state. The task of
the state regulator is to keep the requirements of
customers, distribution company stockholders and
power systems itself balanced. To cover the needs of
customers and power systems the power quality
standards were defined. One part of power quality
standards is based on the monitoring of electrical
energy supply continuity followed by costs
evaluation of continuity violation. It enables the
evaluation of network reliability and provides some
clues about network's condition. It is also one of the
tools to secure the investment to network by its
owners. The electrical energy supply continuity is
directly related to reliability of distribution network.
The reliability improvement requires usually high
investment to the networks’ parts e.g. changing
overhead lines by cables and so on. Therefore the
distribution companies seek for cheaper solutions.
The one of almost cost-free solution is a
reconfiguration – changing the topology.
2 CURRENT DEVELOPEMENT
Using the reconfiguration of the power network to
optimize the power network parameters started in
middle 80’s (Sarfi, 1996) but the main development
took place in 90’s of 20th century. The optimizations
were mainly concern to decrease of power losses
(Sarfi, 1996) or to balance power distribution
(Baran, 1989) and heuristic method: Greedy search
(Baran, 1989) or artificial intelligence: Genetic
algorithms (Vitorino, 2009) or Swarm intelligence
(Hosseini, 2008) were used. The power network
239
Paar M., Oliva L. and Jilkova J..
OPTIMIZING TOPOLOGY OF THE POWER DISTRIBUTION NETWORK USING GENETIC ALGORITHM.
DOI: 10.5220/0003675602390244
In Proceedings of the International Conference on Evolutionary Computation Theory and Applications (ECTA-2011), pages 239-244
ISBN: 978-989-8425-83-6
Copyright
c
2011 SCITEPRESS (Science and Technology Publications, Lda.)
reliability in connection with reconfiguration has
been studied since 2003 (Brown, 2003). The main
development in this field started in the beginning of
the 21st century when liberalization of electric
energy market was introduced in European Union
(Hosseini, 2008), (Vitorino, 2009).
3 APPLICABLE NETWORKS
The electrical power networks are divided to
transmission networks and distribution networks.
The transmission networks create the central part of
the system and are used for the transfer of the energy
from the power plants or international connection
points to the main points of consumption like big
cities or important industry centres. These networks
work on the voltage level up to 200 kV and usually
operate as meshed networks. Between the
transmission networks and end users, there are the
distribution networks operating on variety of voltage
levels from 110 kV (High voltage - HV) over 35 kV
(middle voltage - MV) for industry to 400 V for low
voltage (LV) customers. Each voltage level has its
own properties and operated topology and it can be
diverse in different countries and areas depended on
historical and technical conditions. The article is
based on the situation in the Czech Republic.
The transmission networks generally operate as a
meshed network where reliability calculation is
actually very complicated and where the
reconfiguration operations are executed with
different focus – primarily to the stability of the
system. The networks on HV (110 kV) level in the
Czech Republic do not contain sufficient number of
reconfiguration points for proper optimization, on
other hand the available data from the power
networks on LV (0.4 kV) level do not currently
provide enough information for practical evaluation.
Power networks, fulfilling both requirements for
optimization (enough data and possibility of
effective reconfiguration), operate on MV (35kV
and 22 kV) level. MV networks in Czech Republic
are designed as meshed networks and they are
operated as radial networks to enable simple
dispatching control.
4 POWER NETWORK
OPTIMIZATION
The optimization is based on four components–
network topology reconfiguration, evaluation of the
continuity standard, power losses calculation and
quite basic version of genetic algorithm. The
network reconfiguration is necessarily built-in the
GA implementation.
4.1 Reconfiguration and Coding
Reconfiguration is a process of changing the
topology of the power network using circuit breakers
or section switches without disconnection of any
end-point customer. The set of switches state
(on/off) defines one solution (or a single individuum
in terms of GA). Therefore the algorithm uses
naturally binary coding system. Apart from 1
(switched on) and 0 (switched off) the third status
(-1) is used for the situations when the status of the
switch is unknown during the optimization. The -1
marker has to be used to distinguish a state when the
change of the switch position may break any of set
condition. This marker arises during the GA
operators processing and practically means that the
individual should be corrected so that it represents a
viable solution (given only by a set of 0 or 1).
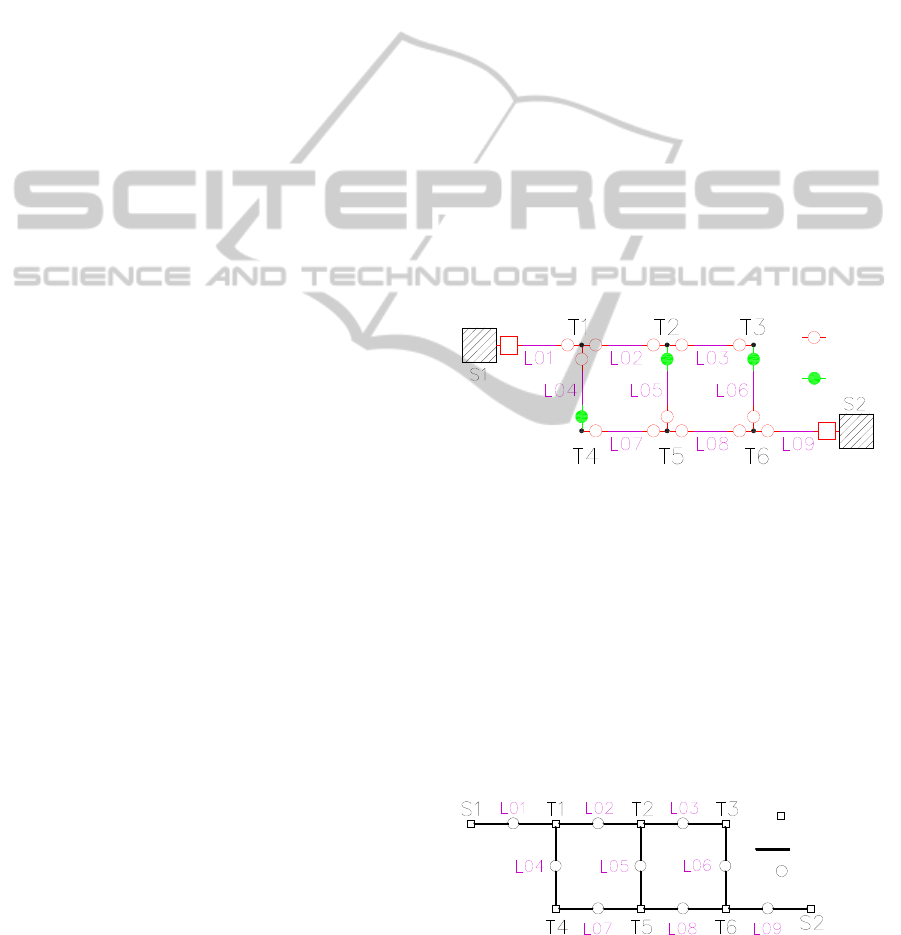
Figure 1: Model of the network.
The switch position in the chromosome (locus) is
mapped to a single switch position in the network.
The mapping is constant during the whole
simulation. During the optimization, each valid
individuum represents a valid set of switches state
fulfilling the conditions of 1) all the customers being
connected and 2) providing no loops (radiality
condition). The way to achieve the reconfiguration
from one set of switches to another is not taken into
account during optimization and is considered to be
practically possible.
Figure 2: Representation of the model network.
07
02
01
03 04 05 06
1713 14 15 16
08 09
10 11 12
18
switch
close
switch
open
switch
line
Substation or
transformation
station
01 02 03 04 05 06
07
08
09
13
10
14 15 16 17 18
11 12
ECTA 2011 - International Conference on Evolutionary Computation Theory and Applications
240
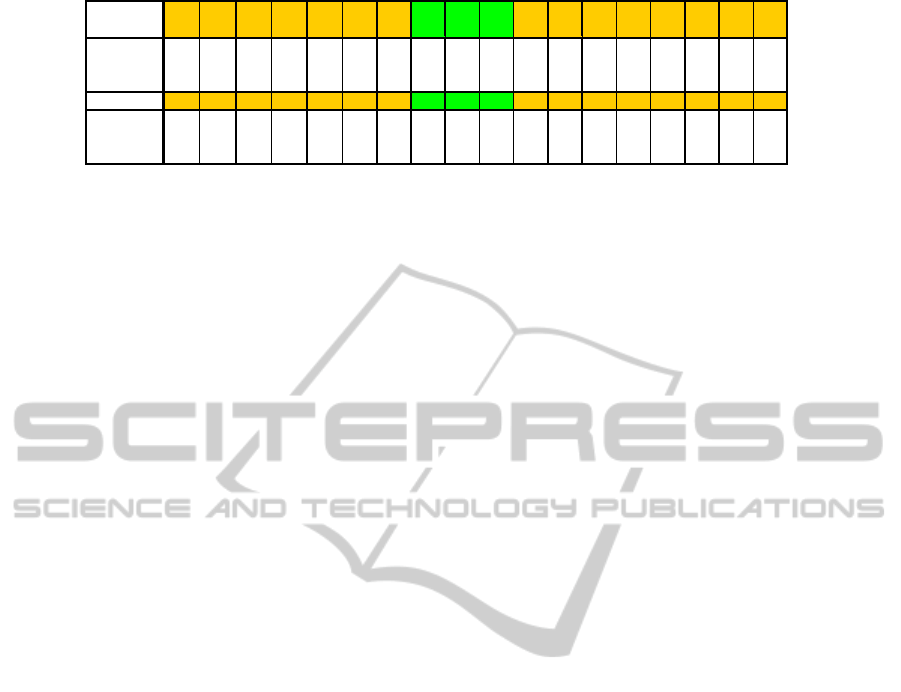
Figure 3: Representation of Figure 2.
During the whole optimization process two
representations of coded solution - one for genetic
algorithm usage and another for the criteria function
evaluation process is used. The representation used
for GA is describes a non-oriented graph where
vertices stand for the elements of network i.e.
substations, transformation stations, overhead lines,
cables etc, and switches represented by the graph
edges. Example of the network topology is shown on
Figure 1, its representation for GA purposes is on
Figure 2, encoded equivalent of Figure 2 is shown
on Figure 3 on the row "switch set". The GA
representation is used to split the network to radial
subnetworks by the modified Depth-first search
(DFS) algorithm described in (Paar, 2008). Logical
division of the network to subnetworks is essential
for the evaluation process and also it is one of the
conditions of the practical network operation.
4.2 Evaluation of the Solution
The evaluation is composed of the 1) cost of power
losses calculation and 2) a penalization calculation
for given continuity standard (Finnish continuity
standard at system level or Portuguese continuity
standard at single-customer level is used). Before
evaluation an individuum is transcoded into the
second representation using the Breadth-first-search
algorithm (BFS). Contrary to DFS, BFS transforms
the subnetwork to a structure without switches
where vertices are represent substations or
transformation stations and edges represent overhead
line and cables. This structure allows to the steady
state calculation and also determines the placement
of so called protection zones in all the radial
subnetworks. Protection zone are the areas affected
by interruption of power supply on particular cable
leading to the consequent continuity standard
violation and penalization.
4.2.1 Power Losses Costs Calculation
The first evaluated criterion is focused on power
losses cost. Power losses are calculated by using
steady state calculation with power consumptions
specified by electric currents and are independent
from the voltage applied to their terminal point.
These simplifications cause calculation to suffer
from lower accuracy comparing to the power-flow
calculation methods, such as the Newton-Raphson or
Gauss-Seidel method. The main benefit is faster
calculation and with satisfactory resolution of results
(convergence of aforementioned iteration methods
cannot be guaranteed). Costs of power losses (in
€/year) are given by:
n
p
= c
l
P
l
T
l
(1)
where c
l
is a specific unit on a middle voltage level,
P
l
is power losses of whole network and T
l
is
utilization time of power losses.
4.2.2 Valuation of Penalization Standards
The second criterion is made of the total number and
the total duration of power supply interruptions
evaluated by specified continuity standard. Number
and duration of the outage is provided by the
reliability model using Monte Carlo method. The
reliability model is based on direct generation of
random failures given by probability distribution
based on statistic numbers of annual supply
interruptions. The set of interruptions numbers is
generated with one year time step for selected
individual network components together with
corresponding interruptions duration. This technique
is described more in detail in (Dětřich, 2006). One of
the main advantages of this approach is that it
provides the results even for limited range of input
data of examined network.
Every generated outage is bounded to specific
networks elements. Each element fall within a
specified protection zone whose size and topology is
given with by the network topology and is defined as
a protected part of the network by single protection
element located directly in feeders or in important
switch stations. The outage in any single element
affects the whole protection zone where element is
located and all protection zones fed by the affected
protection zone. Number of affected zones and
network elements gives the number of disconnected
switch
name
01 02 03 04 05 06 07 08 09 10 11 12 13 14 15 16 17 18
element
before
switch
S1 L01 T1 L02 T2 L03 T1 T2 T3 L04 L05 L06 T4 L07 T5 L06 T6 L09
switch set
1 1 1111100011111111
element
after
switch
L01 T1 L02 T2 L03 T3 L04 L05 L06 T4 T5 T6 L07 T5 L06 T6 L09 S2
OPTIMIZING TOPOLOGY OF THE POWER DISTRIBUTION NETWORK USING GENETIC ALGORITHM
241

customers and the total duration of interruptions, the
amount of non-delivered power to customers (in
kWh) and enables calculation of the financial
penalization for a given standard.
4.2.3 Finnish Continuity Standard at System
Level
The Finnish continuity standard is used by Finnish
Energy Market Authority and belongs to so called
system level continuity standards which regulate the
power quality without opportunity of direct payment
to customers. The penalization payment is a part of
complex metrics to set the network charges and also
to evaluate the efficiency of whole network. The
standard is described in (FEMA, 2007) (Paar, 2010).
4.2.4 Portuguese Continuity Standard at
Single-customer Level
Portuguese standard expresses the maximal number
of interruptions per year and maximum interruption
duration annually. The limits specified in the
standard are distinguished according to the voltage
levels (HV, MV and LV) and population density. As
Finland’s standard was focused on system level, the
computation is aimed to the Portuguese single-
customer standard and excluded Portuguese standard
at system level (Paar, 2010), (CEER, 2005).
4.3 Genetic Algorithm
The optimization of power network configuration
leads to combinatorial problem with huge solution
space where classical computation methods fail or
don’t bring useful results. Using the global
optimization method can enable solution of such
problems. The selected optimization method is quite
basic implementation of the Genetic algorithm. The
application uses GA with tournament selection,
single point crossover, random mutation and elitism.
Following chapters describe the main modifications
done to solve the described problem.
4.3.1 Initialization
The initial population of GA is created by a specific
function. The usage of binary coding of solution by
switch setup is does not by itself guarantee proper
network topology (like as feeding all parts of the
network or radial structure of subnetworks). For
small network, the quantity of non-allowed solution
may not be problematic but it grows with the
network size. Therefore the modified Depth-first
search algorithm (MDFS) that includes some
random features is used to guarantee viability of the
initial population.
4.3.2 Fitness Function
The fitness function is designed as a weighted sum
of two input parameters and a penalization function
given by following formula:
fitness = α n
p
+ β n
C
+ γ
(2)
where α and β are balance coefficients, n
p
is power
losses costs of whole network and n
C
is penalization
costs given by selected continuity standard. Function
γ is used to discriminate inappropriate solutions (out
of set limits) and is determined by this formula:
1max
1
2max
1
cond
cond
n
i
i
n
i
i
duu
dII
(3)
where d
1
and d
2
are weighting coefficients, Δu is a
voltage drop vector in the network, Δu
max
is maximal
permitted voltage drop, I
i
represents vector of
currents flowing in the network and I
max
is maximal
current-carrying capacity, Г is specific penalization.
4.3.3 Crossover
The classical single point crossover operator does
not make sure that the new individual will represent
a valid solution so it had to be modified. After the
crossover, the comparison is made between
offspring with one of parents. The result of
comparison is parent solution with -1 numbers at all
genes where offspring chromosome differs. The
offspring is then corrected through a correction
algorithm to repair all the damaged genes. This way
ensures viability of the new generation while saving
the computational time too since is not necessary to
investigate all parts of the network but only the
“damaged” one.
5 SIMULATION AND RESULTS
The results of the optimization show how the
selected continuity standards affect the output
parameters SAIFI (System Average Interruption
Frequency Index that express average number of
interruptions that affected customer per year; A
similar parameter - SAIDI is focused on the average
interruption duration) and power losses on the model
of real middle voltage (22 kV) cable network.
The network covers area between two
substations (110/22 kV) which together feed over 44
ECTA 2011 - International Conference on Evolutionary Computation Theory and Applications
242
800 customers by 288 power transformation stations.
The power network contains more than 300 cables
and 628 section switches or circuit breakers.
The GA setup was following:
600 generations
16 individuals in one population (1 elite)
crossover probability 0,95
mutation probability 0,1
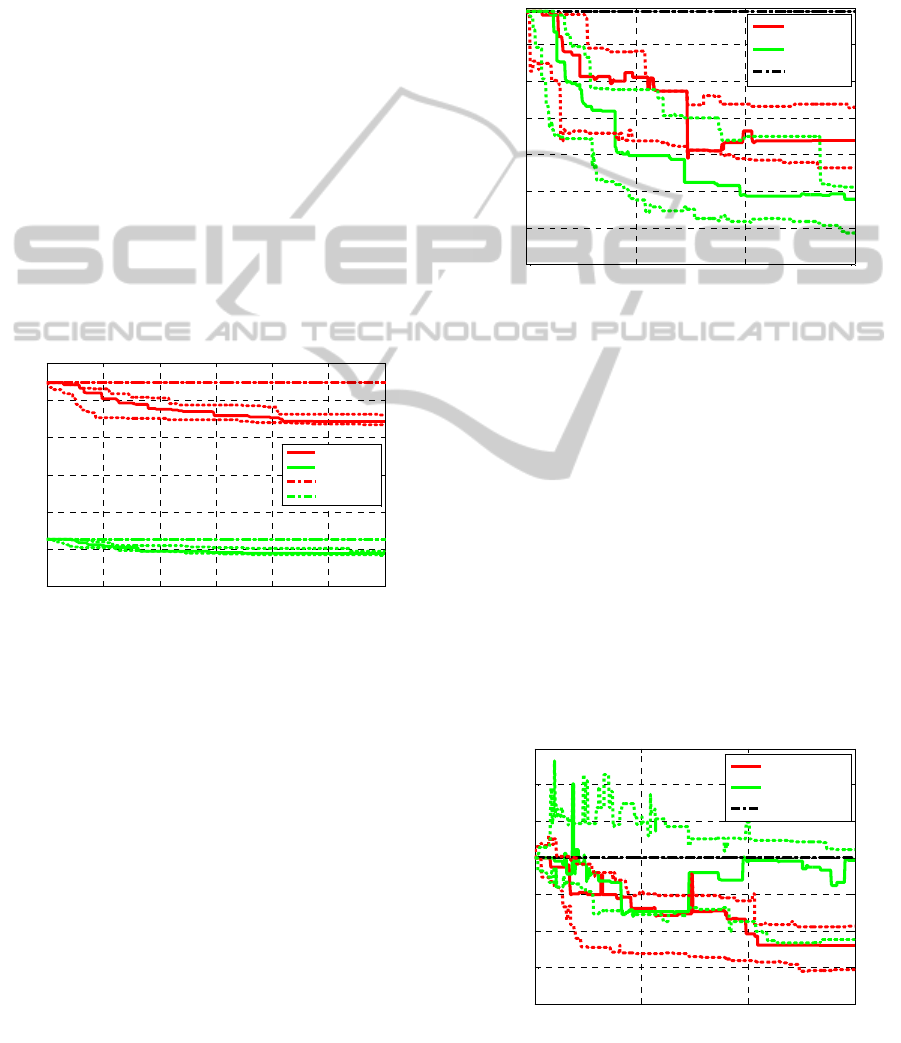
5.1 Results
The stochastic nature of genetic algorithm requires
more optimization runs to be done. To show
valuable results, each of the result graphs (Figure 4-
6) contains, selected simulation run with duration
close to the arithmetic average of all tested solutions
(fitness function) and the maximum and minimum
(both dotted line) of the fitness function for all the
individuals for solution on current situation
(original solution without any optimization, dot-and-
dashed).
Figure 4: Duration of fitness function for Finnish and
Portuguese continuity standards.
The overall penalization between the Portuguese
and Finnish continuity standards is not directly
comparable because of the differences in both
approaches (system versus customer oriented). Each
continuity standard serves for the different purposes;
the Finnish standard is part of the complex
metrology hence given total values of penalization
do not affect the distribution companies directly. In
simulations the Portuguese standard does not reach
as high values as the Finnish but it must be noted
that the direct impact to distribution company money
is present since the penalization may make important
portion of the network operational costs (Figure 4
shows the differences between fitness functions that
shows the approximate difference in the operation
costs of the network between the original and the
optimized topology. The optimized version shows
the decreased amount of money spent for
penalizations approximately by a factor of 5.
To illustrate the difference in the reliability,
SAIFI and power losses are showed on Figure 6. As
it can be seen, the SAIFI parameter for the case of
Finnish standard was decreased by 10%.
Figure 5: Evolution of power losses during generations for
Finnish and Portuguese continuity standards.
Even more interesting is the impact to the power
losses (see Table 1). The total power losses were
decreased by 20% for optimization to the Finnish
standard or even by 30% for the Portuguese on.
Figure 5 depicts higher decrease of the power losses
for simulations with the Portuguese standards. As
can be seen on Figure 6, parameter SAIDI during
optimization is improved but second part of
optimization returns back close to original value.
The Finnish standard is less affected by power losses
costs in criterion function though the decreasing of
power losses in this optimization is shown as well,
the improvement of SAIFI and SAIDI parameters
indispensible compare to Portuguese continuity
standard.
Figure 6: SAIFI duration during generations.
0 100 200 300 400 500 600
0
0.5
1
1.5
2
2.5
3
x 10
5
Generation
Fitness function [Euro/year]
Fit. FI
Fit. PT
Orig. Fit. FI
Orig. Fit. PT
0 200 400 600
200
220
240
260
280
300
320
340
Generation
p [kW/year]
p FI
p PT
Orig.
p
0 200 400 600
0.4
0.42
0.44
0.46
0.48
0.5
0.52
0.54
Generation
SAIFI [year
-1
]
SAIFI FI
SAIFI PT
Orig. SAIFI
OPTIMIZING TOPOLOGY OF THE POWER DISTRIBUTION NETWORK USING GENETIC ALGORITHM
243

Table 1: Results for Finnish and Portuguese continuous standards.
standard
penalisation SAIFI SAIDI P
final orig. final orig. final orig. final
10
3
Euro year
-1
year
-1
% min/year min/year % kW kW %
FI 220 0,48 0,43 9,9 32,6 29,3 10,4 338 267 21
PT 43,5 0,48 0,48 0,2 32,6 32,5 0,4 338 235 30
6 CONCLUSIONS
The article describes application of the genetic
algorithms to the problem of the distribution
network reconfiguration with the multi-criterion
function with the aim to minimize the interruption of
energy supply penalisation and at the same time also
to minimize the power losses costs. Details of the
algorithm caused by the combinatorial nature of the
problem were described. The application was tested
on model of a real MV cable network for two
continuity standards.
The results show that power losses are
inconsiderable part of multi-criterion function
mainly when Portuguese continuity standard is used.
The results imply that significant savings could be
reached for very negligible expenses in the
distribution networks.
The future work will be focused to the
optimization with truly multi-objective nature.
ACKNOWLEDGEMENTS
This paper was written with the support from
MSM0021630516 project of the Ministry of
Education, Youth and Sports of The Czech
Republic.
Author gratefully acknowledge financial support
from European Regional Development Fund under
project No. CZ.1.05/2.1.00/01.0014.
REFERENCES
Baran, M. E., Wu, F. F., 1989. Network reconfiguration in
distribution systems for loss reduction and load
balancing. In IEEE Transactions on Power Delivery.
1989, vol. 4, is. 2, p. 1401-1406. ISSN: 0885-8977.
Brown, R. E., 2003. Network reconfiguration for
improving reliability in distribution systems. In IEEE
Power Engineering Society General Meeting, 2003,.
Toronto, Canada, 2003, vol. 4, s. 2419-2424. ISBN: 0-
7803-7989-6.
Council of European Energy Regulators (CEER), 2005.
3rd Bench-marking Report on Quality of Electricity
Supply. Brussels, Belgium, p. 122-127.
Dětřich, V., Skala, P., Matonoha, K., Špaček, Z., Göhler,
M., Blažek, V., 2006, Modeling of Supply
Interruptions in MV Cable Distribution Networks for a
More Accurate Estimation of the Cost of Penalty
Payments. In IEEE Transaction on Power System, vol.
21, issue 2, p. 0605-0610.
Finnish Energy Market Authority (FEMA), 2007. Sähkön
jakeluverk-kotoiminnan hinnoittelun kohtuullisuuden
arvioinnin suuntaviivat vuosille 2008-2011
[Guidelines for Assessing the Reasonableness of the
Pricing of Electricity Distribution Network Services in
2008-2011, in Finnish], Helsinki, Finland.
Hosseini, H., Jalilzadeh, S., Nabaei, V., Zareie Govar, G.
R., Mahdavi, M., 2008. Enhancing deregulated
distribution network reliability for minimizing penalty
cost based on reconfiguration using BPSO. In Power
and Energy Conference, 2008. IEEE 2nd
International. p. 983-987. ISBN 978-1-4244-24.
Paar, M., 2008. Searching of Radial Subnetwork in
Meshed Network by Modified Depth-First Search
Algorithm. In Proceeding of the 14th Conference
Student EEICT 2007. Volume 3. p. 197-201. ISBN:
978-80-214-3616-9.
Paar, M., Toman, P., 2010. Comparison Influence of
Continuity System and Single- Customers Standards
to Distribution Network Configuration. In
Proceedings of the Congreso Internacional de
Distribución Eléctrica. Buenos Aires, Argentina, p. 1-
7. ISBN: 978-987-97399-3- 8.
Sarfi, R. J., Salama, M. M. A., CHikhani, A. Y., 1996.
Distribution System Reconfiguration for Loss
Reduction: An Algorithm Based on Network
Partitioning Theory. In IEEE Transactions on Power
Systems, 1996, vol. 11, is. 1, p. 504-510. ISSN: 0885-
8950.
Vitorino, R. M. V., Jorge, H. M. M., Neves, L. M. P.,
2009. Network Reconfiguration Using a Genetic
Approach for Loss and Reliability Optimization in
Distribution Systems. In Power Engineering, Energy
and Electrical Drives, POWERENG ‚09. International
Conference on. Lisabon, Portugal. p. 84-89. ISBN
978-1-4244-46.
ECTA 2011 - International Conference on Evolutionary Computation Theory and Applications
244
