
PRELIMINARY RESULTS OF CLINICAL TESTS OF A NEW
NEURAL-NETWORK-BASED OTITIS MEDIA
ANALYSIS SYSTEM
M. Hannula
1
, T. Holma
2
, E. Löfgren
2
, H. Hinkula
1
and M. Sorri
2
1
Medical Engineering R&D Center, Oulu University of Applied Sciences, Kotkantie 1, 90250, Oulu, Finland
2
Department of Clinical Medicine/Otorhinolaryngology, University of Oulu, Oulu, Finland
Keywords: Acute otitis media, Middle ear, Artificial neural networks.
Abstract: Evaluation of middle ear effusion is essential in diagnostics of otitis media. In this study a new otitis media
diagnostic system based on acoustic reflectometry (AR) was preliminarily evaluated and tested with
experimental clinical data on 114 ears of 57 children. In the study the ears of the children were measured
with the new AR system and the corresponding ear status was definitively assessed in myringotomy by
measuring the amount of effusion in the middle ear. The collected data included successful measurements of
71 normal ears (no effusion in the middle ear) and 43 ears with 0.02-0.37 g of middle ear effusion. In the
analysis the correspondence between a neural network analysis of the AR measurement data and the
corresponding amount of middle ear effusion was analysed using a leave-one-out validation procedure. The
preliminary results were promising; the neural network analysis result and the amount of middle ear
effusion correlated statistically significantly (p < 0.001), with correlation coefficient R = 0.37. In future
studies more data will be collected to obtain higher correlation in the analysis.
1 INTRODUCTION
Otitis media is one of the most common reasons for
medical contacts in children. Many studies (Linden
et al., 2006; Chianese et al., 2007; Walsh et al.,
1998; Block et al. 1999) have evaluated acoustic
reflectometry (AR) -based (Teele and Teele, 1984)
diagnostics of otitis media with good results. The
idea of the new neural-network-based (Haykin,
1999) AR system (Hannula et al., 2009) was to build
an Internet-integrated AR measurement and analysis
system which includes neural-network-based
analysis, having the capability to incrementally
upgrade its performance due to an increasing amount
of data in its database. In this study this system was
preliminarily evaluated with a small amount of
clinical data.
In this study children were examined with the
new system and their ear status was determined in
the Department of Otorhinolaryngology of Oulu
University Hospital. The performance of the neural-
network-based AR measurement analysis was
assessed with a leave-one-out validation procedure
(Haykin, 1999), and the correlation between the
neural network result and the measured effusion
status was evaluated.
2 METHODS
Fig. 1 illustrates the measurement system. In the
measurement process, first the measurement tip is
connected to a PC’s sound card. Next the
measurement software is started from a web page.
Next the ears of the subject are measured. The
resulting measurement data are then sent to an
artificial neural network located on a web server,
which predicts the corresponding ear status from the
measurement data with the help of a simple index
value. The result is shown to the user on the web
page. In this study, after the AR measurement the
status of the ears was clinically determined in
myringotomy, where the amount of middle ear
effusion was measured.
365
Hannula M., Holma T., Löfgren E., Hinkula H. and Sorri M..
PRELIMINARY RESULTS OF CLINICAL TESTS OF A NEW NEURAL-NETWORK-BASED OTITIS MEDIA ANALYSIS SYSTEM.
DOI: 10.5220/0003679703650368
In Proceedings of the International Conference on Neural Computation Theory and Applications (NCTA-2011), pages 365-368
ISBN: 978-989-8425-84-3
Copyright
c
2011 SCITEPRESS (Science and Technology Publications, Lda.)
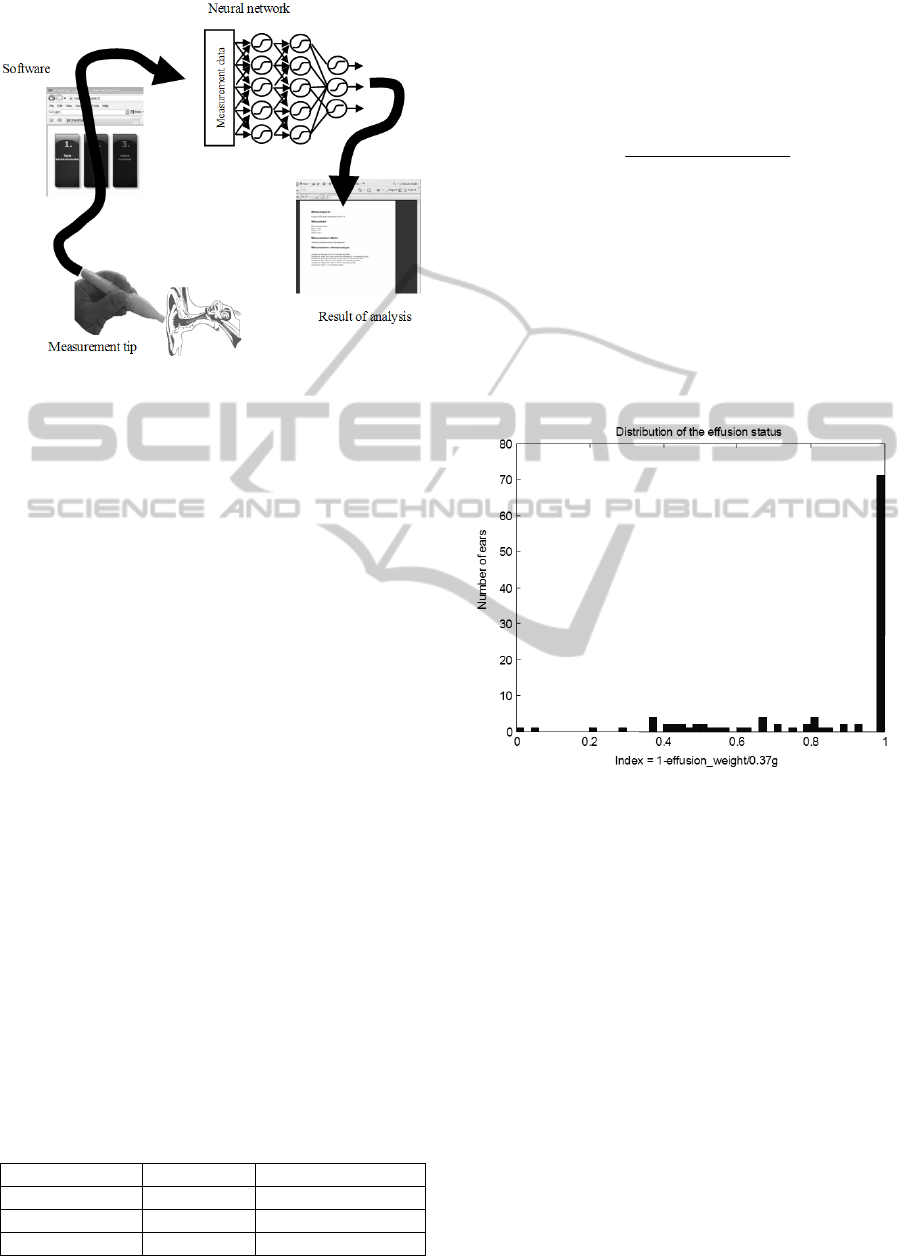
Figure 1: The measurement system.
The AR measurement was done following the
conventional measurement protocol (Linden et al.,
2006; Chianese et al., 2007; Walsh et al. 1998;
Block et al., 1999). The frequency band of the
stimulus signal in the measurement was 0.5-5 kHz.
In this study the data were analysed in the frequency
band of 1-3.5 kHz, which according to the AR
measurement principle (Teele and Teele, 1984),
should include the most essential information on the
otitis media -related status of the ear.
3 SUBJECTS AND DATA
The study was prepared following the standard
clinical research protocol, and the study was
approved by the Ethics Committee of the Northern
Ostrobothnia Hospital District. The data set of this
study originally included 133 ears of 73 children
(age 0.5-5 years, median weight 12.4 kg, min 7.8 kg,
max 44 kg) who were measured with the AR system
and clinically examined. Due to the preliminary
characteristics of the very first clinical
measurements, part of the data was unusable
because of a substantial amount of noise in the
measured signal or missing information on the
weight of the middle ear effusion. Therefore, the
total number of children evaluated successfully in
this study was 57, with 114 ears. The characteristics
of the data are shown in Table 1.
Table 1: Characteristics of the original data.
Ear status N (total) N (successful)
Normal 85 71
With effusion 48 43
Total 133 114
The minimum amount of effusion in the ear in ears
with effusion status was 0.02 g, and the maximum
amount was 0.37 g (median 0.18 g). To simplify
calculations, the amount of effusion was expressed
in this study by the equation:
g
weighteffusion
index
37.0
_
1−= (1)
where effusion_weight is the amount of effusion in
the ear; if the ear was healthy, the value was
determined to be zero. Therefore, a healthy ear
(effusion_weight = 0) was indicated with an index of
1 and an ear with maximum amount of effusion
occurring in the present dataset (effusion_weight =
0.37 g) was indicated with an index of 0. Fig. 2
shows the distribution of the ear statuses of the data
expressed with the index values.
Figure 2: Distribution of ear status indexes.
4 METHODS
In the analysis a generalized-regression-based neural
network (Haykin, 1999; Wasserman, 1993) was
trained to estimate the index value indicating the
amount of effusion in the ear on the basis of AR
measurement data, Fig. 3. The performance of the
neural network was evaluated with a leave-one-out
validation procedure (Haykin, 1999), where the
network was trained 114 times (total number of data
sets). During each training period one measurement
of the whole data set was excluded from the training
data set and used in the validation phase.
NCTA 2011 - International Conference on Neural Computation Theory and Applications
366

Figure 3: Neural network structure.
5 RESULTS
The neural network training and validation were
done with Matlab® software (Mathworks Inc,
Natick, USA). The correlation between the neural
network output and the amount of effusion as index
values in the ear is shown in Fig. 4.
Figure 4: Results of the neural network validation
(R=0.37, p < 0.001).
Fig. 4 shows that the neural network index and the
index of the measured amount of effusion correlate
statistically significantly (R = 0.37, p < 0.001).
6 DISCUSSION
AND CONCLUSIONS
The validation of the neural network analysis shows
that the correlation between the neural network
output and the measured amount of effusion in the
ear is clear, even though the correlation value is not
very high due to the preliminary characteristics of
the study. The result is in line with previous studies
(Linden et al., 2006; Chianese et al., 2007; Walsh et
al., 1998; Block et al., 1999; Teele and Teele, 1984)
and illustrates that the essential characteristic
features needed to estimate the amount of effusion in
the ear can be found from the AR measurement data.
In future studies the amount of data will be
increased in order to get higher correlations with
smaller deviations in single measurements. The idea
in this further development is to iteratively increase
the training data of the neural network of the
analysis system.
The data used in this investigation included a
number of unsuccessful measurements, 29 ears in
total. Technical problems which occurred during the
preliminary data collection were carefully
investigated and related improvements to the data
collection procedure were implemented in
subsequent measurements.
It should be kept in mind that in this study the
output of the network was an index with a linear
relationship to the amount of effusion only. Hence,
for example the pressure status of the ear was not
taken into account, which may account for part of
the deviations between the network output and the
determined ear status in the case of healthy ears with
no effusion at all. In order to improve the accuracy
of the measurements, further studies will more
extensively take into account the features of the ear,
related anthropometric characteristics and the middle
ear pressure. Also, the simplified linear index-based
approach used in this study may decrease the
correlation value between the neural network output
and the measured amount of effusion; application of
an appropriate nonlinear index would be better.
To conclude, the preliminary results of this
study were encouraging. The applied neural network
method has the capability to estimate the amount of
effusion in the ear at a statistical level, as shown
with the data set presented in this study. After
collection of the data set published in this study, the
number of data sets was increased essentially in the
next phase of the research project. In this phase an
improved measurement procedure was applied,
which substantially increased the repeatability and
noise tolerance of the measurements. The results of
those measurements will be published soon,
including evaluations about sensitivity and speficity
of the system in diagnostic application. Further, an
especially interesting application of the presented
measurement system is the possibility to use it at
PRELIMINARY RESULTS OF CLINICAL TESTS OF A NEW NEURAL-NETWORK-BASED OTITIS MEDIA
ANALYSIS SYSTEM
367

home as a tool to improve otitis media treatment
processes in health care.
REFERENCES
Linden H., Teppo H. & Revonta M., 2006. Spectral
gradient acoustic reflectometry in the diagnosis of
middle-ear effusion in children. Eur. Arch
Otorhinolaryngol 264:477-481.
Chianese J., Hoberman A., Paradise J. L., Colborn D. K.,
Kearney D., Rockette H. E. & Kurs-Lasky M., 2007.
Spectral gradient acoustic reflectometry compared
with tympanometry in diagnosing middle ear effusion
in children aged 6 to 24 months. Arch Pediatr Adolesc
Med 161(9): 884-888.
Walsh F. P., Cox L. C. & MacDonald C. B., 1998.
Historic perspective of the acoustic otoscope. J Am
Acad Audiol 9: 35-40.
Block S. L., Pichichero M. E., McLinn S., Aronovitz G.,
& Kimball S., 1999. Spectral Gradient Acoustic
Reflectometry: Detection of Middle Ear Effusion in
Suppurative Acute Otitis Media. The Pediatric
Infectious Journal 18(8): 741-744.
Teele D.W. & Teele J., 1984. Detection of middle-ear
effusion by acoustic reflectometry. J Pediatrics 104:
832-838.
Haykin S., 1999. Neural networks, a comprehensive
foundation. Prentice Hall, Upper Saddle River.
Hannula M., Hinkula H., Holma T., Löfgren E. & Sorri
M., 2009. Artificial Neural Network Analysis in
Evaluation of Ear Canal and Tympanic Membrane
Properties from Acoustic Reflectometry Data.
Proceedings of 11th World Congress on Medical
Physics and Biomedical Engineering.
Wasserman P. D., 1993. Advanced Methods in Neural
Computing, New York: Van Nostrand Reinhold, pp.
155-161.
NCTA 2011 - International Conference on Neural Computation Theory and Applications
368
