
A COMPREHENSIVE EVALUATION MODEL AND
INTELLIGENT PREDICTION METHOD OF WATER BLOOM
Zaiwen Liu, Xiaoyi Wang and Wei Wei
College of Computer and Information Engineering, Beijing Technology and Business University
No.33 Fucheng Road, 100048, Beijing, China
Keywords: Modelling, Integrated nutritional index, Evaluation method,Rough set, Water Bloom Prediction, Least
Squares Support Vector Machine.
Abstract: An integrated evaluative function and intelligent prediction model for water bloom in lakes based on least
squares support vector machine ( LSSVM) is proposed in this paper, in which main influence factor of
outbreak of water bloom is analyzed by rough set theory. First the study of the function involves three
aspects: algal average activation energy of photosynthesis, integrated nutritional status index, and
transparency, which are considered from the microcosmic level., the macroscopic level and the intuitionistic
level respectively. The values of the function are classified properly. At the meantime, the weight value of
each evaluative parameter is determined objectively, via the theory of multiple criteria decision making,.
By analyzing and calculating the experimental data, the obtained values of the function and the
classification results can be verified using the data of the samples. Good agreement is obtained between the
results and the fact. The results of simulation and application show that: LSSVM improves the algorithm of
support vector machine (SVM).; it has long-term prediction period, strong generalization ability, high
prediction accuracy; and needs a small amount of sample and this model provides an efficient new way for
medium-term water bloom prediction.
1 INTRODUCTION
A global environmental and economic problem
caused by water bloom is paid more and more
attention by the public (Jin Xiangcan, 2004). Many
studies about eutrophication in inland lakes exist at
present, and all of these studies are relatively mature
with great achievement. However, the occurrence of
water bloom and its evaluation system is rarely
studied. Some scholars have made a research about
the phenomenon of water bloom and have
established exploratory water bloom outbreak
evaluative function. However, geographical
differences of water quality and algal growth must
be drew proper attention. Moreover, the weight of
each evaluative factor in the mathematic model
mentioned above is analyzed experiences and
calculated on the basis of the original data. As a
result, no mathematical model of water bloom
evaluation has been reported by far (Van Gestel T.,
2004).
This paper adopts the characteristics of the lake,
and it could determine the algal average activation
energy of photosynthesis ( E ), status index of
nutritional (TLI(∑)), and transparency(SD) are
the parameters of evaluation function for water
bloom, and the model for evaluation function of
water bloom F is established utilizing the weights of
those parameters determined objectively by multiple
attribute decision making. The obtained
experimental data is used to calculate the evaluative
function value of water bloom and the function
values are properly classified. The verification
results of the samples are in line with the true fact. In
this way, the evaluative function of water bloom
offers a significant theoretical basis for the water
bloom intelligent prediction of lakes.
391
Liu Z., Wang X. and Wei W..
A COMPREHENSIVE EVALUATION MODEL AND INTELLIGENT PREDICTION METHOD OF WATER BLOOM.
DOI: 10.5220/0003682703910394
In Proceedings of the International Conference on Neural Computation Theory and Applications (NCTA-2011), pages 391-394
ISBN: 978-989-8425-84-3
Copyright
c
2011 SCITEPRESS (Science and Technology Publications, Lda.)

2 INTEGRATED EVALUATIVE
FUNCTION OF WATER BLOOM
2.1 The Construction of Integrated
Evaluative Function of Water
Bloom
Because water eutrophication provides nutrition for
the water bloom, and algal average activation energy
of photosynthesis E (microcosmic level), integrated
nutritional status index which serves as basic
parameter, and transparency are introduced to
construct water bloom evaluative function, whose
mathematical model is as follows:
1
n
ii
i
F
WT
=
=
∑
(1)
Where F is the evaluative function of the water
bloom and Wi is the weight coefficient of each
evaluative parameter. Since the unit of each
evaluative factor might be different, every evaluative
factor should be normalized and represented by T.
The normalization formula is as follows:
2
1
ij
ij
m
ij
j
R
r
R
=
=
∑
(2)
2.2 Lalgal Average Activation Energy
of Photosynthesis E
Supposing
v
is photosynthesis rate, T is
thermodynamic temperature and R is the gas
constant. According to the literature, photosynthesis
is defined as:
2
lndv E
dT RT
=
(3)
A
dc
v
dt
=
(4)
Where dc
A
is algal biomass concentration, C
A
is
the value of phytoplankton biomass(mg/L) and C
A
is
chlorophyll a concentration (
/
g
L
μ
)。According
to the features of lakes, the equation of chlorophyll a
can be represented as follows, which is the
mathematic model of algal growth mentioned in the
reference:
ma x ma x
(293) (293)
[ 1.066 1.08 ]
a
pa
pI
dc TP I
TT
GDmc
dt TP K I K
×
−−
=× × − −×
++
(5)
Via above equations, algal average activation
energy of photosynthesis E can be expressed as:
( 293) ( 293)
max max
0.328 [ .1.066 . .1.08 ].
1
ln
TT
pa
pI
TP I
GDmc
TP K I K
Rd
E
dT
−−
×−−
++
−
=
∫
∫
(6)
Since water bloom usually breaks out during a
period when water temperature is relatively stable
and normally, temperature difference is a constant
value. To make calculation easy, we assume T2-
T1=1, so
( 20) ( 20)
max max
0.328 [ .1.066 . .1.08 ].
2
ln
TT
pa
pI
TP I
GDmc
TP K I K
E
RT
−−
×−−
++
=
(7)
2.3 Multiple Attribute Decision Making
Accessing to the Weight of Each
Parameter of Water Bloom
Evaluation
In the problems of Multiple Attribute Decision
Making, a great number of objective methods in
terms of attribute evaluation exist, and this paper
utilizes the method for ensuring attribute weights
proposed in the literature
[10]
to get access the weight
of each factor in the water bloom evaluation, the
model is as follow:
nm
22
ij i j
111
m
jj
j1
() () (,)
. . 0, 1, 2, 1
n
i
iij
M
inF W D W d r r W
st W j m W
===
=
′
==
≥= =
∑∑∑
∑
"
(8)
In the model,
ij
r
is the value of each attribute in
the matrix of standardization,
'
i
r
is the ideal value of
each attribute,
'
(,)
ij i
d
rr
is the norm between the value
and ideal value of each attribute, known as the
proximity. Specific calculation steps are as follows:
Determining the matrix of attribute:
[]
ij n m
Aa
×
=
,
1, 2, , , 1, 2, 3inj
=
="
The standardization for the decision-making
matrix.
Ensuring the ideal value of each attribute.
Resolving the model (13) to obtain the
optimal weight vector of attributes:
j
,(j 1,2,3)W =
,
NCTA 2011 - International Conference on Neural Computation Theory and Applications
392

3 COMPREHENSIVE
EVALUATION FUNCTION
FOR WATER BLOOM
3.1 Calculation of Comprehensive
Evaluation Function for Water
Bloom
Calculate the data selected from No. 2, 4 and 5 pools
of second group, and select a value respectively in
morning and afternoon everyday as the data to be
calculated.
3.2 Calculation Result Analysis of
Water Bloom Evaluation Function
Via the analysis of experiment data to each pool, it
could indicate that the quality of water was at a good
state and all of the average activation energy of
algae, integrated nutritional status index and the
function value of water bloom evaluation water
relatively low.
4 WATER BLOOM PREDICTION
METHOD BASED ON LSSVM
4.1 Determination of Prediction Model
Parameters
Rough set theory is a mathematical instrument which
is used to describe incomplete and uncertain
information. Under the precondition of maintain key
information, it will simplify data so as to lead its
property to be minimum conciseness and to obtain
knowledge minimum expression. Result of rough set
analyzation of water bloom prediction index is as
follow:
Table 1: Rough set analysis of water bloom influence
factors.
I
Total
phosphorus
(TP)
Total nitrogen
(TN)
Temperature(T)
95% 90% 85%
II
illumination
intensity
dissolved
oxygen (DO)
75% 70%
III
pH value
transparency
(SD)
electrical
conductivity
55% 45% 30%
From Table 1, the highest contribution ratio
factors are TP
,
TN
,
T. The high contribution ratio
factors are illumination intensity and DO. Chl_a is
used to be output variable of prediction model.
Considering the occurrence of water bloom has its
accumulated characteristic which will progress as
time going, former-moment characterization factor,
which closely relates to water body eutrophication,
also contains partial information of occurrence of the
next moment.
4.2 Data Pretreatment and Modeling
4.2.1 Data Pretreatment
(
)
(
)
min max min
2/ 1TXX XX
=
−−−
(9)
In this formula,
X
is initial data,
T
is data after
transformation .
4.2.2 Core Functions and Model Parameters
Polynomial core function, radial basis function and
multi-layer Sigmoid core function are frequently
used core functions. Compared with the abilities of
other kinds of core functions, the ability of RBF core
function is proved to be best among all core
functions
[14]
. Thus, RBF core function is used.
()
2
2
,
2
k
k
x
x
Kx x
σ
−
=−
(10)
In the formula,
()
2
2
1
n
kk
ki
i
x
xxx
=
−= −
∑
(11)
Here
σ
is core width.
LSSVM prediction model based on RBF core
function contains two important parameters:
regularization parameter gam and RBF core function
parameter sig2. For the regression prediction
problem, cellular search method is usually used to
determine parameters
[12]
. In cellular search method,
M values and N values are selected respectively from
gam and sig2 in a certain appropriate range. Then
after combining M·N (gam
, sig2) sets, different
LSSVMs are trained respectively so as to gain a set
which has minimum mean absolute error in those
M·N
(gam,sig2)sets. This set could be used as
optimized parameter. The result of optimized
parameters is as follow:
A COMPREHENSIVE EVALUATION MODEL AND INTELLIGENT PREDICTION METHOD OF WATER BLOOM
393
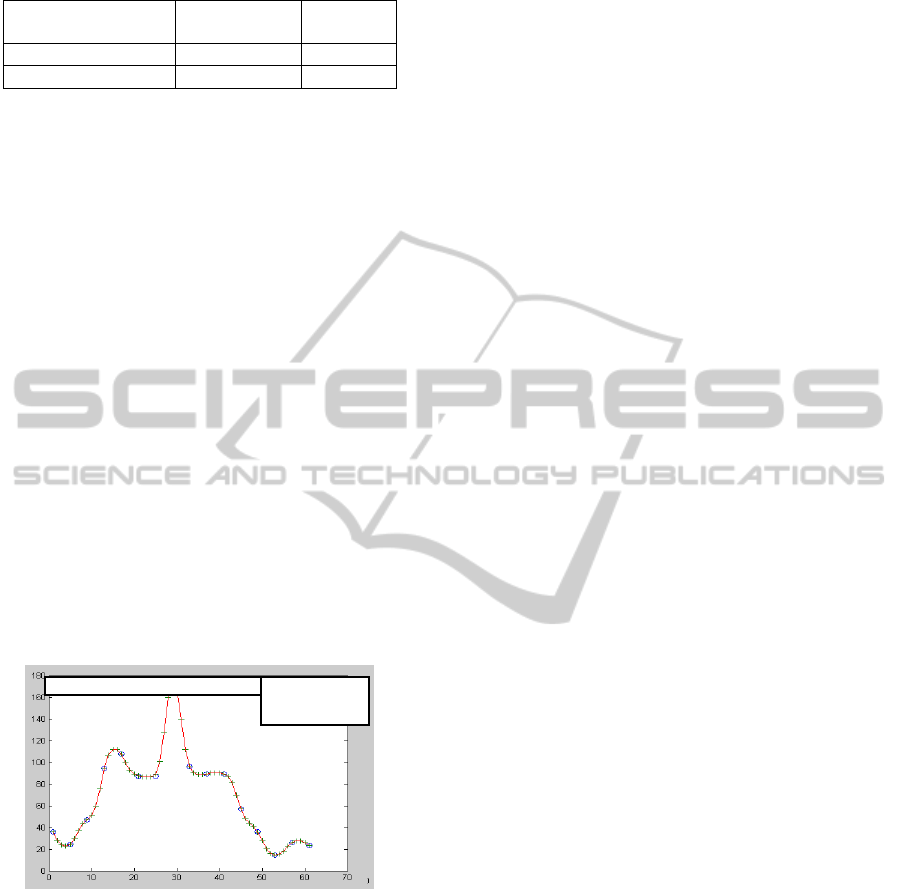
Table 2: Optimal parameter value of LSSVM.
Prediction
parameters
Two days
later
One week
later
gam 150 200
Sig2 0.05 0.05
4.3 Establishment of Prediction Model
The structure of LSSVM prediction model is as
follow:6 input variables: temperature T, dissolved
oxygen DO, illumination intensity, total phosphorus
TP, total nitrogen TN and chlorophyll Chl_a. One
output variable is Chl_a;
4.4 Analysis of Prediction Result
100 groups of water quality monitor data which have
been normalized are substituted in LSSVM water
bloom prediction model. Prediction result is as Fig. 1.
Initially, the data of test Second group, as the
training data of network, is trained by neural
network function which is provided by MATLAB
and its error is controlled in the range of 0.0001.
Then, SIM emulational function is used for
interpolation emulational output. Comparing the
diagrams of prediction result with real measurement
result until proper interpolation value is generated.
Interpolation graphs of some partial parameters are
as above.
Figure 1: Chl_a value in LSSVM prediction model.
5 CONCLUSIONS
Study comprehensively the synthesis effects of the
photosynthesis of algae for average activation
energy, comprehensive integrated nutritional status
index, and the transparency, establish the model of
water bloom evaluation function, and utilize the
Multiple Attribute Decision Making theory to ensure
the attribute weights for all evaluated parameters
impersonally. The results, concluded by the analysis
and calculation of the experiment data, indicate that
should be discussed and verified further.
Rough set theory is used firstly to analyze the
main influence factor of water bloom. Water bloom
prediction model for lakes based on LSSVM is
established and this model is compared with other
artificial neural network prediction model.
Prediction model result shows: LSSVM improves the
algorithm of SVM.; it needs a small amount of
samples, has long-term prediction period, strong
generalization ability and high prediction accuracy;
it can better predict the medium-term change rule of
chlorophyll and provide a new efficient way for
water bloom medium-term prediction.
ACKNOWLEDGEMENTS
This supported by the Beijing Natural Science
Foundation (8101003), and the Beijing Municipal
Commission of Education (PHR201007123,
PHR201008238) and its Science and Technology
Foundation Project. Those supports are gratefully
acknowledged.
REFERENCES
Jin Xiangcan, Li zhaochun, Zheng Sufang et., 2004.
Growth characteristics of microcystis aeruginosa.
Environmental Science Research
Van Gestel T., Suykens J.A.K, Viacne S., 2004.
Benchmarking least squares support vector machine
classifiers, Machine Learning.
Real value and
p
rediction value
○Actual Value
●Predict Value
NCTA 2011 - International Conference on Neural Computation Theory and Applications
394
