
EVALUATION OF THE EFFECT OF ND:YVO
4
LASER
PARAMETERS ON INTERNAL MICRO-CHANNEL
FABRICATION IN POLYCARBONATE
S. M. Karazi and D. Brabazon
School of Mechanical and Manufacturing Engineering, Dublin City University, Dublin, Ireland
Keywords: Pulsed Nd:YVO
4
laser, ANN, Factorial DoE, Predictive models, Channel dimensions, Polycarbonate.
Abstract: This paper presents the development of Artificial Neural Network (ANN) models for the prediction of laser
machined internal micro-channels’ dimensions and production costs. In this work, a pulsed Nd:YVO
4
laser
was used for machining micro-channels in polycarbonate material. Six ANN multi-layered, feed-forward,
back-propagation models are presented which were developed on three different training data sets. The
analysed data was obtained from a 3
3
factorial design of experiments (DoE). The controlled parameters
were laser power, P; pulse repetition frequency, PRF; and sample translation speed; U. Measured responses
were the micro-channel width and the micro-machining operating cost per metre of produced micro-
channel. The responses were sufficiently predicted within the set micro-machining parameters limits. Three
carefully selected statistical criteria were used for comparing the performance of the ANN predictive
models. The comparison showed that model which had the largest amount of training data provided the
highest degree of predictability. However, in cases where only a limited amount of ANN training data was
available, then training data taken from a Face Centred Cubic (FCC) model design provided the highest
level of predictability compared with the other examined training data sets.
1 INTRODUCTION
Laser micro-machining is a materials-processing
technique that uses precise laser energy per unit area
and per unit time in order to manage the thermal
field in the processed material with minimal thermal
damage and high precision. The material is in most
cases almost instantly brought up to melting
temperature and to vaporisation temperatures to
create the desired voxelated region of the micro-
machined channel. Laser micro-machining processes
include the drilling, cutting, milling and engraving
of materials with micro-dimensional tolerances.
Various statistical and numerical methodologies
have been implemented to predict and optimise
several laser manufacturing processes including
Artificial Neural Networks (ANN) (Lee et al. 2001);
Genetic Algorithms (GA) (Ye, Yuan and Zhou,
2009), Design of Experiments (DoE) (Karazi, Issa
and Brabazon, 2009), Finite Element Analysis
(FEA) (de Deus and Mazumder, 1996), Ant Colony
optimisation (AC) (Wang and Xie, 2005), and Fuzzy
Logic (FL) (Shen et al. 2006).
Due to their non-linear, adaptive and learning
ability using collected data, ANN models have been
successfully applied to a large number of problems
in several domain applications. Neural network
nodal functions can be evaluated simultaneously,
thereby gaining enormous increases in processing
speed (Collins and DeLucca, 2008, Neural
networks).
The prediction of the dimensions of the laser
micro-machining channels is an important
requirement for optimisation of the laser control
parameters. A Nd:YVO
4
laser micro-machining
system was previously used by the current authors
for the production of micro-channels (Karazi and
Brabazon, 2010) where it was shown that a wide
variety of desired geometries can be prepared.
ANN models were constructed and analysed to
test their predictive capabilities in this work. These
predictive models relate the input laser processing
parameters (power, traverse speed and pulse
repetition frequency) to the output responses
(machined channel width and micro-machining
cost). These ANN models may be used to select the
process input parameters which are required in order
254
M. Karazi S. and Brabazon D..
EVALUATION OF THE EFFECT OF ND:YVO4 LASER PARAMETERS ON INTERNAL MICRO-CHANNEL FABRICATION IN POLYCARBONATE.
DOI: 10.5220/0003683202540259
In Proceedings of the International Conference on Neural Computation Theory and Applications (NCTA-2011), pages 254-259
ISBN: 978-989-8425-84-3
Copyright
c
2011 SCITEPRESS (Science and Technology Publications, Lda.)

to achieve micro-channel dimensions within a
specified budget.
2 EXPERIMENTAL SET-UP
2.1 Experimental Work
In this paper, a 2W Nd:YVO
4
1064 nm wavelength
laser system was used for the micro-channel
fabrication. These internal micro-channels were
created in polycarbonate (PC) sheets of 10 mm
thickness. In order to facilitate the measurement of
the micro-channels’ widths, a 2 mm distance
between micro-channels was set. For micro-
machining, the PC work pieces were initially
positioned on the 3D positioning stage such that the
laser spot was focused beyond the sample surface.
The laser beam was then fired and the sample moved
away from the stationary laser head. This laser
micro-machining processing technique enabled
creating the internal micro-channel from the back to
the front of the sample
2.2 Experimental Design
In order to study the relationship between the main
Nd:YVO
4
laser process parameters and the
developed micro-channel width and corresponding
micro-machining operating cost, an arranged series
of information-gathering experiments was designed
according to DoE methodology.
In this paper, the examined laser process input
parameters were laser power, P; pulse repetition
frequency, PRF; and sample translation speed; U.
Each of these parameters was analysed at the low,
middle, and high levels, all of which were
determined after initial screening experiments. This
3
3
factorial design of experiments was prepared
using Design-Expert V7 software. The design levels
of the laser input parameters are shown in Table 1.
Table 1: Design of Experiment set levels of power, pulse
repetition frequency and sample speed used, as well as
corresponding level coding.
Variables P (W) PRF (kHz) U (mm/sec)
Low 0.5 13 0.5
Mid 1 23 1.74
High 1.5 33 2.98
There are 27 possible combinations of the three
process parameters at the three selected levels. The
centre point of the design was repeated five
additional times, where (P=1 W, PRF=23 kHz,
U=1.74 mm/sec), to provide a measure of process
stability and inherent variability.
2.3 Micro-channels Width
Measurement
The micro-channel width (diameter) for each
experiment was measured at three different locations
along the produced channel and the average values
were determined. Theses dimensional measurements
were carried out using Leica optical microscope and
OMNIMET image analysis software.
The measurement results of the repeated
experiments were averaged to one, bringing the
overall number of experiments from 32 to 27 unique
experiments. These measurement results (27 for
width and 27 for micro-machining cost) provided the
data set from which training sets were chosen for the
subsequent ANN modelling.
Table 2: Breakdown of estimated micro-machining cost per hour.
Element of cost Calculations Cost €/hr
Laser power supply
(800 W) (€0.16/kW hr) (P/2) / 1000 0.064×P
DELL PC Optiplex 170L & monitor (140 W)(€0.16/kW hr) / 1000 0.0224
CompactRIO - control power (8.2 W) (€0.16/kW hr) / 1000 0.0013
D-link network switch (4.5 W) (€0.16/kW hr) / 1000 0.0007
BWD MiniLab - motion power (43 W) (€0.16/kW hr) / 1000 0.0069
Diode replacement (€ 11,410 / 10000 hr) 1.141
Maintenance labour (12 hr/2000 hr operation) (€ 50/hr) 0.3
Total estimated micro-machining cost per hour 1.4723 + 0.064×P
Micro-machining cost [€/m] =
..×
€
hr
(
.
)
×
hr
=
(..)
(1)
EVALUATION OF THE EFFECT OF ND:YVO4 LASER PARAMETERS ON INTERNAL MICRO-CHANNEL
FABRICATION IN POLYCARBONATE
255
2.4 Micro-machining Cost Calculation
Processing cost can be approximated as micro-
machining cost per length for a specific laser micro-
machining operation. In this approach, unplanned
maintenances and breakdowns have not been taken
into consideration. Furthermore, labour cost was not
considered since the Nd:YVO
4
laser was for
experimental purposes. Assuming the relationship
between the electrical consumption of the laser
power supply and the laser power emitted by the
laser head is linearly proportional, the total
estimated operating cost per hour as a function of the
output power can be expressed by 1.4723 +
0.064×P.
Table 2 shows a breakdown of estimated micro-
machining cost per hour. Assuming 85% utilisation,
the total approximated operating cost per unit length
(in €/m) is given by the following Equation (1).
2.5 ANN Models’ Setup
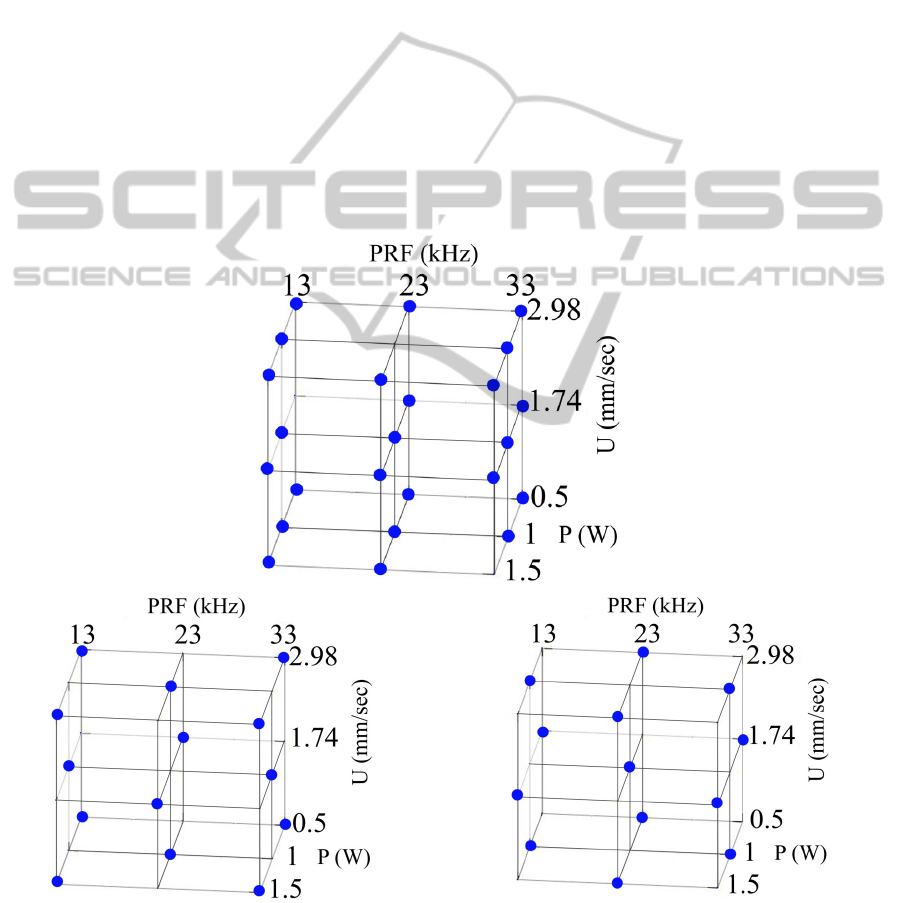
Three ANN predictive models were developed for
the width and another three for micro-machining
cost estimation using the three inputs P, U, and PRF.
These models were developed in order to examine
the influence of changing the number and the
selection of training data on the prediction capability
of the ANN model. These six models were based on
3 different training data sets as follows:
- Model I: 24 randomly selected experiments (from
the total of 27) were used to train the network;
- Model II: 14 experiments, selected according to the
Face Centred Cubic (FCC) Design, were used to
train the network;
- Model III: 13 experiments, selected according to
the Box-Behnken (BB) Design, were used to train
the network.
Figure 1: Schematic representation of the training data for (a) model I, (b) model II, and (c) model III.
(b) (c)
(a)
NCTA 2011 - International Conference on Neural Computation Theory and Applications
256
Each of these three models was used for two
models, one for the width prediction and another for
the operating cost per metre prediction. All 27
experimental data were employed for verification
purposes in order to locate the best ANN structure
within the various possible architectures for each
model. Figure 1 shows a representation of the
training data distribution in 3D space (a) for model I,
(b) for model II, and (c) for model III. The training
set of models II & III were selected according to two
popular designs; FCC Design and BB Design
respectively. These two designs were selected in
order to investigate which design should be chosen
in case only a limited number of experiments could
be performed. This scenario could occur when for
example carrying out the experiments is time
consuming, expensive, or dangerous.
2.6 Configuration of ANN Models
In this work, all the studied ANN models were of
feed-forward structure and back-propagation
algorithm. Moreover, they were designed and
executed using the aNETka software. Due to the
lack of a quantifiable procedure for theoretical
appraisal of the best ANN architecture, exhaustive
trial-and-error study was performed to find the best
ANN configuration for each model. Two ASCII text
input files were prepared for each model. The first
one contained the training data inputs and
corresponding outputs for the training stage. The
second one contained all 27 experimental data inputs
and their corresponding outputs for the verification
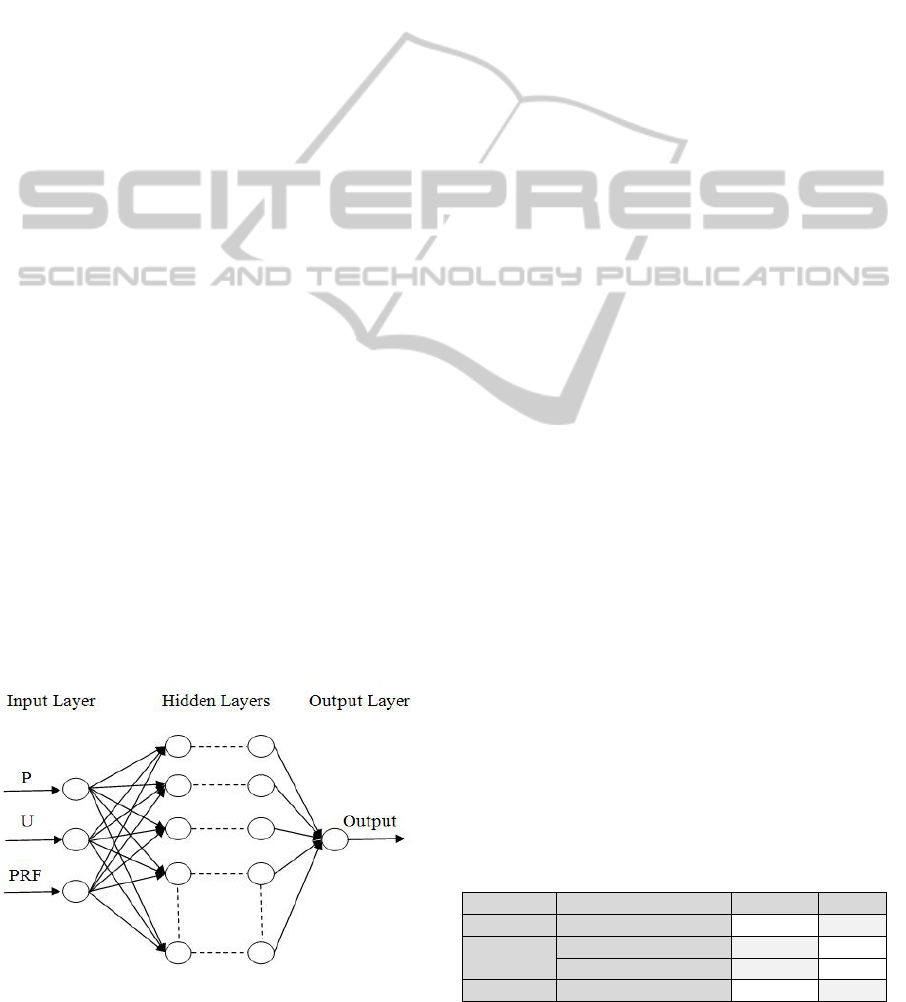
stage. In order to find the best ANN model, the
number of hidden layers was changed up to four and
the number of neurons in each hidden layer was
varied up to 100 neurons. A diagrammatic
description of the examined ANN architectures is
shown in Figure 2.
Figure 2: Architecture of feed-forward ANN schema
developed with three inputs and one output.
Due to its good generalisation capability, a
transfer sigmoid function was used in all
investigated ANN architectures. Since the learning
rate value controls the magnitude of weight and bias
updates, the choice of this value meaningfully
influences ANN schemas training time. Empirically
the learning rate value was manually varied between
0.0001 and 6 depending on the progress of the
aNETka execution during training process.
To avoid and reduce the probability of the
training runs being stuck in local optima, the
momentum parameter was utilised and fixed at a
medium value of 0.8 for all ANN training runs.
In the ANN program used the training data was
iteratively passed one by one through the ANN
structure and the weights were automatically
adjusted after each iteration. Part of the training data
was randomly selected and set aside by the aNETka
software in order to be used as a validation set and a
criterion to decide when to stop the training. In an
effort to minimise the training error and avoid over
training, the training process was supervised during
the ANN model formulation. The training part of the
aNETka software provided the user with a graphical
chart of the past and current RMS error value. This
graphical chart was ceaselessly supervised so that
ANN configurations with the highest prediction
capability could be obtained for each model.
Configurations for which the RMS errors raised
significantly and continuously during training were
dropped. Afterwards, the process of ANN structure
formation was restarted and only structures with
RMS error value below 0.001% were accepted.
3 RESULTS
3.1 Final ANN Structures
In this work and after trying a wide variety of hidden
layer diversifications, it was discovered that the best
ANN schemas were obtained with one or two hidden
layers. Table 3 shows the number of neurons in the
hidden layers that achieved best predictions of width
and cost for models I, II, and III.
Table 3: Number of neurons in the hidden layers for width
and depth in I, II, and III models.
Model Hidden layers width cost
I 1
st
6 4
II
1
st
3 4
2
nd
3 -
III 1
st
8 4
EVALUATION OF THE EFFECT OF ND:YVO4 LASER PARAMETERS ON INTERNAL MICRO-CHANNEL
FABRICATION IN POLYCARBONATE
257

3.2 ANN Predictive Models’
Comparison
Comparison criteria are needed in order to quantify
the difference between values produced by a model
and the actual values. After a profound search in
statistics, three statistical estimators were found to
be the best criterions that together can do the
required work. These statistical estimators are MSE
(Mean Squared Error), R2 (The coefficient of
determination), and MAPE (Mean Absolute
Percentage Error). These estimators were employed
to provide a measure of how well future outcomes
are likely to be predicted by the investigated model.
Table 4 shows a side by side comparison between
models I, II, and III in terms of the three chosen
estimators.
The Mean Squared Errors (MSE), the
coefficients of determination (R
2
), and the Mean
Absolute Percentage Errors (MAPE) for width and
depth in I, II, and III models are shown in Table 4.
Lower values of MSE and MAPE and higher values
of R
2
indicate better model fit.
MSE, R
2
, and MAPE were calculated according
to the Formulas below:
MSE =
1
(
(
y
−y
)
)
(2)
R
=
∑
(
(
y
−
)
)
∑
(
(
y
−
)
)
(3)
MAPE =
1
y
−y
y
(4)
Where n is the number of experiments, y is the
actual value, and y is the predicted value, is the
mean of actual values.
Practically these three estimators were used for
the selection of the best ANN schemas for each
model in the first place. Moreover, they were used to
compare the models I, II, and III.
4 DISCUSSION
In this work, factorial DoE assisted in the selection
of training data sets for the ANN predictive models.
Furthermore, it was found that ANN predictive
models have inherent capability to effectively re-
produce the outcomes of a nonlinear, complex and
dynamic system, like a laser micro-machining
system.
Ranking the models (I, II, and III) according to
the three statistical estimators, model I was the best
for width and cost responses. This might be
attributed to the great number of training data used
in this model (24 out of 27 available data). This was
the largest amount of training data compared to the
other models (14 for model II and 13 for model III).
This enabled model I to predict the whole
experimental data width and operating cost with a
small margin of error.
Model II was next best and better than model III,
even though both having almost the same number of
training data but different training data set. This
might be due to the fact that the training data set in
model II was chosen according to FCC Design
which covers all the corner points from the
experimental data space. While the rather worse
prediction of model IIIs that used BB Design, can be
comprehended when the absence of the eight
experimental data space corner points from the
training set is taken into account. So due to the lack
of these influential points, the estimation within the
data ranges will not be adequately exact from this
model.
It can be seen clearly from Table 4 that statistical
estimators for cost prediction are a lot better than
their counterparts for width prediction. This can be
attributed to the fact that production cost is
proportional to its inputs and it was originally
estimated using Equation (1). Furthermore, this
demonstrates the ability to utilise ANN as an
arbitrary function estimation technique that uses
experimentally observed data to “learn”.
Another notice from Table 4 that all statistical
estimators came to an agreement, model I was the
Table 4: Comparison criteria for width and depth models in I, II, and III models.
Estimator
Width
Estimator
Cost
I II III I II III
MSE 24.8 192.7 206.8 MSE 8x10
-11
9065x10
-11
273253x10
-11
R
2
0.99 0.95 0.95 R
2
0.99 0.99 0.99
MAPE 1.2 % 6.0% 7.2 % MAPE 0.003 % 0.038 % 0.100 %
NCTA 2011 - International Conference on Neural Computation Theory and Applications
258

best, model II the second, and model III the worst
with regards to both predictions, width and cost.
This indicates that these estimators work together in
harmony and have been well chosen. These results
empirically establish their use as criteria for
selecting both the best ANN configuration for a
developed model and the best model that describes a
system or a problem.
5 CONCLUSIONS
DoE was used to design an arranged series of
information-gathering experiments to characterise
micro-channel formation using a Nd:YVO
4
laser.
The relationship between the main laser process
parameters and the developed micro-channel width
and corresponding micro-machining operating cost
was examined using feed-forward, back-propagation
ANN predictive models. The influence of changing
the number and the selection of training data on the
prediction capability of the developed ANN
predictive model was investigated. MSE (Mean
Squared Error), R2 (The coefficient of
determination), and MAPE (Mean Absolute
Percentage Error) were utilised as a basis for
comparison between the developed ANN predictive
models.
The comparison showed that model I (which has
the highest number of training data) was the best.
Moreover, model II is better than model III (both
have almost the same number of training data but
different training data set). This indicates that the
more training data employed the better model fit
acquired. However, when limited number of
experiments (training data) is allowed, the outcomes
of this work favoured using FCC Design over BB
design for the selection of training data. This result
indicates that using FCC design for training data
selection was found more efficient in predicting
width and micro-machining cost and highlighted the
importance of including all experimental data space
corner points in any training data set. Moreover, this
comparison showed that the ANN modelling
technique can be smoothly employed to predict the
laser machined micro-channel dimensions and
production cost precisely.
Automated systems control can allow the use of
the models presented in this paper in order to
produce optimised micro-channels with high
dimensional precision and least production cost.
It was established in this work that the developed
ANN predictive models were efficient at satisfying
these demands and were effective for the prediction
of the most appropriate laser micro-machining
parameters.
REFERENCES
Collins, M. and DeLucca, M. 2011. Neural networks
[Online]. Available from: www.academic.marist.edu/
~jzbv/architecture/
Projects/S2002/NeuralNet2/COA.PPT, [accessed 27 July
2011].
de-Deus, A. M. and Mazumder, J. 1996. Two-
Dimensional Thermo-Mechanical Finite Element
Model for Laser Cladding, Laser Materials
Processing; Detroit, Michigan; USA, B174-B183
Karazi, S. M., Issa, A. and Brabazon, D. 2009.
Comparison of ANN and DoE for the prediction of
laser-machined micro-channel dimensions. Optics and
Lasers in Engineering, 47 (9), p. 956-964.
Karazi, S. M. and Brabazon, D. 2010. Analysis and
prediction of dimensions and cost of laser micro-
machining internal channel fabrication
process, International Symposium on Experimental
Mechanics ICEM14, Poitiers, France, EPJ Web of
Conferences, V 6, p. 25002.
Lee, S. H., Park, W.S., Cho, H. S., Zhang, W. and Leu, M.
C. 2001. A neural network approach to the modelling
and analysis of stereolithography processes,
Proceedings of the Institution of Mechanical
Engineers, Journal of Engineering Manufacture, 215,
p. 1719-1733.
Shen, H., Shi, Y. J.., Yao, Z. .Q and Hu, J. 2006. Fuzzy
logic model for bending angle in laser forming,
Materials Science and Technology, 22, p. 981-986.
Wang, G. G. and Xie, S. Q. 2005. Optimal process
planning for a combined punch-and-laser cutting
machine using ant colony, International Journal of
Production Research, 43, p. 2195 – 2216.
Ye, J., Yuan, X. C. and Zhou, G. 2003. Genetic algorithm
for optimization design of diffractive optical elements
in laser beam shaping, Proceedings of SPIE, 4594, p.
118-127.
EVALUATION OF THE EFFECT OF ND:YVO4 LASER PARAMETERS ON INTERNAL MICRO-CHANNEL
FABRICATION IN POLYCARBONATE
259
