
ELECTROCARDIOGRAM DERIVED RESPIRATION USING AN
EVOLUTIONARY ALGORITHM
Jakob Juul Larsen, Lars G. Johansen and Henrik Karstoft
Electrical and Computer Engineering, Aarhus School of Engineering, Aarhus University
Dalgas Avenue 2, 8000 Aarhus C, Denmark
Keywords:
Electrocardiogram Derived Respiration, Evolutionary Algorithms, ECG Modeling.
Abstract:
In this work we present a method to extract the respiratory signal from single lead ECG measurements, electro-
cardiogram derived respiration (EDR). The method is based on adaptive ECG modeling and respiratory signal
estimation using an evolutionary algorithm fed with the model parameters. The evolutionary algorithm, which
is allowed to employ a large constellation of functions, comes up with a set of relatively simple expressions
(3-4 terms) describing valid relationships between ECG model parameters and the respiratory signal. In fact,
the expressions mainly turn out to be linear combinations of the model parameters. Our preliminary experi-
ments indicate that this method yields a robust EDR, and that this EDR correlates very well with a reference
respiratory signal measurement. Correlation coefficients for the derived expressions lie around 0.95.
1 INTRODUCTION
Healthcare at Home is a field that will show signif-
icant growth over the next decades. This growth is
mainly driven by economic issues and health related
concerns (e.g. monitoring elderly people in their own
homes). An expected consequence of this is an in-
crease in the demand for telemedicine devices for re-
mote monitoring of physiological parameters.
It is well known that a variety of physiologicalsig-
nals and parameters can be derived from ECG mea-
surements, e.g. Heart Rate Variability (HRV). An-
other derivation is the respiratory signal, on which
we will focus in this work. Monitoring the respira-
tory signal can enable detection of sleep related symp-
toms such as central and mixed apnea, hypopnea, and
tachypnea, see (Raymond et al., 2000).
Deriving as many physiological signals and pa-
rameters as possible from as few body sensors as pos-
sible is generally desirable. Primarily in order to min-
imize user discomfort but also in order to minimize
cost and hardware complexity of the monitoring sys-
tem.
Respiratory signals can be measured using dedi-
cated devices but in order to keep the number of body
sensors low it would be advantageousto simply derive
the signal from ECG measurements using the existing
ECG sensors.
Derivation of the respiratory pattern from the ECG
signal is possible when the ECG is directly avail-
able. For healthy subjects, the normal respiratory cy-
cle modulates the heart rate, essentially determined
as the RR-distance in successive PQRST complexes,
and this modulation causes what is known as Respi-
ratory Sinus Arrhythmia (RSA), see (Clifford et al.,
2006a) and (Grossman and Wientjes, 1986). Typ-
ically, inhalation leads to cardio-acceleration, i.e. a
decrease in the RR rate of distance, and exhalation
causes cardio-deceleration. Similarly, the morpho-
logy of the PQRST complex is also affected by the
respiration, i.e. the wave amplitudes and the distances
between the different waves oscillates synchronously
with the respiration cycle.
In this work we will present a novel technique to
extract the respiratory signal from single lead ECG
measurements. Among other objectives, this tech-
nique aims at producing a robust RSA estimate as
an input parameter to bio-feedback systems. For ex-
ample, anxiety patients can make use of information
about their respiration presented to them in real time
in order to control the breathing. For patients suffer-
ing anxiety related disorders, controlled breathing can
be an important tool in diminishing the psychological
effects of sudden anxiety attacks.
147
Juul Larsen J., G. Johansen L. and Karstoft H..
ELECTROCARDIOGRAM DERIVED RESPIRATION USING AN EVOLUTIONARY ALGORITHM.
DOI: 10.5220/0003696101470152
In Proceedings of the International Conference on Bio-inspired Systems and Signal Processing (BIOSIGNALS-2012), pages 147-152
ISBN: 978-989-8425-89-8
Copyright
c
2012 SCITEPRESS (Science and Technology Publications, Lda.)

2 ECG DERIVED RESPIRATION
It is well known that the respiration signal can be de-
rived from the ECG signal. It is reported in the liter-
ature that respiration signal correlates to the changes
in the heart rate as well as changes in the morphology
of the PQRST complex. In the literature this is known
as ECG Derived Respiration (EDR). Many signal pro-
cessing methods have been derived to calculate the
EDR. For example in (Moody et al., 1985) the map-
ping from the ECG to the respiratory signal is given
by the area of the normal QRS complex.
(Mazzanti et al., 2003) propose a method for EDR
based on QRS areas in an 8 lead ECG measurement
setup. They find some limitations in the validity of
the EDR data, one important observation to mention
is that the sampling frequency of the ECG signal has
to be at least 500Hz, but still suggest the method as
being effective, for example in telemetric monitoring.
Recently, (O’Brien and Heneghan, 2007) com-
pared different algorithms for deriving the respira-
tory signal from single lead recorded ECGs compared
to a reference respiratory signal measurement based
on inductance plethysmography. One of the methods
applies interpolation between R wave amplitudes in
successive complexes. This technique is sensitive to
baseline wander, however they find a correlation coef-
ficient at 0.78 which indicates that the technique may
be useful.
(Sobron et al., 2010) have also evaluated diffe-
rent methods for estimating EDR. Their comparative
study included complex morphology such as the QRS
area and amplitudes as well as heart rate variability.
They suggest that combining EDR based on more of
these ECG derivations gives the best respiratory fre-
quency estimation.
This result probably does not come as a complete
surprise, and hence leads us to take this combination
method a step further, letting a evolutionary algorithm
map a large set of parameters representing the ECG
complexes into a respiratory signal.
3 EVOLUTIONARY ALGORITHM
Evolutionary algorithms have been known in the sci-
entific community since the late 1960 early 1970,
where John Holland introduced the basic idea. An
evolutionary algorithm is a randomized population-
based search technique, inspired by evolution princi-
ples from biology. Since its conception the paradigm
has been widely used in engineering and computer
science i.e. in computer programming, artificial intel-
ligence and optimization.
A specialized implementation of evolutionary al-
gorithms optimizes the symbolic regression problem.
In this problem the search space consists of symbolic
mathematical expressions, and the cost function for
minimizing, is a chosen error metric. The error met-
ric measures the residue between the estimate derived
from the symbolic expression and the real data (Koza,
1992).
A symbolic regression solver has been imple-
mented by (Schmidt and Lipson, 2009) in the appli-
cation Eureqa, which is freely available online on the
web. In our work we used Eureqa as a black box to
model the mapping from the ECG to the respiration
signal, in search for a more precise and robust esti-
mate of the EDR mapping.
4 EXPERIMENTAL METHODS
The ECG signal and the respiratory signal are si-
multaneously recorded by a commercially available
Zephyr Bioharness chest worn belt, (Zephyr Biohar-
ness, nd). The respiratory signal is measured with a
closed-source mechanical sensor. The sampling fre-
quency for the respiratory signal is 17.86 Hz (T=56
ms). The ECG signal is sampled at 250 Hz. All sig-
nals are recorded with the software supplied with the
Zephyr Bioharness. Some pre-processing of the ECG
signal, i.e. amplification and filtering are done au-
tomatically by closed-source systems in the Zephyr
device. All subsequent processing of the ECG and
respiratory signals are carried out in MATLAB (MAT-
LAB, 2010).
The ECG signal is often corrupted by small
amounts of nonstationary 50 Hz interference. This
noise is removed after signal acquisition with stan-
dard adaptive noise cancelling using a synthetic 50
Hz reference. Before modeling the ECG signal is seg-
mented into heartbeats. The location of each heartbeat
is found with an open source Pan-Tompkins algorithm
(Clifford et al., 2006b). The 250 Hz sampling fre-
quency of the ECG device is too low to ensure stable
modeling of the QRS complex (Clifford et al., 2006a).
This problem is counteracted by upsampling and in-
terpolation of the ECG signal to 1500 Hz before mod-
eling.
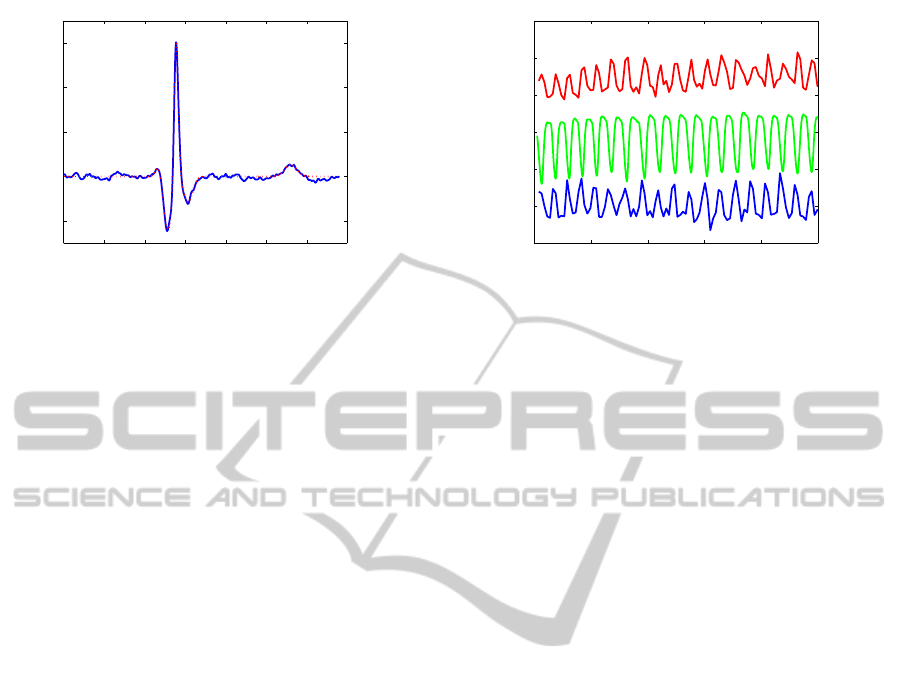
A typical heartbeat is shown in figure 1 along with
the mathematical model discussed below. The QRS
complex and the T wave are clearly visible. The P
wave is normally barely visible above the noise floor
on the recorded electrocardiograms. Therefore no at-
tempt has been made of using information from the P
wave in this work.
A large number of parameters can be extracted
BIOSIGNALS 2012 - International Conference on Bio-inspired Systems and Signal Processing
148
0 0.1 0.2 0.3 0.4 0.5 0.6 0.7
−50
0
50
100
150
time [s]
amplitude [a.u.]
Figure 1: An example of a recorded heartbeat (blue) and the
corresponding model (red).
from a single heartbeat i.e. amplitudes, areas and
shapes of the individual waves in the heartbeat as well
as the relative position between the waves. These pa-
rameters can be estimated directly from the recorded
ECG signals. To minimize the influence of mea-
surement noise each heartbeat is fitted to a model-
heartbeat and the parameters are extracted from the
mathematical model.
The mathematical model of the ECG signal con-
sists of 3 Gaussians with positive amplitude and 2
Gaussians with negative amplitude. The two nega-
tive amplitude Gaussians model the Q and S wave.
The positive amplitude Gaussians model the small
peak preceding the Q wave and the R and T waves
respectively. In related work (Clifford et al., 2006a)
an asymmetric T wave is modeled with two positive
Gaussian peaks. However, the T wave signal from
the Zephyr Bioharness is quite symmetric and, except
from a small baseline dip, well modeled by a single
Gaussian. The parameters of the model are found by
Levenberg-Marquardt fitting using MATLAB’s Opti-
mization Toolbox (MATLAB, 2010).
An example of a heartbeat and the correspond-
ing model is shown in figure 1. The model captures
the important features of the QRS complex and the T
wave well and discards the major part of the noise.
For each heartbeat a signal to noise ratio is measured
with signal being defined as the energy in the model
signal and noise being defined as the energy in the
difference between the experimental signal and the
model signal. The signal to noise ratio is normally
found to be in the 70-130 range. If heartbeats with
signal to noise ratios lower than 10 are found, they
are labeled as noisy and discarded.
Each heartbeat is matched with the corresponding
output from the respiratory sensor at the appropriate
time. The maximum of the R wave is defined as the
time zero for each heartbeat and the respiratory sam-
ple closest in time is chosen as the value of the respi-
0 20 40 60 80 100
0
5
10
15
20
25
30
time [s]
amplitude [a.u.]
Figure 2: Examples of typical measurements. The data are
vertically translated and scaled for clarity. The top curve
(red) shows the the amplitude of the R wave, the middle
curve(green) shows the respiratory signal, and the bottom
curve (blue) shows the distance between the peaks of the R
and S waves.
ratory signal. Due to the low sampling rate this proce-
dure leads to small errors in the value of the respira-
tory signal when this signal is changing quickly. The
maximum error is found to be smaller than 2%.
A number of parameters can be extracted from
the mathematical model of the heartbeat. Many of
these parameters will, however, be highly correlated.
An example of this is shown in figure 2 where three
parameters from a typical experiment are plotted; R
wave amplitude, the distance between the maximum
and minimum of the R and S waves and the respira-
tory signal. The R wave amplitude and R-S distance
are seen to oscillate in anti-phase with the respiratory
signal.
In this work where the goal is to let an evolu-
tionary algorithm decide the optimum combination of
ECG derived parameters for EDR the following pa-
rameters are extracted from each heartbeat: The am-
plitude, area and width, defined by full width at half
maximum, for the Q, R, S and T waves together with
the distances between the maxima of the Q and R
waves, the R and S waves and the S and T waves as
shown in table 1. Due to the low sampling rate and
build-in filtering function of the Zephyr Bioharness
no attempt have been made of extracting asymmetry
parameters of the waves.
All the extracted parameters have non-zero mean
values and numerically quite different values. All
ECG derived parameters are put on equal footing be-
fore they are used in the evolutionary algorithm by
subtracting their mean values and subsequently nor-
malizing the maximum value to one. Similarly, the
mean value is subtracted from the respiratory signal.
A number of possibilities exist for the fitness met-
ric for the evolutionary algorithm i.e. mean absolute
error, mean square error, correlation coefficient, me-
ELECTROCARDIOGRAM DERIVED RESPIRATION USING AN EVOLUTIONARY ALGORITHM
149

Table 1: List of model parameters derived from the ECG
signal and the absolute value of the linear correlation with
the respiratory signal.
Parameter |ρ|
Q
amp
0.43± 0.03
Q
area
0.31± 0.04
Q
fwhm
0.36± 0.01
R
amp
0.88± 0.01
R
area
0.83± 0.01
R
fwhm
0.17± 0.01
S
amp
0.21± 0.02
S
area
0.86± 0.01
S
fwhm
0.79± 0.01
T
amp
0.80± 0.01
T
area
0.81± 0.01
T
fwhm
0.08± 0.01
QR
distance
0.59± 0.01
RS
distance
0.67± 0.01
ST
distance
0.59± 0.02
dian error etc. In this work the optimization is done
with respect to the correlation coefficient similar to
the work of (O’Brien and Heneghan, 2007). The
search for the optimized connection between the ECG
derived parameters and the respiration signal can be
restricted by only allowing the evolutionary algorithm
to use a limited number of mathematical functions.
In this work addition, subtraction, multiplication and
division are used as building blocks unless otherwise
specified. The evolutionary algorithm is run on a stan-
dard dual core 2 GHz pc and each search is typically
run for 2-3 hours on data sets containing approxi-
mately 500 heartbeats.
The ECG and respiratory sensors in the Zephyr
Bioharness are sensitive to movement artifacts, there-
fore, the subject under investigation is seated in a
standard office chair, instructed to sit still, keep quiet
and breathe steadily during the recording of the data.
This procedure is found to be sufficient to minimize
artifacts to below a visible threshold. This procedure
also has the benefit of providing stationary data for
the evolutionary algorithm to work with in this proof
of concept investigation.
5 RESULTS
In a brute-force approach, all ECG derived parame-
ters should be feed immediately to the evolutionary
algorithm. It is, however, instructive to initially in-
clude only a limited amount of selected parameters
and subsequently include further parameters. This ap-
proach allows for a comparison with different meth-
ods described in the literature and potentially a better
understanding of the underlying mechanisms. In the
following sections a number of increasingly complex
optimization experiments are described.
5.1 Peak Amplitude
Under normal circumstances the peak amplitude of
the ECG signal is given by the maximum of the R
wave. This easily extracted parameter is known to
be correlated with the respiratory signal and a num-
ber of authors have used this feature to form an EDR
estimate, see e.g.(Clifford et al., 2006a) for a review.
Figure 2 shows a similar correlation between the am-
plitude of the R wave and the respiratory signal in our
experiments. Whether a higher degree of linear corre-
lation can be found by some nonlinear function of the
R wave amplitude isn’t obvious. A nonlinear relation
can originate in both the physical mechanisms con-
necting respiration and the heart beat morphology or
in inherent nonlinearities in the sensors used to mea-
sure the ECG and respiratory signal.
For the particular dataset investigated the corre-
lation coefficient between the normalized R wave
amplitude, R
amp
, and the respiratory signal is |ρ| =
0.88 ± 0.01. The uncertainty is estimated by the dif-
ference of ρ for the two parts of the data set used for
training and validation by the evolutionary algorithm.
When run with only addition, subtraction, mul-
tiplication and division as the mathematical build-
ing blocks for the evolutionary algorithm, the high-
est correlation found among the suggested solutions
is |ρ| = 0.89 ± 0.01 for the expression
EDR = − R
amp
+
1+ R
amp
4+ 24R
amp
+ 108R
2
amp
+ 216R
3
amp
+ 162R
4
amp
(1)
When the search space is increased to include con-
stant values, power functions, exponential and loga-
rithmic combinations and sine and cosine terms the
solution with the highest correlation coefficient (|ρ| =
0.90± 0.01) is given by the expression
EDR =sin(0.335− 2.22R
amp
)
× cos
−0.0477
0.177− 2.58R
amp
+ 5.91R
2
amp
!
(2)
The conclusion of this experiment is therefore that
when only the R wave amplitude is available, no sim-
BIOSIGNALS 2012 - International Conference on Bio-inspired Systems and Signal Processing
150

ple nonlinear function of this parameter gives a sig-
nificantly better correlation with the respiratory signal
than the R wave amplitude alone.
5.2 Peak-to-peak Amplitudes
A hardware based EDR technique has been presented
by (Dobrev and Daskolov, 1998). The main idea is
to find the maximum and minimum value of the ECG
in each heartbeat, the rationale being that the max-
imum and minimum value can be found with stan-
dard electronic hardware. The two extremum values
are subsequently squared, summed and smoothed by
a low-pass filter to provide the EDR signal.
In the work by Dobrev and Daskalov the maxi-
mum and minimum of the ECG signal are found at the
R wave and the S wave. However, the typical ECG
signal recorded with the Zephyr Bioharness have its
minimum at the Q wave and the optimization of a
peak-to-peak based EDR signal should therefore done
with the R and Q wave amplitudes.
When the evolutionary algorithm is run with R
amp
and Q
amp
as inputs the algorithm mainly evolves to a
number of quite elongated expressionsand one simple
expression
EDR = R
amp
+
1
3
Q
amp
(3)
With a correlation coefficient of |ρ| = 0.90 ± 0.01
which is slightly better than the correlation between
the respiratory signal and the R wave amplitude by it-
self. If the peak-to-peak amplitude, R
amp
+ Q
amp
, is
used directly to form the EDR estimate, the correla-
tion diminishes to 0.75±0.02.
5.3 Peak Amplitudes
Previous work by (Raymond et al., 2000) have
demonstrated that an EDR signal can be extracted
from the T wave. The EDR estimate was derived from
an averaged amplitude of the T wave. A natural ex-
tension of the peak-to-peak amplitude based EDR is
a search where the input is the amplitude of all peaks
present in the recorded signal i.e. the amplitude of the
Q, R, S and T waves. The correlation coefficients be-
tween the different wave amplitudes and respiratory
signal are shown in table 1.
The output from the evolutionary algorithm is
again a number of primarily rather long expressions.
However, one of the expressions is quite simple
EDR = Q
amp
+ 4R
amp
+ S
amp
+ T
amp
(4)
This EDR estimate has a correlation coefficient of
0.93± 0.01 and for this particular dataset we can con-
clude that the evolutionary algorithm devices an im-
proved EDR estimate compared to the standard meth-
ods of both R wave and amplitude and peak to peak
amplitude.
The improvement of the correlation if one of long
expressions is used for the EDR estimate is insignifi-
cant and well within the uncertainty limits.
5.4 All Parameter Search
The final experiment is to feed all parameters derived
from the ECG signal to the evolutionary algorithm.
Due to the increased number of available parameters
to combine, an improvement in the maximum corre-
lation is anticipated for the longest expressions. The
key issue is, however, whether a simple combination
will improve the correlation coefficient.
The highest correlation coefficient is found to be
ρ = 0.97± 0.01 for an involved expression contain-
ing fractions and cubic terms. However, a few simple
expressions also give high correlation coefficients i.e.
EDR = ST
distance
− S
area
− R
area
(5)
With ρ = 0.95 ± 0.01 and
EDR = ST
distance
+ Q
area
− R
amp
− 2R
area
(6)
With ρ = 0.96 ± 0.01.
These results shows that for the specific dataset
used, a high correlation between a simple combina-
tion of ECG derived parameters and the respiratory
signal can indeed be found by a computerized search.
Both EDR estimates make use of ST
distance
and R
area
suggesting that these two parameters are potentially
robust EDR estimators.
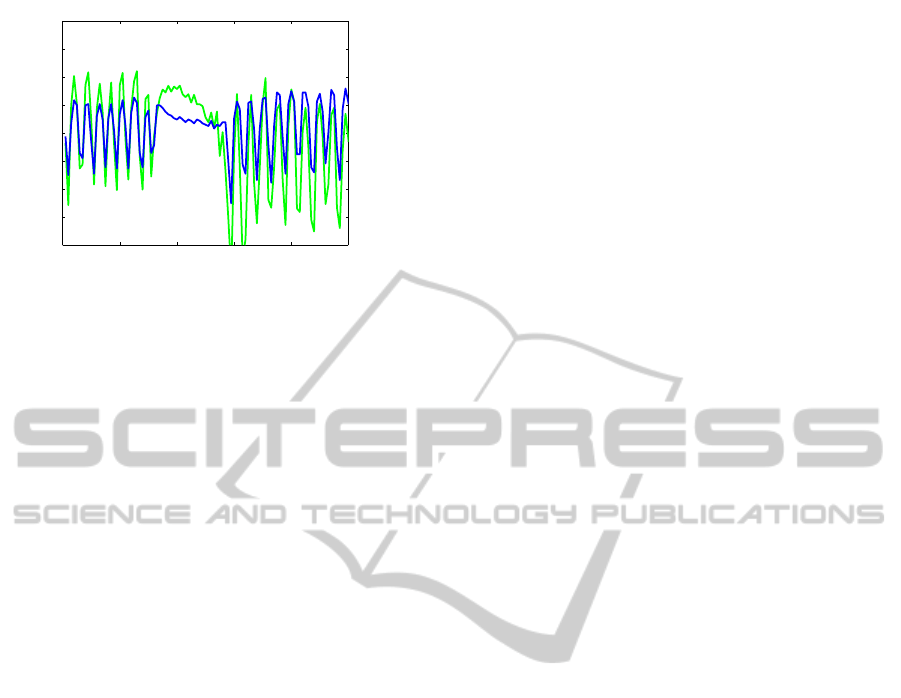
5.5 Nonstationary Breathing
A first test of the robustness of the EDR estimate has
been performed by recording a time series of ECG
and respiratory signals containing periods of bated
respiration resembling sleep apnea. An example of
this is shown in figure 3.
The EDR estimate is calculated with Eq (6). From
the figure it is evident that the EDR estimate captures
the bated respiration. In particular, the stopped res-
piration and restart of respiration is immediately cap-
tured.
6 CONCLUSIONS
The results and their applicability are currently lim-
ited by two major factors. First of all, the study has
not been carried out on a pool of patients. In order to
ELECTROCARDIOGRAM DERIVED RESPIRATION USING AN EVOLUTIONARY ALGORITHM
151
0 20 40 60 80 100
−2
−1.5
−1
−0.5
0
0.5
1
1.5
2
time [s]
amplitude [a.u.]
Figure 3: The graph shows the respiratory signal (blue) and
the EDR signal (green) for a subset of a timeseries contain-
ing periods of deep breathing and periods with bated respi-
ration.
demonstrate the robustness of this EDR approach the
study must be extended to a cohort with different gen-
der, age, etc. in different physical situations. Second,
the signal recording devices were chosen because of
availability rather than optimum superior signal qual-
ity. It is anticipated that better results could be ob-
tained by using an ECG device with a higher sampling
rate and full control of the amplification and filter-
ing of the signal. In particular, the asymmetry of the
T wave is suspiciously absent on our data generated
with the Zephyr Bioharness. Likewise, no informa-
tion from the P wave has been included.
Similarly, a more precise respiration sensor with
higher sampling rate and larger immunity to move-
ment artifacts would provide higher quality data to
feed into the evolutionary algorithm.
The goal of this work has been to investigate the
feasibility of optimizing EDR with an evolutionary
algorithm and provide a proof of concept. More re-
search remains to be done, but we have found that it is
indeed possible to optimize EDR with an evolutionary
algorithm and we believe that evolutionary algorithms
will provide a fruitful tool for further studies in EDR
and other biomedical signal processing problems.
ACKNOWLEDGEMENTS
This work is a part of the MIKAT project funded
by Region Midtjylland and the European Union via
Caretech Innovation.
REFERENCES
Clifford, G. D., Azuaje, F., and McSharry, P. E., editors
(2006a). Advanced methods and tools for ECG data
analysis. Artech House Publishing.
Clifford, G. D., Azuaje, F., and McSharry, P. E., edi-
tors (2006b). Advanced methods and tools for ECG
data analysis. Artech House Publishing, accompa-
nying website. Retrieved june 23, 2011 from http://
www.ecgtools.org.
Dobrev, D. and Daskolov, I. (1998). Two-electrode telemet-
ric instrument for infant heart rate and apnea monitor-
ing. Medical Engineering & Physics, 20:729–734.
Grossman, P. and Wientjes, K. (1986). Respiratory sinus
arrhytmia and parasympathetic cardiac control: some
basic issues concerning quantification, applications
and implications. In Grossman, P., Jansenn, K., and
Waitl, D., editors, Cardiorespiratory and cardioso-
matic psycophysiology, pages 117–138. Plenum Press,
NY.
Koza, J. R. (1992). Genetic Programming: On the Pro-
gramming of Computers by Means of Natural Selec-
tion. MIT Press, Cambridge, MA, USA.
MATLAB (2010). version 7.11.0.584 (R2010b). The Math-
Works Inc., Natick, Massachusetts.
Mazzanti, B., Lamberti, C., and de Bie, J. (2003). Val-
idation of an ECG-derived respiration monitoring
method. Computers in Cardiology, 30:613–616.
Moody, G., Mark, R., Zoccola, A., and Mantero, S.
(1985). Derivation of respiratory signals from multi-
lead ECGs. Computers in Cardiology, 12:113–116.
O’Brien, C. and Heneghan, C. (2007). A comparison of
algorithms for estimation of a respiratory signal from
the surface electrocardiogram. Computers in Biology
and Medicine, 37:305–314.
Raymond, B., Cayton, R. M., Bates, R. A., and Chappell,
M. J. (2000). Screening for obstructive sleep apnoea
based on the electrocardiogram - the computers in car-
diology challenge. Computers in Cardiology, 27:267–
270.
Schmidt, M. and Lipson, H. (2009). Distilling free-
form natural laws from experimental data. Science,
324(5923):81–85.
Sobron, A., Romero, I., and Lopetegi, T. (2010). Evaluation
of methods for estimation of respiratory frequency
from the ECG. Computers in Cardiology, 37:513–
516.
Zephyr Bioharness (n.d.). Retrieved june 23, 2011, from.
http://www.zephyr-technology.com.
BIOSIGNALS 2012 - International Conference on Bio-inspired Systems and Signal Processing
152
