
PHASE-RECTIFIED SIGNAL AVERAGING FOR THE
QUANTIFICATION OF THE INFLUENCE OF PRENATAL ANXIETY
ON HEART RATE VARIABILITY OF BABIES
Hannelore Eykens
1
, Devy Widjaja
1,2
, Katrien Vanderperren
1,2
, Joachim Taelman
1,2
,
Marijke A. K. A. Braeken
3
, Ren
´
ee A. Otte
3
, Bea R. H. Van den Bergh
3
and Sabine Van Huffel
1,2
1
Department of Electrical Engineering, ESAT-SCD, Katholieke Universiteit Leuven
Kasteelpark Arenberg 10, box 2446, 3001 Leuven, Belgium
2
IBBT-K.U.Leuven Future Health Department, Kasteelpark Arenberg 10, box 2446, 3001 Leuven, Belgium
3
Department of Developmental Psychology, Universiteit van Tilburg
Warandelaan 2, PO box 90153, 5000 LE Tilburg, the Netherlands
Keywords:
Phase-rectified Signal Averaging, Quasi-periodicities, Non-stationary Signals, Tachogram, Heart Rate
Variability, Prenatal Anxiety, Autonomic Nervous System.
Abstract:
The autonomic nervous system (ANS) modulates heartbeat intervals responding to inputs from its different
branches, resulting in periodicities that occur on different time scales. Internal and external perturbations are
continuously interrupting the periodic behavior, making the heartbeat intervals quasi-periodic. Phase-rectified
signal averaging (PRSA) is a technique to detect those quasi-periodicities in noisy, non-stationary signals,
like tachograms. The method compresses the tachogram in shorter curves based on internal information,
and provides information on the deceleration and acceleration capacity of the heart. In this study, the PRSA
technique is investigated as a novel signal processing technique for the analysis of heart rate variability (HRV)
of babies. In this way, the effect of stress and anxiety during pregnancy on the ANS of the baby is analyzed.
First, the PRSA curves are obtained for each baby and different measures that characterize these curves are
defined. Next, these measures are linked to the anxiety level of their mothers during pregnancy. Only little
influence of the anxiety level of the mother on the HRV of the baby is found.
1 INTRODUCTION
Stress and anxiety during pregnancy can lead to a less
optimal development of the fetus, which can result in
cognitive, emotional and behavioral problems in later
life (O’Connor et al., 2003; Van den Bergh and Mar-
coen, 2004). Prenatal stress may also cause infants to
suffer from a less mature autonomic nervous system
(ANS) and an increased sensibility to stress (Van den
Bergh et al., 2005). The activity of the ANS can be
evaluated based on the variability of the heart rate,
which is modulated by the interacting sympathetic
and parasympathetic branches. To assess heart rate
variability (HRV), the R peaks from the electrocardio-
gram (ECG) are detected and the intervals between
successive peaks (RR intervals) are plotted in time,
resulting in a tachogram. Based on this tachogram,
several measures that quantify HRV are defined. By
linking these HRV measures of the babies to the anxi-
ety level of the mothers, the influence of prenatal anx-
iety on the ANS of the babies can be examined. This
study is part of a larger project that aims at investi-
gating the relation between stress and anxiety during
pregnancy and the development and outcome of the
baby. In a previous phase, the relation between the
anxiety and the ANS of the pregnant women was an-
alyzed (Taelman et al., 2010).
The ANS modulates the heart rate by continu-
ously reacting to the inputs of the heart, lungs and
blood vessels. These heart rate modulations due to
intrinsic regulation processes occur on different time
scales, which can be evaluated with phase-rectified
signal averaging (PRSA). PRSA is a technique that
detects quasi-periodicities in non-stationary signals,
like the tachogram (Bauer et al., 2006b). It com-
presses the tachogram into a shorter sequence, keep-
ing all relevant quasi-periodicities but eliminating
non-stationarities, artifacts and noise. The resulting
163
Eykens H., Widjaja D., Vanderperren K., Taelman J., A. K. A. Braeken M., A. Otte R., R. A. Van den Bergh B. and Van Huffel S..
PHASE-RECTIFIED SIGNAL AVERAGING FOR THE QUANTIFICATION OF THE INFLUENCE OF PRENATAL ANXIETY ON HEART RATE
VARIABILITY OF BABIES.
DOI: 10.5220/0003702101630168
In Proceedings of the International Conference on Bio-inspired Systems and Signal Processing (BIOSIGNALS-2012), pages 163-168
ISBN: 978-989-8425-89-8
Copyright
c
2012 SCITEPRESS (Science and Technology Publications, Lda.)

PRSA curve characterizes the deceleration and accel-
eration capacity of the heart.
This paper focuses on the relevance of PRSA as a
technique to measure heart rate variability. However,
as other measures, defined in both the time and fre-
quency domain, are generally used to quantify HRV
(Task Force of The European Society of Cardiology
and The North American Society of Pacing and Elec-
trophysiology, 1996), we will briefly compare the
most commonly used time domain HRV measures
with the PRSA technique as well.
2 DATA
The data for this study have been measured at Tilburg
University as a part of the EuroSTRESS project that
investigates the influence of stress and anxiety dur-
ing pregnancy on the cardiorespiratory system of the
women and on the development of the baby. The State
Trait Anxiety Inventory (STAI) (Spielberger et al.,
1983) is used as a psychological measure to quan-
tify the anxiety during the first trimester of the preg-
nancy. Based on the STAI score, subjects belong to
a low (STAI ≤ 28), moderate (28 < STAI < 40) or
high (STAI ≥ 40) anxiety group. To assess the devel-
opment of the baby, the electrocardiogram and elec-
troencephalogram of the baby have been recorded at
two ages. During the acquisition, an auditory odd-
ball paradigm was presented. This paradigm consists
of five series of stimuli, in which a frequent stimulus
(1000 Hz tone) was randomly alternated with three
different deviant stimuli. The sampling frequency is
512 Hz; an ECG signal during one stimulus sequence
has a length of about 150 s. 76 babies of 2 to 4 months
old are included in the study.
3 METHODS
The basic principle of the PRSA technique consists
in defining anchor points, selecting windows around
these anchor points, aligning the windows, and av-
eraging over all surroundings. Next, measures are
chosen to describe the resulting PRSA curves. In or-
der to interpret the PRSA measures, some traditional
HRV measures are calculated to make the compari-
son. The results are statistically evaluated using the
Spearman’s correlation coefficient and the Wilcoxon
rank sum test.
3.1 Description of the PRSA Technique
Figure 1 outlines the basic steps of the PRSA tech-
nique, starting from the tachogram (Kantelhardt et al.,
2007). In the first step, anchor points are selected
according to a certain property in the tachogram x
i
.
Possible selection criteria are based on an increase
and decrease of a sample with respect to the previous
sample. The general definition of anchor points that
is used in this study, compares averages of a period of
T values of the tachogram:
1
T
T −1
∑
j=0
x
i+ j
>
1
T
T
∑
j=1
x
i− j
(1)
or
1
T
T −1
∑
j=0
x
i+ j
<
1
T
T
∑
j=1
x
i− j
(2)
The parameter T sets an upper frequency limit for
the periodicities that can be detected and functions as
a low pass filter. For T = 1, no filter is applied; all
increases or decreases in the signal are selected as an-
chor points. In Figure 1, all increase events are de-
fined as anchor points, according to Equation (1) with
T = 1.
In the second step, windows (surroundings) of
length 2L are defined around each anchor point. The
parameter L should exceed the period of the slowest
oscillation that is of interest.
Finally, the surroundings of all anchor points are
aligned to each other and the PRSA curve ¯x
k
is ob-
tained by averaging over all windows. With this av-
eraging procedure, non-periodic components that are
not in phase with the anchor points are cancelled out,
leaving only periodicities and quasi-periodicities that
have a fixed phase relationship with the anchor points.
In this work, the symbols PRSA
%
and PRSA
&
are
used to indicate PRSA curves based on increases or
decreases in the tachogram.
Figure 1: Illustration of the PRSA technique (Kantelhardt
et al., 2007). (a) Anchor points are selected, based on in-
creases in the tachogram; (b) windows are defined around
each anchor points; (c) all anchor points are moved on top
of each other, resulting in the alignment of all windows; (d)
the phase-rectified signal average ¯x
k
is obtained by averag-
ing over all windows.
The center of the PRSA curve ¯x
0
is the average
of the tachogram at all anchor points. The measures
BIOSIGNALS 2012 - International Conference on Bio-inspired Systems and Signal Processing
164

defined to quantify the curve, use this central point
as reference. Therefore, a recalibration step shifts the
curve such that the amplitude of ¯x
0
equals 0 ms.
3.2 Measures for Quantification of the
PRSA Curve
In ¯x
k
all periodicities are superposed; the central peak
of the PRSA curve contains the contributions from
all the (quasi-)periodicities of the original tachogram.
The deflection at the center of the PRSA curve de-
pends on the definition of anchor points. For Equation
(1), the central spike quantifies the average capacity
of the ANS to decelerate the heartbeat (deceleration
capacity DC). DC [ms] is calculated from four points
around the center of PRSA
%
, as shown in Figure 2 and
Equation (3), and proved its use as a better predictor
of mortality after myocardial infarction than other tra-
ditional HRV measures (Bauer et al., 2006a):
DC =
|
¯x
0
+ ¯x
1
− ¯x
−1
− ¯x
−2
|
/4 (3)
Figure 2: Illustration of the calculation of measure DC for
PRSA
%
and T = 1 for the tachogram of a random baby of
2 months old.
For the definition described in Equation (2), the
acceleration capacity (AC) is used to quantify the cen-
tral deflection of PRSA
&
.
Observation of the PRSA curves showed that the
curves of different babies not only differ from each
other in values for DC and AC. Also the amplitude,
oscillations and morphology for the whole curve vary
between different subjects. In this study, additional
measures are selected to describe the PRSA curve
as precisely as possible. In this way, differences in
curves between babies can be quantified and analyzed
to examine the link with the STAI score of the moth-
ers.
• Peak-to-peak: distance [samples] and difference
in amplitude [ms] between the first peak before
and the first peak after the center of the curve;
• Area-Under-Curve (AUC) [ms
2
]: area under the
PRSA curve ¯x
k
in the predefined intervals k =
[−20 : 0] and k = [0 : 20];
• Skewness [-]: measure for the lack of symmetry
of the distribution of the whole PRSA curve. Zero
skewness indicates a symmetry around the mean.
Positive or negative skewness indicates a right or
left tail, respectively.
• Excess kurtosis [-]: measure for the ‘peakedness’
of the distribution of the whole PRSA curve. Neg-
ative values indicate flatness, while positive val-
ues indicate a more peaked distribution.
3.3 Time Domain Measures of HRV
In addition to the analysis of the PRSA curves, some
traditional time domain measures for HRV are com-
puted (Task Force of The European Society of Cardi-
ology and The North American Society of Pacing and
Electrophysiology, 1996):
• SDNN [ms]: standard deviation of the RR inter-
vals. This measure indicates which cyclic compo-
nents are present during the recordings;
• RMSSD [ms]: root mean square of successive RR
differences. RMSSD is a measure of parasympa-
thetic modulation;
• pNN25 [%]: the percentage of RR interval differ-
ences that are greater than 25 ms. Like RMSSD,
pNN25 quantifies parasympathetic activity.
3.4 Statistical Analysis
The correlations between the STAI score of the moth-
ers and the PRSA and HRV measures for all infants,
are calculated using Spearman’s correlation coeffi-
cient. This method aims at detecting a monotonic
relation between two distributions. In order to in-
terpret and compare the defined PRSA measures, the
correlation between the PRSA measures and the time
domain HRV measures are computed as well. The
Wilcoxon rank sum test is used to compare the high
anxiety group and the low anxiety group. It is a non-
parametric test to check whether two data sets are
coming from the same distribution. The significance
level for rejecting the null hypothesis is p = 0.05.
4 RESULTS AND DISCUSSION
Four PRSA curves are obtained for each tachogram
for surroundings of length 2L = 100 samples, based
on the four definitions used in this study: anchor
points linked to both increases and decreases for both
T = 1 and T = 10. For each baby, the ECG was
recorded during five stimuli sequences. The PRSA
PHASE-RECTIFIED SIGNAL AVERAGING FOR THE QUANTIFICATION OF THE INFLUENCE OF PRENATAL
ANXIETY ON HEART RATE VARIABILITY OF BABIES
165
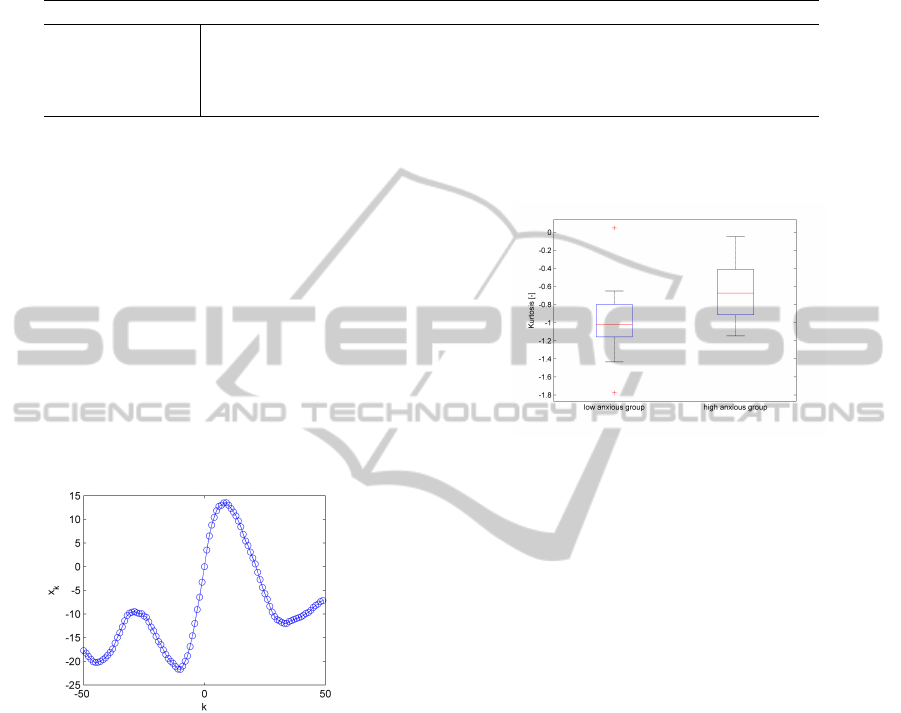
Table 1: Mean ± standard deviation of kurtosis for all PRSA curves, divided in three anxiety groups based on the STAI score
of the mother (low, moderate and high anxiety groups). n is the number of babies in the anxiety group; ρ is the Spearman
correlation coefficient and p is its corresponding p-value; p
L−H
is the resulting p-value for the comparison between babies of
low and highly anxious women.
Low (n = 21) Mod. (n = 41) High (n = 14) ρ p p
L−H
T = 1 PRSA
%
-0.50 ± 0.93 -0.23 ± 0.65 -0.16 ± 0.75 0.214 0.078 0.022
T = 1 PRSA
&
-0.76 ± 0.84 -0.40 ± 0.82 -0.47 ± 0.68 0.120 0.326 0.022
T = 10 PRSA
%
-1.03 ± 0.28 -0.61 ± 0.51 -0.66 ± 0.33 0.268 0.026 <0.001
T = 10 PRSA
&
-0.99 ± 0.41 -0.75 ± 0.41 -0.72 ± 0.41 0.186 0.127 0.034
measures calculated for the five ECG signals are av-
eraged for each baby.
As mentioned before, Figure 2 shows the PRSA
curve of one baby, based on anchor points linked to
all increase events in the tachogram (T = 1). Figure 3
shows the PRSA curve for the same baby, according
to T = 10. In this way, a much smoother PRSA curve
is obtained, compared to Figure 2. Also the absolute
values of the amplitudes of the positive peak for k >0
and negative peak for k <0 are higher. This is be-
cause the parameter T functions as a low pass filter,
only selecting anchor points by comparing series of T
samples. One sudden increase in a series of decrease
events will not be selected; only average increases in
the tachogram will give rise to anchor points.
Figure 3: PRSA
%
curve (T = 1) for the tachogram of a ran-
dom baby of 2 months old.
4.1 Influence of Prenatal Anxiety on
PRSA Measures of Babies
The defined PRSA measures are linked to the STAI
score to assess the influence of prenatal anxiety of the
pregnant women on the ANS of their babies. Signifi-
cant differences between the anxiety groups are only
found for the measure kurtosis for all four definitions
of PRSA curves. Table 1 shows all statistically sig-
nificant results. Babies with highly anxious mothers
show higher kurtosis (but still negative) than babies
with lowly anxious mothers. Kurtosis measures the
degree of peakedness of the probability distribution of
a variable. A distribution with negative kurtosis has a
wider peak and is said to be flat. The lowest p-value
(p
L−H
= 9, 58e
−4
) is found for the PRSA curve corre-
sponding to increases in the average of 10 consecutive
RR intervals (PRSA
%
and T = 10). The correspond-
ing boxplots are shown in Figure 4.
Figure 4: Boxplot for kurtosis [-] (PRSA
%
and T = 10).
Besides this result, some remarkable but statisti-
cally not significant results are also presented. DC
and AC quantify the central part of the PRSA curve
around increase and decrease events respectively. A
lower value for these two measures for babies of
highly anxious mothers was observed for all four
PRSA curves, though statistically not significant as
mentioned before. Lower values indicate a reduced
capacity of the ANS to quickly adjust the heartbeat.
One remark has to be made; the measure of anxi-
ety used in this study, is based on the state anxiety in
the first trimester of the pregnancy. This type of anx-
iety manifests itself as a transitory, emotional state.
The trait anxiety on the other hand, is a relatively sta-
ble aspect of the personality. By using this form of
anxiety to quantify the stress and anxiety level of the
mothers instead of the state anxiety measured at one
moment in time, the analysis of the effect of prenatal
anxiety on the babies might improve.
4.2 Link of PRSA with Time Domain
HRV Measures
In order to link the defined PRSA measures with the
traditional HRV measures, the correlations between
PRSA and some time domain HRV measures are
computed. All PRSA measures, except for skewness,
show significant correlations with SDNN, RMSSD
and pNN25. However, we will focus on the exist-
BIOSIGNALS 2012 - International Conference on Bio-inspired Systems and Signal Processing
166

Table 2: Spearman correlation coefficients between kurtosis
of the PRSA curves and the time domain HRV measures
(∗ : p < 0.05,† : p < 0.005,‡ : p < 0.001).
SDNN RMSSD pNN25
T = 1 PRSA
%
-0.006 0.328 † 0.390 ‡
T = 1 PRSA
&
-0.068 0.371 † 0.451 ‡
T = 10 PRSA
%
-0.015 0.170 0.214
T = 10 PRSA
&
0.097 0.279 ∗ 0.342 †
ing correlations of kurtosis of the PRSA curves as
this measure showed to differ significantly between
anxiety groups in the previous section and it is not
straightforward to interpret these differences. Table 2
shows the correlation coefficients between the kurto-
sis of the PRSA curves and the time domain measures.
Positive correlations are found between kurtosis and
RMSSD and pNN25. Both of these time domain
measures are linked with parasympathetic modula-
tion, suggesting that the kurtosis of the PRSA curves
might be related with the parasympathetic activity as
well. However, future research must focus on the link
between the defined PRSA measures and the ongo-
ing physiological processes. Nevertheless, we want
to stress that the defined PRSA measures are useful
as kurtosis is able to distinguish between the effect of
high and low anxiety during pregnancy on the ANS
of the babies. In our study this was not possible with
the traditional HRV measures.
5 CONCLUSIONS
Quasi-periodicities in the human heart rate reflect
the different regulation processes of the ANS. The
PRSA method is a suited technique for detection
of quasi-periodicities in non-stationary data like the
tachogram. Moreover, PRSA offers the possibility to
study the deceleration and acceleration capacity of the
heart, which might provide more insights into cardiac
autonomic regulation processes.
The influence of the stress and anxiety of pregnant
mothers, quantified by the STAI score, on the HRV
is investigated by evaluating the PRSA curves. Only
few significant results are found, all corresponding to
the kurtosis. Although kurtosis seems to differ signif-
icantly between babies with low and highly anxious
mothers, the interpretation of this measure is unclear.
The influence of the state anxiety of mothers on
the HRV of babies, using the PRSA technique, is
rather small. Nevertheless, PRSA is a promising sig-
nal processing tool for assessing information about
the capacity of the ANS to quickly adjust its heart
rate. A suggestion of further reseach has been made:
by using a different psychological measure for stress
and anxiety, better and more reliable results may be
found.
ACKNOWLEDGEMENTS
Research supported by:
• Research Council KUL: GOA MaNet;
• D. Widjaja and K. Vanderperren are supported by
an IWT PhD grant;
• Belgian Federal Science Policy Office: IUAP
P6/04 (DYSCO).
The scientific responsibility is assumed by its authors.
REFERENCES
Bauer, A., Kantelhardt, J. W., Barthel, P., Schneider, R.,
M
¨
akikallio, T., Ulm, K., Hnatkova, K., Sch
¨
omig, A.,
Huikuri, H., Bunde, A., et al. (2006a). Deceleration
capacity of heart rate as a predictor of mortality af-
ter myocardial infarction: cohort study. The Lancet,
367(9523):1674–1681.
Bauer, A., Kantelhardt, J. W., Bunde, A., Barthel,
P., Schneider, R., Malik, M., and Schmidt, G.
(2006b). Phase-rectified signal averaging detects
quasi-periodicities in non-stationary data. Physica A:
Statistical Mechanics and its Applications, 364:423–
434.
Kantelhardt, J. W., Bauer, A., Schumann, A. Y., Barthel,
P., Schneider, R., Malik, M., and Schmidt, G. (2007).
Phase-rectified signal averaging for the detection of
quasi-periodicities and the prediction of cardiovascu-
lar risk. Chaos: An Interdisciplinary Journal of Non-
linear Science, 17:015112.
O’Connor, T., Heron, J., Golding, J., and Glover, V. (2003).
Maternal antenatal anxiety and behavioural / emo-
tional problems in children: a test of a programming
hypothesis. Journal of Child Psychology and Psychi-
atry, 44(7):1025–1036.
Spielberger, C. D., Gorsuch, R. L., and Lushene, R. E.
(1983). State-trait anxiety inventory (STAI). Palo Alto
(CA): Mind Garden.
Taelman, J., Vandeput, S., Widjaja, D., Braeken, M. A.
K. A., Otte, R. A., Van den Bergh, B. R. H., and
Van Huffel, S. (2010). Stress during pregnancy: Is
the autonomic nervous system influenced by anxiety?
In Computing in Cardiology, pages 725–728. IEEE.
Task Force of The European Society of Cardiology and The
North American Society of Pacing and Electrophys-
iology (1996). Heart rate variability: Standards of
measurement, physiological interpretation, and clin-
ical use. Annals of Noninvasive Electrocardiology,
1(2):151–181.
Van den Bergh, B. and Marcoen, A. (2004). High antena-
tal maternal anxiety is related to ADHD symptoms,
externalizing problems, and anxiety in 8-and 9-year-
olds. Child Development, 75(4):1085–1097.
PHASE-RECTIFIED SIGNAL AVERAGING FOR THE QUANTIFICATION OF THE INFLUENCE OF PRENATAL
ANXIETY ON HEART RATE VARIABILITY OF BABIES
167

Van den Bergh, B., Mulder, E., Mennes, M., and Glover, V.
(2005). Antenatal maternal anxiety and stress and the
neurobehavioural development of the fetus and child:
links and possible mechanisms. A review. Neuro-
science and Biobehavioral Reviews, 29(2):237–258.
BIOSIGNALS 2012 - International Conference on Bio-inspired Systems and Signal Processing
168
