
PUBSEARCH
A Hierarchical Heuristic Scheme for Ranking Academic Search Results
Emanouil Amolochitis
1,2
, Ioannis T. Christou
1
and Zheng-Hua Tan
3
1
Athens Information Technology, 19Km Markopoulou Ave., PO Box 68, Paiania 19002, Greece
2
CTiF, Aalborg University, Aalborg, Denmark
3
Dept. of Electronic Systems, Aalborg University, Aalborg, Denmark
Keywords: Academic Search, Search and Retrieval, Heuristic Document Re-ranking.
Abstract: In this paper we present PubSearch, a meta-search engine system for academic publications. We have
designed a ranking algorithm consisting of a hierarchical set of heuristic models including term frequency,
depreciated citation count and a graph-based score for associations among paper index terms. We used our
algorithm to re-rank the default search results produced by online digital libraries such as ACM Portal in
response to specific user-submitted queries. The experimental results show that the ranking algorithm used
by our system can provide a more relevant ranking scheme compared to ACM Portal.
1 INTRODUCTION
In this paper, we introduce PubSearch, a meta-search
engine that uses a hierarchical ranking algorithm to
re-rank the search results produced by available
online digital libraries such as ACM Portal that
provide a consistent scheme for indexing academic
publications.
After examining a set of more than ten thousand
publications retrieved from ACM Portal we have
constructed a set of graphs representing different
types of associations among index terms. In the
constructed graphs we have identified maximal
weighted cliques that represent frequently-
appearing, strongly-related index terms. Our ranking
algorithm uses these graphs so as to identify the
matching degree of a publication’s index terms
against the formed cliques.
Our system uses a hierarchical three-level
ordering of the search results; each level orders the
results and then clusters them together into buckets
based on different properties examined at each level.
Every level in the hierarchy (except the top) re-ranks
the results contained in each bucket produced by its
immediate higher level and places them in finer-
grain buckets resulting in an alternative ranking
order at the end of the process.
2 RELATED WORK
CiteData (Harpale et al., 2010) addresses the
problem of lack of consistent datasets in the field of
personalized search for academic publications and
also shows that personalized search algorithms for
academic publications outperform non-personalized
methods.
In (Newman, 2001, 2004) the author shows that
different types of scientific networks reveal certain
collaboration patterns. Similarly in (Barabsi et al.,
2001) the authors examine a number of journals to
identify network evolution and topology as well as
patterns of co-authorship at specific points in time.
The authors in (Liben-Nowell, 2007) introduce an
approach that examines collaboration network
topology as well network member proximity in order
to predict the likelihood of future interactions.
In (Aljaber et al., 2009) the authors present a
publication representation scheme that attempts to
identify important index terms covered by journal
articles by identifying publication context by
examining relevant synonymous vocabulary.
The aforementioned methods reveal that
examining network structure and topology as well as
attempting to identify the presence of clusters in
such networks can provide useful background
knowledge that can be utilized in information
retrieval applications.
509
Amolochitis E., T. Christou I. and Tan Z. (2012).
PUBSEARCH - A Hierarchical Heuristic Scheme for Ranking Academic Search Results.
In Proceedings of the 1st International Conference on Pattern Recognition Applications and Methods, pages 509-514
DOI: 10.5220/0003704705090514
Copyright
c
SciTePress
3 SYSTEM DESIGN
3.1 System Architecture
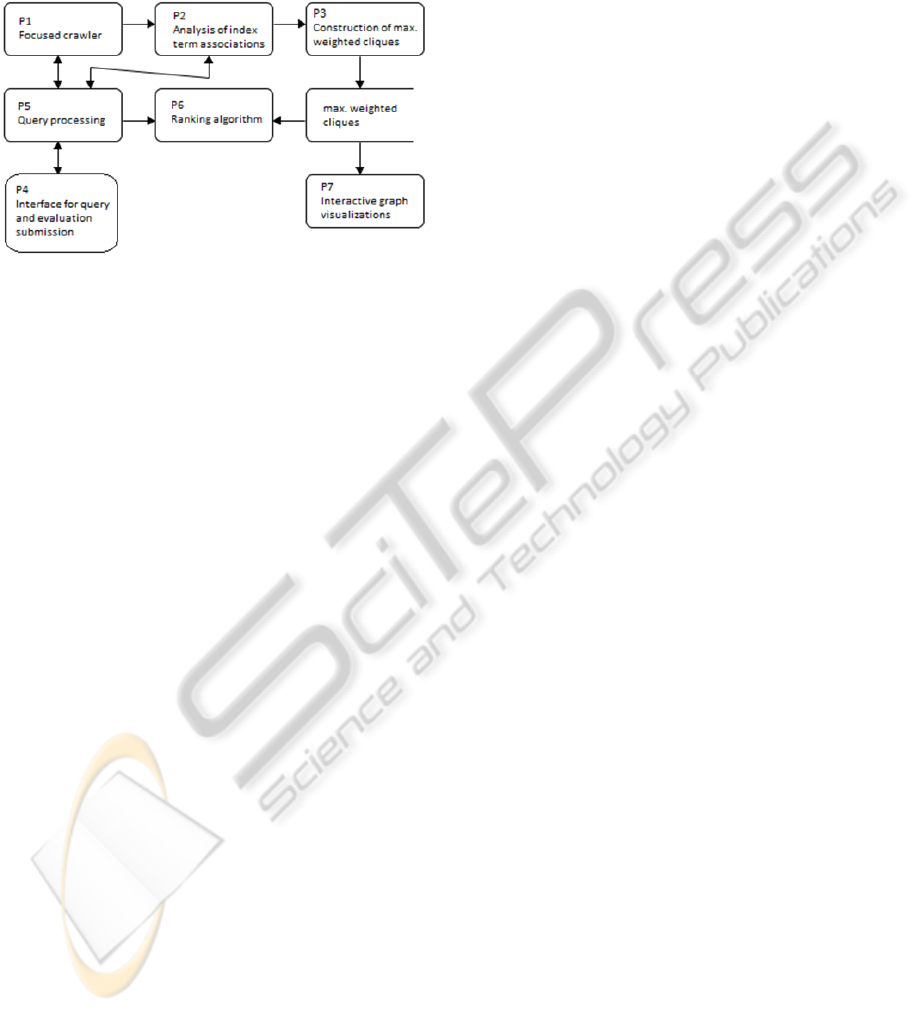
The system architecture is shown in Figure 1.
Figure 1: System Architecture.
P1 implements a focused crawler module that is
briefly discussed in the next sub-section (3.2) that
collects all required information for each publication
retrieved via ACM Portal. P2 analyzes the
information collected in P1 in order to construct a
set of weighted graphs representing associations
among index terms of different strength. Process P3
computes all maximal weighted cliques identified in
the graphs constructed in P2. We describe processes
P2 and P3 in section 3.3. The cliques represent the
likelihood that researchers involved in a field
characterized by a subset of the index terms in a
clique might also be interested in other index terms
of the clique as well. P7 provides a component for
visualizing the maximal weighted cliques identified
in P3. Processes P4, P5 and P6 implement a meta-
search engine application that allows the evaluation
of our ranking algorithm. The system provides a
search interface so that users submit queries related
to areas of their expertise. The queries are initially
queued and later re-submitted to ACM Portal in
order to retrieve the default top 10 results produced
by the latter as well as the original ranking order.
The users also provide feedback evaluations on the
quality and relevance of the results’ ranking that
allows the comparison of the two different ranking
approaches.
3.2 Focused Crawler
We have developed a module that extracted all
publication information for approximately 10000
papers of 15457 authors available in ACM Portal,
including index terms, authors, abstract and
publication date.
3.3 Graph Model
Based on the collected papers, we constructed
different types of graphs representing different types
of associations among index terms.
In a Type I graph, two index terms t1 and t2 are
connected by an edge (t1, t2) with weight w if and
only if there are exactly w papers in the collection
indexed under both index terms t1 and t2. Type I
graph represents the strongest type of association of
a pair of index terms; the fact that both terms appear
together in the same paper reveals a strong affinity
among the topics in the area of interest of the
particular paper.
In a Type II graph, two index terms t1 and t2 are
connected by an edge (t1, t2) with weight w if and
only if there are w distinct authors that have
published at least one paper where t1 appears but not
t2 and also at least one paper where t2 appears but
not t1. Type II graph represents the second strongest
type of association and reveals a relation among the
index terms in the general area of interest of a
specific researcher, thus the association.
3.3.1 Maximal Weighted Cliques
In order to examine the strongest types of index term
associations as well as their evolution in the time
dimension we have constructed a set of graphs of the
above mentioned different types for a set of different
5-year periods. Graphs representing more recent
periods are considered as more relevant when
compared to older graphs. Similarly graphs
representing type I associations are more important
than type II. For each of the aforementioned graphs,
our system computes all maximal weighted cliques
for each graph, where we define a maximal clique of
minimum weight w
0
in the graph G to be any
maximal clique c so that for each pair of nodes v
1
&
v
2
in V there is an (undirected) arc e=(v
1
,v
2
) with
weight w
e
≥w
0.
. Computing all cliques in a graph is
an intractable problem (Garey and Johnson, 1979)
both in time and in space complexity, but in our
case, the constructed graphs are of very reasonable
size limited to around 300 nodes (total number of
index terms as specified by the ACM Classification
scheme) in each of the graphs. Furthermore our
algorithms take into consideration only the strongest
of edges (whose weight exceeds a certain threshold).
Given these restrictions, we implemented a recursive
algorithm following (Bron and Kerbosch, 1973) that
computes all maximally weighted cliques for all
graphs in our databases in less than 5 minutes of
CPU time.
ICPRAM 2012 - International Conference on Pattern Recognition Applications and Methods
510
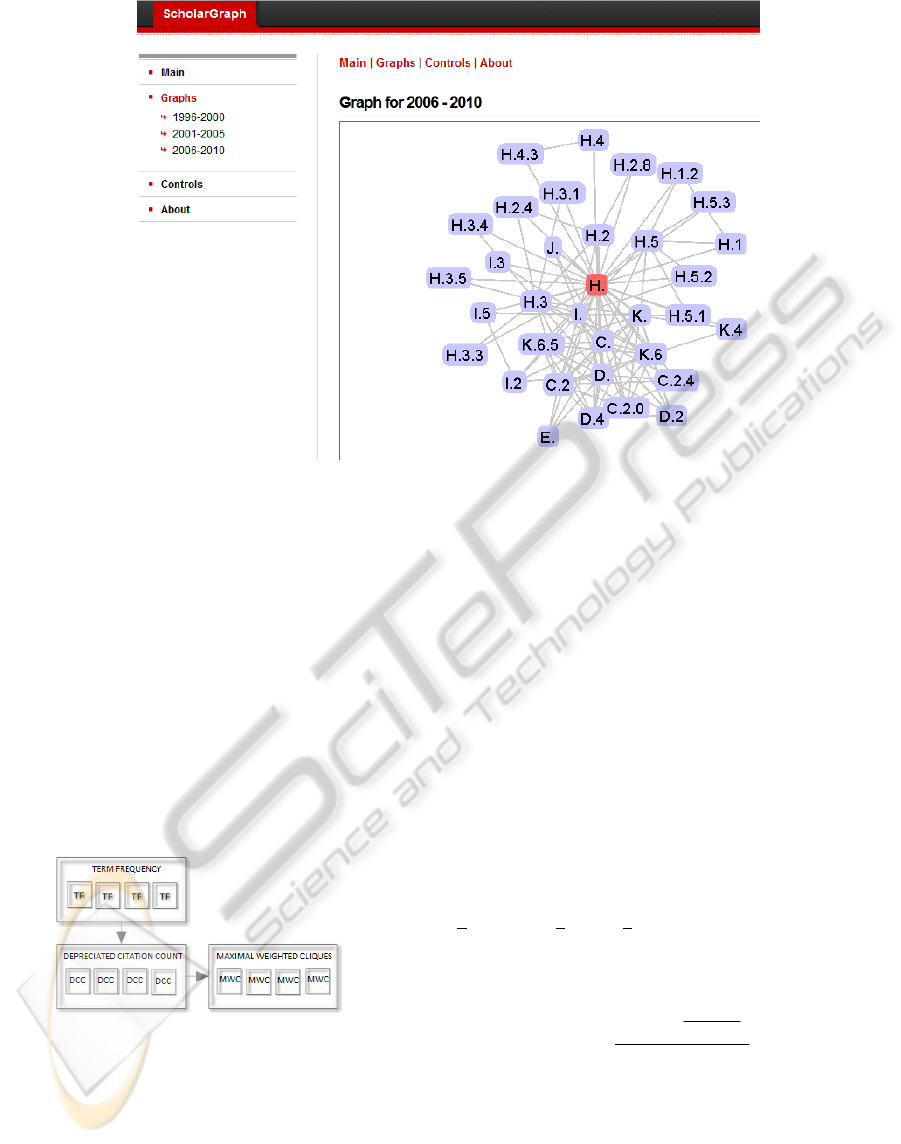
Figure 2: Interactive Graph Visualization.
In order to visualize the strongest maximal
weighted cliques in the constructed graphs we used
Prefuse’s Information Visualization Toolkit (Heer et
al., 2005). These visualizations allow for an
interactive view of the most important types of
associations among strongly connected index terms
of interest.
A visualization of type I graphs is shown in
Figure 2 (http://hermes.ait.gr/scholarGraph/index).
3.4 Ranking Heuristic Hierarchy
The hierarchy of heuristics is shown in Figure 3.
Figure 3: Heuristic Hierarchy.
Initially the algorithm calculates the total term
frequency of all query terms appearing in each
publication result and normalizes the term frequency
value by dividing over the total number of terms of
the particular publication. The algorithm then
clusters together all results based on their TF score
into buckets of specific range (that is automatically
learned in a training phase of the system).
For each set of results that fall inside any given
TF bucket range, the algorithm performs another re-
ordering of these results, this time using as criterion
a depreciated citation count score. In principle, we
want to promote high impact recent publications at
the expense of older publications that may have
higher overall citation count but could be considered
as outdated. For this purpose we have introduced a
depreciated citation count formula that is defined as
a function of a publication’s citation count
depreciated by the years passed since its publication
date.
In this level therefore, the results within each TF
bucket (from the previous step) are ordered and
clustered together into new finer-grain buckets
(called DCC buckets) of specified range (also
learned during the training phase), according to a
d
epreciated citation count score, calculated for each
paper using the following formulae:
pppcnd
=
(1)
10
1tanh( )
4
1
2
p
p
y
d
−
+
=−
(2)
Where n
p
is the number of citations for the
specific paper p according to Google Scholar, y
p
is
the number of years passed since the publication of
the paper p, and c
p
is the (time-depreciated) citation-
based score for p.
After the second-level clustering of the results
completes, we perform a final ordering of the results
PUBSEARCH - A Hierarchical Heuristic Scheme for Ranking Academic Search Results
511

within each DCC bucket by calculating the degree of
matching of each result’s index terms with the
maximal weighted cliques of all constructed graphs.
The calculation details are as follows.
Let C be the set of all cliques to examine. Let c
i
denote the total number of index terms in clique i.
Let d denote the total number of index terms of
publication p and p
i
denote the total number of index
terms of publication p that belong to clique i; for
each clique
iC∈ the system calculates the
matching degree of all publication index terms with
those of a clique. In cases of a perfect match
(meaning that all index terms of i appear as index
terms of p) in order to avoid bias towards
publications with a big number of index terms
against cliques with a small number of index terms
we calculate the percentage match
i
m as follows:
i
i
c
m
d
=
(3)
For all remaining cases (non-perfect match) the
percentage matching is calculated using:
i
i
i
p
m
c
=
(4)
If
i
mt> where t is a configurable threshold for
the accepted matching level (in our case t = 0.75) the
process continues, else the system stops processing
the current clique and moves to the next one. In case
that the matching level is above t the system
calculates a weight score w
p,i
representing the overall
value of the association of p with c
i
as follows:
,pi i
ii
wwmesac×=××
(5)
where
iw is the weight score of the examined
maximal weighted clique i, and
i
ac is a score
related to the association type that the current graph
that the current clique belongs to represents (
1
i
ac
=
for association type I,
0.6
i
ac
=
for type II). Finally,
es is an exponential smoothing factor that
depreciates cliques of graphs covering older periods
in order to promote more recent ones. Since each
type of graph has a different significance, we
consider recent graphs of stronger association types
as more significant and thus we assign greater value
to maximal weighted cliques of such graphs.
The algorithm calculates for each publication a
total clique matching score S
p
which corresponds to
the sum of matching score of the publication’s index
terms with all maximal weighted cliques and
determines the final ranking of the results
accordingly.
,
p
i
p
iC
Sw
∈
=
∑
(6)
4 EXPERIMENTS DESIGN
In order to evaluate our ranking algorithm’s
accuracy we developed a meta-search engine
application that provides a user interface allowing
users to submit queries as in an ordinary search
engine. A number of researchers from different
computer science and electrical engineering
disciplines were asked to submit a number of queries
related to their area of expertise and for consistency
reasons all queries processed consisted of two-to-
four words, with the optional use of quotes for
specifying specific keyword sequences. Also since
we need to be able to identify specific users
registration is required. All submitted user queries
are re-submitted to ACM Portal by our system and
the default top ten results as well as all related
publication information is extracted. The default
ranking order produced by ACM Portal is saved for
later comparison with the order suggested by our
own ranking algorithm. The system also attempts to
retrieve the full publication text (to be processed
later for calculating the query term frequency score)
in addition to the total number of citations via
Google Scholar.
When all required data are collected, our ranking
algorithm executes and generates an alternative
ranking scheme for the default ten results provided
by ACM Portal. When this process completes the
user is asked to provide relevance feedback (1 to 5
score where 1 stands for “least relevant” and 5
stands for “most relevant”) for the default top ten
results produced by ACM portal. Since both systems
attempt to re-rank the same set of results we use the
same feedback score to evaluate both ranking
algorithms. The total feedback score
s(q) for each
submitted query q is calculated as the sum of
feedback scores for each publication p in the result
set using lexicographic ordering:
1
() 2 ( )
n
ni
i
i
s
qfp
−
=
=
∑
(7)
where
n is the number of results and f(p
i
) —
normalized in [0,1] — is the relevance feedback
provided by the user for the publication
p
i
appearing
in position
i in the list of results. This evaluation
scheme reflects the importance that users place in
ICPRAM 2012 - International Conference on Pattern Recognition Applications and Methods
512
1000
1500
2000
2500
3000
3500
4000
4500
5000
5500
1 2 3 4 5 6 7 8 9 101112131415161718192021222324252627282930313233
Pub/Search
including max.weighted cliques
PubSearch
excluding max.weighted cliques
ACM Portal
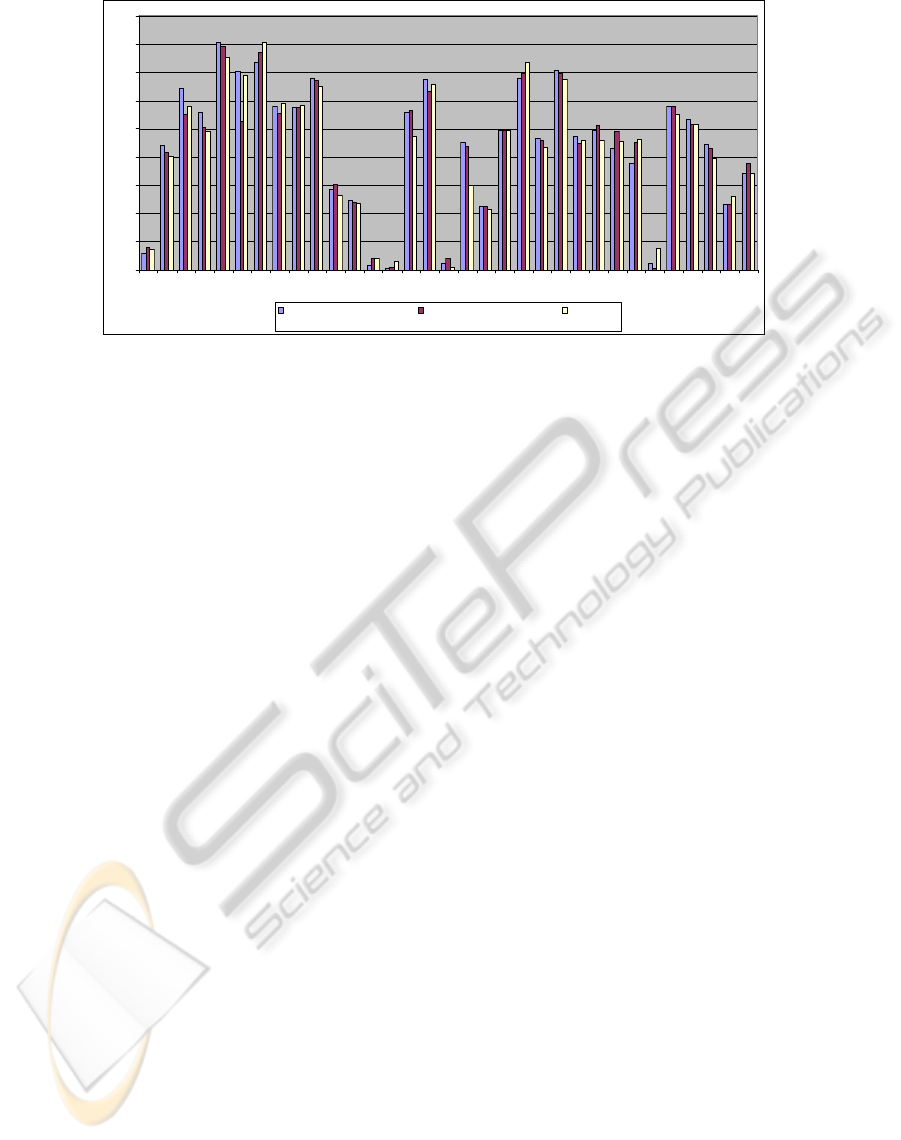
Figure 4: Computational results.
the top search results as opposed to results lower in
the ranking hierarchy and allows for determining as
the strongest ranking scheme the one that received
higher scores for the publication results in the
highest position regardless of the score received for
results in lower positions in the results list.
5 COMPUTATIONAL RESULTS
In an initial training phase, five volunteer users
(research scientists in the fields of computer science
and electrical engineering) submitted 12 queries in
total and provided feedback evaluations on the
ranking quality of the results. The training phase
resulted in a fine-tuning of the bucket ranges of each
of the three heuristics in the heuristic hierarchy of
our scheme.
We used another set of 33 queries from 12
different experts in computer science and electrical
engineering to measure the effectiveness of the
proposed re-ranking algorithm.
As it turns out,
PubSearch compares well with
ACM Portal, and in fact outperforms ACM Portal
in
20 out of 33 query instances, sometimes by
significant margin. In Fig. 4,
we compare the results
of ACM Portal against PubSearch with and without
the third and last heuristic in the hierarchy enabled
;
as it can be seen from the figure, the max. weighted
cliques heuristic improves the performance of
PubSearch in 20 out of the 33 queries in total as
well.
6 CONCLUSIONS AND FUTURE
DIRECTIONS
The results indicate that the traditional information
retrieval metrics based on term frequency are
insufficient to determine accurately the relevance of
a specific publication with respect to a specific
query. On the other hand, term frequency along with
time-depreciated citation count is a good criterion
for the overall current value of a paper that
combined with the final clique score provides an
even improved indication about value to papers of
similar or interdisciplinary nature.
REFERENCES
Aljaber, B., Stokes, N., Bailey, J., Pei, J., 2009. Document
clustering of scientific texts using citation contexts.
Journal of Information Retrieval, 13(2), pp. 101-131.
Barabsi, A., Jeong, H., Ned, Z., Ravasz, E., Schubert, A.,
Vicsek, T., 2001. Evolution of the social network of
scientific collaborations. Physica A: Statistical
Mechanics and its Applications, 311 (3-4), 590-614.
Bron, C., Kerbosch, J., 1973. Algorithm 457: finding all
cliques of an undirected graph. Communications of the
ACM, 16(9), pp 575-577.
Garey, M R., Johnson, D S., 1979. Computers and
intractability: A guide to the theory of NP-
Completeness. Freeman, San Francisco, CA.
Harpale, A., Yang, Y., Gopal, S., He, D., Yue, Z., 2010.
CiteData: A new multi-faceted dataset for evaluating
personalized search performance. In: Proc. ACM
Conf. on Information & Knowledge Management
CIKM 10, Oct. 26-30, 2010, Toronto, Canada.
Heer, J., Card, S., Landay, J. 2005. Prefuse: a toolkit for
interactive information visualization. In: Proc.
SIGCHI conference on Human factors in computing
systems.
PUBSEARCH - A Hierarchical Heuristic Scheme for Ranking Academic Search Results
513

Newman, M., 2001. The structure of scientific
collaboration networks. In: Proc. National Academy of
Sciences USA, 98, 404-409.
Newman, M., 2004. Coauthorship Networks and Patterns
of Scientific Collaboration. In: Proc. National
Academy of Sciences USA, 101, 5200-5205
Samudrala, R., Moult, J., 1998. A graph-theoretic
algorithm for comparative modeling of protein
structure. Journal of Molecular Biology, 279(1), pp.
287-302.
ICPRAM 2012 - International Conference on Pattern Recognition Applications and Methods
514
