
ADAPTATION AND ENHANCEMENT OF EVALUATION
MEASURES TO OVERLAPPING GRAPH CLUSTERINGS
Tatiana Gossen, Michael Kotzyba and Andreas N
¨
urnberger
Data and Knowledge Engineering Group, Faculty of Computer Science, Otto-von-Guericke-University Magdeburg
D-39106 Magdeburg, Germany
Keywords:
Evaluation measures, Overlapping graph clustering, Clustered graph, Graph generation model.
Abstract:
Quality measures are important to evaluate graph clustering algorithms by providing a means to assess the
quality of a derived cluster structure. In this paper, we focus on overlapping graph structures, as many real-
world networks have a structure of highly overlapping cohesive groups. We propose three methods to adapt
existing crisp quality measures such that they can handle graph overlaps correctly, but also ensure that their
properties for the evaluation of crisp graph clusterings are preserved when assessing a crisp cluster structure.
We demonstrate our methods on such measures as Density, Newman’s modularity and Conductance. We
also propose an enhancement of an existing modularity measure for networks with overlapping structure.
The newly proposed measures are analysed using experiments on artificial graphs that possess overlapping
structure. For this evaluation, we apply a graph generation model that creates clustered graphs with overlaps
that are similar to real-world networks i.e. their node degree and cluster size distribution follow a power law.
1 INTRODUCTION
Many information spaces from different domains, e.g.
life sciences or social sciences, can be modeled in
form of graphs or networks. Information concepts or
entities represent the nodes of a graph and a pair of
nodes has an edge if there is a relationship between
corresponding entities (Palla et al., 2005). During the
last years many graph based models have been created
and analysed, describing e.g. social networks like ac-
quaintance and collaboration networks, technological
networks like the Internet, the Worldwide Web and
power grid networks, biological networks like neural
networks, food webs, and metabolic networks (Girvan
and Newman, 2002).
One major task while analysing graphs is to find
groups of strongly connected entities that form some
kind of cluster. In other words, there exist groups of
graph nodes that are more densely connected within
the group than to the rest of the graph. Thus, the graph
can be seen as a set of such groups also called struc-
tural sub-units, communities or clusters (Girvan and
Newman, 2002). These clusters correspond to func-
tional units of the underlying systems.
Many data mining algorithms have been proposed
to find these units. However, the majority of them
provide only separate or “hard” clusterings (partition
of the graph nodes into clusters) with pairwise dis-
joint clusters (crisp clusters). Unfortunately in prac-
tice many structural sub-units are highly overlapping
cohesive groups (Ahn et al., 2010; L
´
az
´
ar et al., 2010).
As an example from the biological domain, in the
protein complex network a large fraction of proteins
belong to several protein complexes simultaneously
(Gavin et al., 2002; Palla et al., 2005).
For each graph a huge amount of partitions into
sub-units can be found. However, the task is to find
a meaningful one. Depending on the requirements
for the clustering e.g. how important dense or sep-
arated clusters are, the meaningful partitions may dif-
fer in structure. In order to evaluate the specific clus-
tering structure quality measures or indices are re-
quired. To tackle this issue several quality measures
for crisp graph clusterings have been introduced e.g.
coverage, performance, intra- and inter-cluster con-
ductance (Brandes et al., 2003; Brandes and Erlebach,
2005), modularity (Newman and Girvan, 2004), and
density (Delling et al., 2006). Each index assesses
different clustering properties and can be chosen de-
pending on the specific requirements.
As most of the graph algorithms focus on finding
a crisp structure, existing measures are optimized to
evaluate the quality of such crisp clusterings. To our
knowledge, there are too few measures for graph clus-
5
Gossen T., Kotzyba M. and Nürnberger A. (2012).
ADAPTATION AND ENHANCEMENT OF EVALUATION MEASURES TO OVERLAPPING GRAPH CLUSTERINGS.
In Proceedings of the 1st International Conference on Pattern Recognition Applications and Methods, pages 5-14
DOI: 10.5220/0003706400050014
Copyright
c
SciTePress

terings with overlaps. So far only one index to mea-
sure networks with overlapping communities M
ov
was
proposed (L
´
az
´
ar et al., 2010). Thus, it is important to
provide new measures for overlapping graph cluster-
ings to be able to evaluate different cluster structure
properties.
In order to do this we can use the existing mea-
sures for crisp clusterings and adapt them such that
they can handle overlaps correctly. In this paper we
therefore propose extensions of crisp quality mea-
sures to be able handling the graph overlaps correctly
and still remain their original properties. The struc-
ture of this paper is as follows. Sect. 2 gives an
overview of research that is related to this paper. Sect.
3 introduces the formal concepts we use in the re-
mainder of the paper. We present our main ideas for
the adaptation of existing crisp evaluation measures
to handle the overlapping graph clustering and en-
hancement of overlapping measure M
ov
in Sect. 4.
In Sect. 5 and 6 we describe a model to generate clus-
tered graphs and experiments with synthetic clustered
graphs using the evaluation measures. We conclude
and give directions for future work in Sect. 7.
2 RELATED WORK
We can subdivide related research work into three cat-
egories: algorithms for graph clustering, quality mea-
sures for graph clustering and generation models for
clustered graphs.
Algorithms for Graph Clustering. A good overview
of graph clustering algorithms is given by Schaeffer
(Schaeffer, 2007) and Fortunato (Fortunato, 2010).
There are many algorithms for crisp graph cluster-
ings. One of the most prominent approaches is to re-
peatedly decompose the graph structure into sub-units
by removing edges with the highest betweenness until
the network becomes disconnected (hierarchical top-
down algorithm by Girvan and Newman (Girvan and
Newman, 2002)).
In order to uncover clusterings with overlaps a
set of algorithms for overlapping clusterings has been
introduced, e.g. the LA − IS
2
two step algorithm
(Baumes et al., 2005), the CONGA algorithm (Gre-
gory, 2007) that extends Girvan and Newman’s algo-
rithm (Girvan and Newman, 2002), the clique per-
colation algorithm (Palla et al., 2005) implemented
in CFinder (Adamcsek et al., 2006), and the single-
linkage agglomerative hierarchical algorithm which
clusters graph links with proposed similarity measure
between link groups based on their neighbourhood
(Ahn et al., 2010).
Besides crisp and overlapping graph clustering
there are also fuzzy clustering methods and measures
which search for fuzzy structure in graphs (Nepusz
et al., 2008; Nicosia et al., 2009). In this case each
vertex of the graph may belong to multiple commu-
nities at the same time and its membership is deter-
mined by a numerical membership degree. However,
the fuzzy approach for graph clustering is not widely
used (Schaeffer, 2007).
Quality Measures. After a clustering is obtained one
can apply quality measures to evaluate how well the
chosen algorithm worked or to compare the results
produced by different clustering algorithms. One
can distinguish between unsupervised and supervised
quality measures (Tan et al., 2006). Supervised mea-
sures (also called external indices) require external
information about the expected cluster structure and
compare it to the structure found by the algorithm to
assess the clustering quality. An example of an exter-
nal measure is the F-measure (Gregory, 2007). Unsu-
pervised measures (also called internal indices) eval-
uate the quality of a clustering structure without con-
sidering any external information. They assess how
well separated the clusters are (inter-cluster sparsity)
and how dense the graph nodes are connected within
the clusters (intra-cluster density). Internal indices
for crisp graph clusterings are coverage, performance,
intra- and inter-cluster conductance (Brandes et al.,
2003), modularity (Newman and Girvan, 2004) and
density (Delling et al., 2006). L
´
az
´
ar (L
´
az
´
ar et al.,
2010) proposed a modularity measure for networks
with overlapping communities M
ov
. In this paper we
concentrate on internal indices. Note that the internal
quality indices are used not only for the evaluation of
clusterings but also within the clustering algorithm as
a fitness function (Schaeffer, 2007).
Generation Models for Clustered Graphs. In or-
der to evaluate clustering algorithms and to analyse
the behaviour of different quality indices, clustered
graphs with different properties are required. There-
fore different models to create clustered graphs have
been proposed. These are models to generate different
classes of graphs e.g. unweighted and weighted, undi-
rected and directed, uniform random graphs, multi-
graphs and bipartite graphs with desirable cluster
properties e.g. connectivity and density. An overview
of generation models for graphs and graphs with
clustering structure is given in (Schaeffer, 2007) and
(Chakrabarti et al., 2010). A description of genera-
tion models for crisp clustered (unweighted and undi-
rected) graphs can be found in (Girvan and Newman,
2002; Newman and Girvan, 2004). Gregory (Gregory,
2007) extends the generation model of crisp clustered
graphs to produce clustered graphs with overlaps. The
authors in (Lancichinetti and Radicchi, 2008) gener-
ICPRAM 2012 - International Conference on Pattern Recognition Applications and Methods
6

alised the method by Girvan and Newman stressing
that the distributions of node degrees and of commu-
nity sizes in real networks are heterogeneous. Their
model enables variation of the cluster sizes and non-
trivial degree distributions.
3 PRELIMINARIES
In this paper we focus on undirected unweighted
graphs. However, the approaches discussed in the
next section could be also applied to directed and/or
weighted graphs. Let G = (V,E) be such a graph with
a non-empty set of nodes V and a set of edges E. d(v)
or |neigh(v)| is the number of nodes adjacent to the
node v. A clustering ζ(G) = {C
1
,...,C
k
} is a parti-
tion of all nodes into k clusters C
i
, where C
i
⊆ V is a
non-empty subset of nodes, i.e. each node belongs to
at least one cluster. C(v) denotes the set of all clus-
ters that contain the node v. A cut ξ is a partition of a
vertex set V of a graph G into two non-empty subsets
(C
1
,C
2
), i.e. C
1
= V \C
2
.
The set of all edges between clusters C
i
and C
j
is
E(C
i
,C
j
), where i 6= j. E(C
i
) = E(C
i
,C
i
) is the set
of edges within the cluster C
i
. They have their origin
and destination in C
i
. E(ζ) := ∪
k
i=1
E(C
i
) is the set of
intra-cluster edges and E(ζ) := E \ E(ζ) is the set of
inter-cluster edges. The set of edges that are incident
to any node in a cluster C is denoted by E
inc
(C) (edges
incident to C). We say that an edge is an overlapping
edge if both its incident nodes are in the same overlap
of two or more clusters (see Figure 1). Let m be the
number of graph edges and n the number of graph
nodes. The maximum possible number of edges is
denoted by E
max
:
E
max
(G) =
n(n − 1)
2
(1)
A quality measure is defined as a function index(ζ) →
R that assigns a real value, usually index(ζ) ∈ [0,1],
to a given clustering ζ(G) (Brandes and Erlebach,
2005).
4 ADAPTATION OF EXISTING
MEASURES
In this section we discuss three major ideas how to
adapt the existing crisp evaluation measures to handle
graph clusterings with overlaps:
1. in a direct way, i.e. by incorporating a component
that evaluates the quality of overlapping parts.
Figure 1: Graph clustering ζ = {C
1
,C
2
} has an overlapping
edge {4,5}. The set of incident edges for the cluster C
1
is
E
inc
(C1) = E(C1) ∪ {{4, 6},{4,7},{5,6}, {5,7}}
2. by incorporation of edge weights so that over-
lapping edges have a lower weight than non-
overlapping ones.
3. in an indirect way, i.e. depending on the extended
measure and its criteria, one has to decide how the
overlapping parts are handled.
We also propose an enhancement of the overlapping
measure M
ov
.
Direct Way. A quality measure usually exploits two
functions to evaluate the clustering “goodness”: intra-
cluster density f and inter-cluster sparsity g. These
functions are combined as index( f (ζ),g(ζ)) → R
e.g.:
index(ζ) = f (ζ) + g(ζ) (2)
Given a clustering with overlaps we introduce a
third function h(ζ) for the assessment of the overlaps’
“goodness”. Therefore, we measure the complement
of the overlap size ratio (COR) to evaluate the size of
overlapping parts and the membership of the overlap-
ping nodes (OVM) to measure the overlaps’ quality.
One intuitive assumption we make is that a good
clustering should not have too many overlapping
nodes. This, of course, is dependent on the applica-
tion and could be changed on demand. Given OV as
the set of nodes in overlaps we assess the overlap size
as:
COR(ζ) = 1 −
|OV |
|V |
(3)
The second assumption is that good-quality overlaps
should only contain nodes which have a strong mem-
bership to all the clusters they belong to. The mem-
bership of the overlapping nodes is calculated as fol-
lows:
OV M(ζ) =
1
|OV |
∑
v∈OV
1
|C(v)|
∑
C∈C(v)
LD(C, v)
(4)
where LD(C, v) is a link density of a node v in a clus-
ter C and the following holds:
ADAPTATION AND ENHANCEMENT OF EVALUATION MEASURES TO OVERLAPPING GRAPH
CLUSTERINGS
7

aa
LD(C, v) :=
(
|C ∩ neigh(v)|
|C|−1
, if |C| > 1
0, otherwise
(5)
For each overlapping node we calculate the number of
connections to the nodes in its corresponding clusters.
Both functions OV S and OV M return values in the in-
terval [0,1]. We calculate the overlaps’ “goodness” as
h(ζ) ∈ [0,1]:
h(ζ) = ω
s
·COR(ζ) + ω
m
· OV M(ζ), (6)
where ω
s
> 0,ω
m
> 0 and ω
s
+ ω
m
= 1 (7)
ω
s
and ω
m
are used as weighting parameters to influ-
ence the importance of overlap size and membership.
To demonstrate the idea of the direct way to adapt the
existing crisp evaluation measure we employ the den-
sity quality index proposed in (Delling et al., 2006):
Density(ζ) :=
1
2
1
k
∑
C∈ζ
|E(C)|
E
max
(C)
| {z }
f (ζ)
+
1
2
1 −
|E(ζ)|
E
max
−
∑
C∈ζ
E
max
(C)
| {z }
g(ζ)
(8)
We extend the notion of density to handle the graph
clusterings with overlaps by the function h(ζ):
Density
OV
(ζ) := ω
f
· f (ζ) + ω
g
· g(ζ)+
ω
o
·
ω
s
·COR(ζ) + ω
m
· OV M(ζ)
| {z }
h(ζ)
(9)
where ω
f
, ω
g
and ω
o
are positive weighting param-
eters and their sum is equal to 1. Thus, Density
OV
∈
[0,1]. If |OV | = 0, then ω
o
= 0 and Density
OV
(ζ) =
Density(ζ), with ω
f
= ω
g
=
1
2
.
Incorporation of Edge Weights. Our second sug-
gestion for adaptation of the existing crisp evaluation
measures follows from the argument that the inaccu-
racies that occur when we apply crisp measures to
clusterings with overlaps occur due to multiple count-
ing of overlapping edges. Some measures e.g. New-
man’s modularity assess the quality of each cluster
separately and sums the values. If applying the mod-
ularity to overlapping clustering directly, the overlap-
ping edges would contribute to the index value several
times. This results in larger values (e.g. see Figure 2).
To solve this problem we redefine the edge weighting,
given an edge e = {u,v}, as follows:
ϖ
E
(e) :=
(
1,if e ∈ E(ζ),
1
|C(u)∩C(v)|
,otherwise
(10)
Figure 2: The graph clustering ζ = {C
1
=
{1,. .., 6, 7, ...,12}, C
2
= {1,.. .,6, 13,. .., 18},
C
3
= {1,..., 6, 19,..., 24}, C
4
= {1,..., 6, 25,..., 30},
C
5
= {1,... ,6, 31,. .., 36}, C
6
= {1,... ,6, 37,. .., 42}} has
a modularity value Q ≈ 1.04455. Newman’s modularity,
given a crisp clustered, undirected and unweighted graph,
has an interval range of [−
1
2
,1] (Brandes et al., 2007).
Thus, intra-cluster edges that belong to only one
cluster and all inter-cluster edges have a weight 1.
Intra-cluster edges that belong to multiple clusters are
weighted accordingly lower.
In the following we illustrate the idea of edge
weight incorporation using modularity and density as
examples. Newman’s modularity is defined in the fol-
lowing way (Newman and Girvan, 2004):
Q(ζ) :=
∑
i
(ψ
i,i
− a
2
i
) (11)
ψ
i,i
=
|E(C
i
)|
m
(12)
a
i
=
|E
inc
(C
i
)|
m
(13)
Using our approach we introduce the modified modu-
larity:
Q
ov
(ζ) :=
∑
i
(ψ
ov
i,i
− (a
ov
i
)
2
) =
∑
C∈ζ
1
m
∑
e∈E(C)
ϖ
E
(e) −
1
m
∑
e∈E
inc
(C)
ϖ
E
(e)
!
2
(14)
Given a clustering with overlaps, edges incident to a
cluster C could be also intra-cluster edges of other
clusters. An overlapping clustering with a relatively
high intra-cluster density has a larger value of (a
ov
)
2
(than a crisp clustering) which results in a decrease of
ICPRAM 2012 - International Conference on Pattern Recognition Applications and Methods
8

Q
ov
. Therefore, our modularity is modified to assess
clusterings with overlaps but still prefers fully sepa-
rated clusters.
Q
ov
achieves its theoretical maximum if all the
clusters are disconnected and have their maximum
density. Q
ov
achieves its theoretical minimum if,
given a graph in form of a single edge, k clusters are
distributed over each node: k(
0
m
− (
1
m
)
2
) = −k. Thus,
we have −∞ < Q
ov
< 1.
We can also further adjust the Density
OV
by incor-
poration of edge weights. The intra-cluster density
f (ζ) remains unchanged as the ratio of intra-cluster
edges of a cluster to the maximum possible number
of edges in the cluster is independent of whether the
cluster nodes are overlapping or not. We modify the
inter-cluster sparsity g(ζ):
e
g(ζ) = 1 −
E(ζ)
E
max
−
∑
C∈ζ
∑
e∈E(K
|C|
(C))
ϖ
E
(e)
(15)
where K
|C|
(C)) = (C,(C × C)) is a complete graph
that consists of the nodes in the cluster C and all pos-
sible connections between them.
^
Density
ov
(ζ) := ω
f
· f (ζ) + ω
g
·
e
g(ζ) + ω
o
· h(ζ)
(16)
Indirect Way. There are quality measures which as-
sess the quality of each cluster separately and then use
the obtained values to calculate the “goodness” of the
whole clustering. A good quality cluster should not
only be dense inside, but also have a low degree of
connectivity to other clusters. Thus, the quality of the
cut between each cluster and the rest of the graph is
important.
In the case of graph clustering with overlaps a
question arises about how to produce a cut. There
are actually three possible ways:
1. Include the overlapping nodes in the observed
cluster and exclude them from the rest of the
graph.
2. Include the overlapping nodes in the observed
cluster and consider them also as belonging to the
rest of the graph.
3. Exclude the overlapping nodes from the observed
cluster and include them in the rest of the graph.
Thus, e.g. using Figure 2, observing cluster C
1
and
considering the first way, the cut ξ(C
1
,V \C
1
) is (C
1
=
{1,..., 6, 7,... , 12}, V \C
1
= {13, · · · ,42}). We con-
sider this first way to be the most intuitive one.
To demonstrate the indirect way we use the qual-
ity index (inter-cluster) conductance (Brandes et al.,
2003; Brandes and Erlebach, 2005). The conductance
of a cut compares the size of the cut and the number
of edges in either of the two induced subgraphs. How-
ever, the definitions for the conductance in (Brandes
et al., 2003; Brandes and Erlebach, 2005) slightly dif-
fer. In this paper, the size of the cut corresponds to the
number of edges between the two components of the
cut and the edges of the two induced subgraphs corre-
spond to all edges incident to a node in the subgraphs.
The conductance of a graph clustering σ(ζ) is the
maximum conductance value over all induced cuts
(C
i
,V \C
i
). The conductance value of a cut ξ(C,C
0
)
is defined as:
φ(C) :=
1,if C ∈ {
/
0,V }
0,if C 6∈ {
/
0,V } and |E(C,C
0
)| = 0
|E(C,C
0
)|
min(|E
inc
(C)|,|E
inc
(C
0
)|)
(17)
where C
0
= V \C. A cut can be considered as a bottle-
neck if its size is small relative to the density of either
side of the cut.
The conductance of a graph clustering is:
σ(ζ) = 1 − max
C∈ζ
φ(C) (18)
If applying the first intuitive way of cut definition, the
formula of conductance given an overlapping cluster-
ing remains the same:
σ
ov
ExFromRest
(ζ) = σ(ζ) (19)
If applying the second way of cut definition, both
the observed cluster and the rest of the graph con-
tain the overlapping nodes. We should redefine the
cut ξ(C,C
0
) as:
C
0
= V \ {v ∈ C : |C(v)| = 1} (20)
We also have to modify the formula for cut conduc-
tance as in this case we actually have two bottlenecks
which should be considered. To assess the bottlenecks
between the two subgraphs C and C
0
we use the fol-
lowing formula:
φ
ov
Inc
(C) := max
|E
inc
(C) \ E(C)|
|E
inc
(C)|
,
|E
inc
(C
0
) \ E(C
0
)|
|E
inc
(C
0
)|
(21)
Then the conductance is calculated as:
σ
ov
Inc
(ζ) = 1 − max
C∈ζ
φ
ov
Inc
(C) (22)
If applying the third way of cut definition, where the
nodes in overlaps are excluded from the observed
cluster, we should redefine the cut ξ(C,C
0
) as:
ξ(C
ExFromCl
,V \C
ExFromCl
) (23)
where
C
ExFromCl
(C) = C \ {v ∈ C : |C(v)| > 1} (24)
ADAPTATION AND ENHANCEMENT OF EVALUATION MEASURES TO OVERLAPPING GRAPH
CLUSTERINGS
9

The conductance calculation given an overlapping
clustering is then defined as following:
σ
ov
ExFromCl
(ζ) = 1 − max
C∈ζ
φ(C
ExFromCl
(C)) (25)
Enhancement of M
ov
. The authors in (L
´
az
´
ar et al.,
2010) define the modularity measure of networks with
overlapping communities M
ov
as follows:
M(C) :=
1
|C|
∑
v∈C
in
C
(v) − out
C
(v)
d(v)|C(v)|
| {z }
node justifiability
·
|E(C)|
E
max
(C)
| {z }
cluster density
(26)
where in
C
(v) is the number of inward edges of v
(edges that are incident to v and are intra-cluster edges
of C) and out
C
(v) is the number of outward edges
(edges that are incident to v and have their destination
not in C).
M
ov
(ζ) =
1
k
∑
C∈ζ
M(C) (27)
The M
ov
measure assesses each cluster separately
and calculates the average of the ratings. The “good-
ness” M(C) of a cluster depends on two criteria: how
“justifiable” the cluster nodes are assigned to the clus-
ter and how dense the cluster is. The first criteria
means that a given node should primarily go inward
towards its cluster(s) and should not go outward.
Figure 3: Graph clustering ζ: {C
1
= {1,. .., 10}, C
2
=
{1,11, 12}, has value M
ov
(ζ) ≈ 0.50, while
]
M
ov
mod
≈ 0.73
We discovered one drawback of M
ov
measure
which appears in case the given clustering contains
large clusters that are well separated and dense and
some small clusterings that have a small M(C) value.
The ratings for these “bad quality” small clusters de-
crease the value of M
ov
(see Figure 3). However, it is
more rational if the contribution of the cluster rating
is proportional to the cluster size:
M
ov
mod
(ζ) :=
∑
C∈ζ
|C|
n
M(C)
(28)
The larger a cluster is, the larger is also its influence
and therefore also the influence of its quality on the
whole clustering. If we do not take the cluster sizes
into account, the evaluation of the entire clustering
may become unbalanced or biased.
Given a clustering with overlaps we should pay
attention that a node may contribute to the measure
calculation several times. This leads to the increase
of the measure value, although the clustering becomes
harder to interpret, as the cluster borders get fuzzier.
To get rid of this effect we can use a weighting for a
single node (similar to the edge weighting above):
ϖ
V
(v) =
1
|C(v)|
(29)
The modification of M
ov
using the node weightings
is:
]
M
ov
mod
(ζ) :=
∑
C∈ζ
1
n
∑
v∈C
ϖ
V
(v)
M(C)
!
(30)
Note, that the weighting component ϖ
V
(v) is already
used in a node justifiability part of M(C) (Formula
26). While we use it more for an appropriate calcu-
lation of a cluster’s size, L
´
az
´
ar et al. (2010) use it to
weight the contribution of each node.
The quality of the graph in Figure 3 using formula
30 is 0.73 in comparison to the original value of 0.50.
The range value for
]
M
ov
mod
remains between −1 and 1
as for the original measure M
ov
.
5 GENERATION MODEL FOR
CLUSTERED GRAPHS
The previous section illustrated the main ideas to ex-
tend a quality measure for crisp graph clusterings
to a quality measure for overlapping graph cluster-
ings. Although the extensions take care to preserve
the original measure criteria, one has to keep in mind
that an extension always creates a new index. For this
reason, it is important to analyse the properties and
the behavior of the new indices on different overlap-
ping graph clusterings. As there is a lack of realistic
benchmark graphs with known overlapping structure,
we are forced to use computer generated clustered
graphs. In this way, we can analyse the behaviour of
indices on clustered graphs with different properties,
which is a major advantage.
To generate an artificial overlapping graph cluster-
ing, we use the idea from (Gregory, 2007) and modify
some parts to create more realistic graphs and clus-
terings. At first Gregory generates n nodes and di-
vides them into k clusters. He uses a parameter r to
specify the fraction of overlaps, so that each cluster
ICPRAM 2012 - International Conference on Pattern Recognition Applications and Methods
10

contains nr/k nodes. Afterwards the edges are ran-
domly placed between pairs of nodes with the proba-
bility p
in
if the nodes belong to the same cluster and
p
out
otherwise. In our generation model the clusters
are not equally-sized and the nodes do not possess
the same degree in average to make them more realis-
tic. Many real-world graphs have a power-law degree
distribution (Lancichinetti and Radicchi, 2008), e.g.
the Internet graph (Chakrabarti et al., 2010). They
also have a broad distribution of community sizes,
i.e. many small communities coexis with some much
larger ones. The tail of the community size distri-
bution can be often quite well described by a power
law (Lancichinetti and Radicchi, 2008; Lancichinetti
et al., 2010). Our generation model requires six pa-
rameters to generate an overlapping graph clustering
in three steps: n, k, α, r, p
in
and p
out
. In the fol-
lowing the three steps and the related parameters are
explained in more detail.
Step 1, Initial Cluster Allocation. In the first step,
the nodes of the graph are created and partitioned into
clusters. To assign the nodes to the clusters, the pa-
rameters n and k are used. The parameter n specifies
the number of nodes in the graph and k the number of
clusters, to which the n nodes are allocated. We use a
power law distribution to assign the nodes to the clus-
ters, in particular the inverse cumulative distribution
function of the power law distribution:
x = Φ(y) = t(1 − y)
−
1
α
(31)
The parameter t indicates the minimum for the
value range and will be always equal to 1 in this pa-
per for simplicity. The parameter α can be used to
manipulate the degree of the slope and thus changes
the differences in the cluster sizes. With a low α the
variability between the cluster sizes is higher. To de-
rive the k clusters, we use the inversion method. At
first, we generate k random uniform distributed values
p
1
,..., p
k
with p
i
∈ [0,1]. The k function values of the
Φ(p
i
) represent the probabilities to assign a node to a
cluster C
i
. Afterwards the k function values will be
normalized with
norm
i
=
Φ(p
i
)
∑
k
j=1
Φ(p
i
)
(32)
and mapped to the unit interval. Finally for each node
a new random uniform distributed value assigns the
node to the cluster C
i
which is represented though the
norm
i
on the unit interval. At the end of step 1, every
node is assigned to one cluster and the cluster sizes
are power law distributed.
Step 2, Overlap Generation. The overlapping pa-
rameter r indicates the number of overlapping nodes.
If r > 1, then nr − n random nodes are assigned to
an additional cluster. With r = 1 the graph cluster-
ing possesses no overlaps. The overlapping nodes are
randomly selected with replacement. Thus, a node
can belong to more than two clusters.
Step 3, Edge Generation. In the last step the edges
between the nodes are created using the probabilities
p
in
and p
out
. To avoid giving all nodes the same de-
gree, we use the following scheme: All nodes are se-
quently added to the graph. While adding a new node
u ∈ V to the graph, all possible node pairs (u,v), con-
sisting of u and an already present node v, are consid-
ered. If the two nodes belong to different clusters, a
new edge between u and v is created with the proba-
bility p
out
. If the nodes belong to the same cluster, the
probability p
in
is used and will be increased in depen-
dence to degree d(v) of the already present node v to
p
(u,v)
in
. That is, we do not use p
in
directly, but use the
probability p
(u,v)
in
to create an edge between u and v.
Using the degree of the nodes to calculate the proba-
bility for a new edge, is a common method for gen-
erating artificial graphs, to make them more realistic,
and is called preferential attachment (Aggarwal and
Wang, 2010). In this way, the nodes, rich on edges,
get richer as the graph grows, leading to power law
effects.
To calculate p
(u,v)
in
we use:
p
(u,v)
in
=
d(v)
n
+ p
in
d(v)
n
+ 1
(33)
The parameter n specifies the number of nodes in the
graph we want to generate and remains constant.
With this calculation, nodes with a high degree get
an additional edge with higher probability than nodes
with a low degree. An analog calculation for p
out
is
not necessary and has drawbacks: Clusterings with
no inter-cluster edges can not be created. Even with
p
out
= 0.0 the node degrees would increase the val-
ues for p
(u,v)
out
and inter-cluster edges can be generated
with a low probability. One has to consider that our
generation model in theory can create empty clusters.
If this is the case, the whole clustering is generated
again.
6 EXPERIMENTS
In the following we analyse the properties and the be-
havior of the new indices in comparison to their orig-
inal indices. Unfortunately, there is a lack of realistic
benchmark graphs with known overlapping structure
and with different properties, i.e. number and size of
ADAPTATION AND ENHANCEMENT OF EVALUATION MEASURES TO OVERLAPPING GRAPH
CLUSTERINGS
11
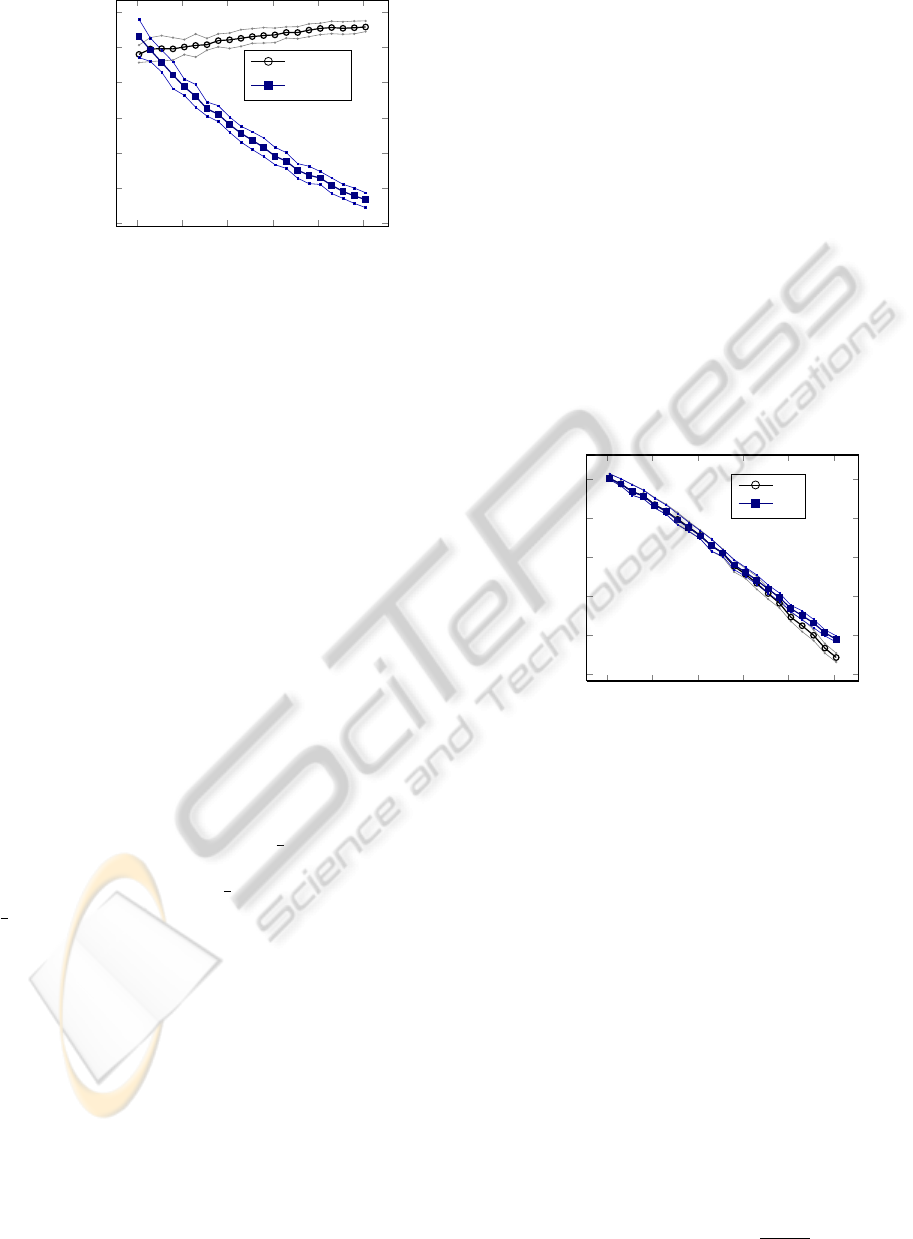
1 1.2 1.4
1.6
1.8 2
0.74
0.76
0.78
0.8
0.82
0.84
0.86
r
Measure value
Density
^
Density
ov
Figure 4: Experiment E01; Parameters: n = 128, k = 8,
1.01 ≤ r ≤ 2.01, p
in
= 0.7, p
out
= 0.05, α = 3.0. Each main
line shows the mean values, the thin lines correspond to the
first and third quintiles.
clusters, size of overlapping parts, degree distribution
etc. In order to overcome this problem we use com-
puter generated clustered graphs.
For this analysis, different graph clusterings are
generated and evaluated through the indices. To gen-
erate the graph clusterings, we use our model from
the previous section. Four experiments are presented.
In each of them we generate graph clusterings with
128 nodes and 8 clusters. To get an appropriate clus-
tering structure we choose p
in
= 0.7 and p
out
= 0.05
for the edge probabilities. The parameters r or α are
varied. In the following, values we report were calcu-
lated by taking the mean, first and third quintile of the
respective measure on 100 different graph clusterings
generated with the same parameters.
In the first experiment E01 we compare the orig-
inal Density (Formula 8) and its weighted extension
(Formula 16). We vary the overlap parameter r from
1.01 to 2.01, for α = 3.0. In the original density, the
weighting for the two criteria intra-cluster density and
inter-cluster sparsity are equal to
1
2
, to calculate the
average. For this experiment we adapt the weights
for the extended density to
1
3
for ω
f
, ω
g
and ω
o
and
1
2
for ω
s
and ω
m
. In Figure 4, the results of experi-
ment E01 are illustrated. Both indices show a diverg-
ing behaviour. For increasing r the value of density
increases slightly. However, the clusterings become
harder and harder to interpret as r increases, as the
cluster borders get more fuzzy. With r = 2 almost
each node belongs to two clusters. Thus the origi-
nal density is inappropriate to evaluate this overlap-
ping graph clustering. In contrast, the value of the
weighted extension of density decreases with the in-
creasing degree of overlapping and the consequently
decreasing interpretability. Therefore the extension
produces an improvement.
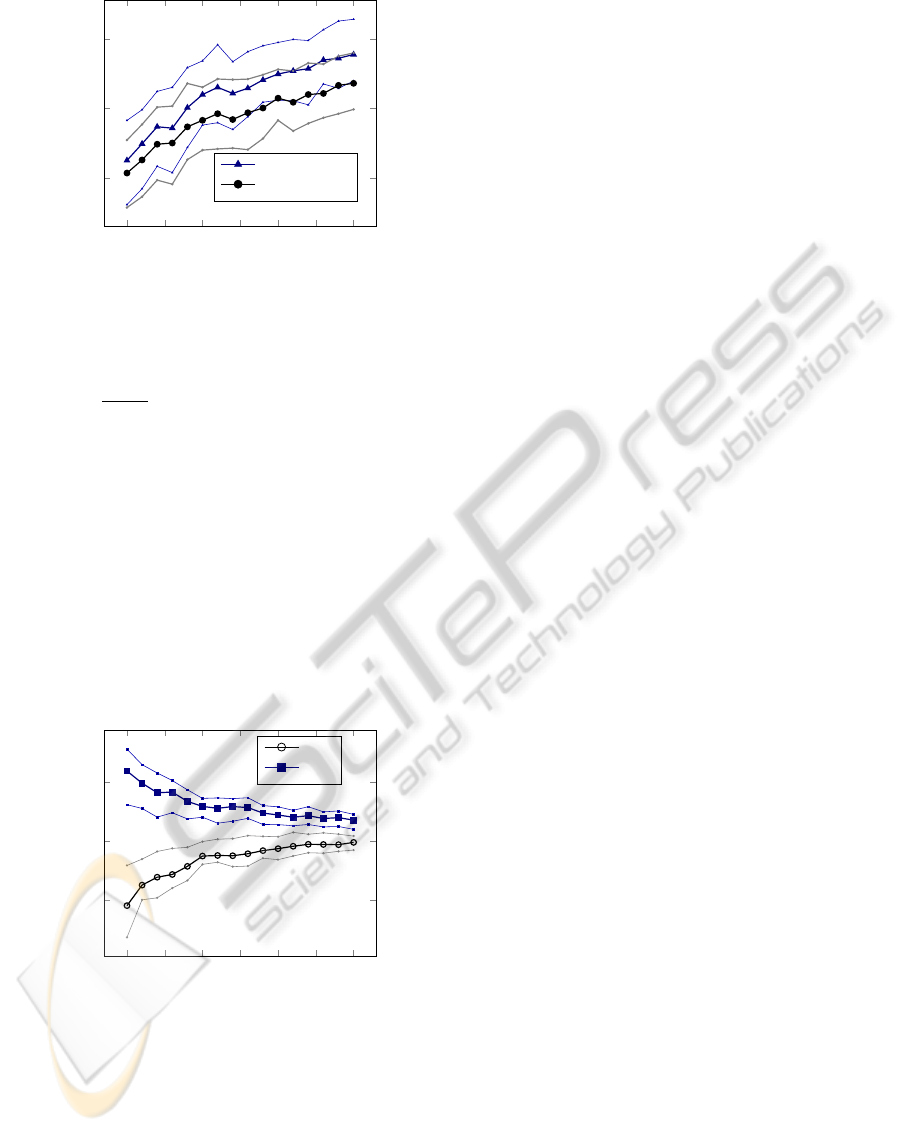
In the next experiment E02 we compare New-
mans’s modularity (Formulas 11–13) and its weighted
extension (Formula 14). The values for r and α are the
same as in the previous experiment E01. In Figure 5
the diagram for E02 is illustrated. Both indices show
a similar behaviour. Not or only marginally overlap-
ping graph clusterings get positive values. The more
r increases the stronger the measure values decrease
towards negative values (−0.5). This behaviour re-
sults from the strong connectivity between the clus-
ters and confirms that the modified modularity han-
dles clusterings with overlaps but still prefers fully
separated clusters. One can discover a slight differ-
ence for r ≥ 1.5. The original modularity evaluates
these clusterings adequately and therefore the exten-
sion is not necessary in this example. Nevertheless
there are clusterings, where the value for the origi-
nal Newman’s modularity exceeds the upper interval
boundary (see Figure 2). Therefore our weighted ex-
tension is a reliable modification to adapt Newmans’s
modularity for an overlapping graph clusterings.
1 1.2 1.4
1.6
1.8 2
−0.6
−0.4
−0.2
0
0.2
0.4
r
Measure value
Q
Q
ov
Figure 5: Experiment E02; Parameters: n = 128, k = 8,
1.01 ≤ r ≤ 2.01, p
in
= 0.7, p
out
= 0.05, α = 3.0. Each main
line shows the mean values, the thin lines correspond to the
first and third quintiles.
E03 is the third experiment and its results are il-
lustrated in Figure 6. Here the three possible exten-
sions for conductance are compared. In contrast to
the other experiments, the parameter r = 1.1 is fixed
and α is varied between 1.0 and 4.0. Note that for
real world networks the scaling exponent α is usually
between 2.0 and 3.5 (Lancichinetti et al., 2010; Ap-
pendix S1). With a low α the variability between the
cluster sizes is higher. Thus, the probability to gener-
ate a clustering with at least one small cluster that pos-
sesses a strong connection outwards is high even with
a low α. The value of the conductance is dominated
by the lowest partial value for a single cluster. This
is why all three extensions return a low value given a
low α. The values of the extensions σ
ov
ExFromRest
(For-
mula 19) and σ
ov
Inc
(Formula 22) are almost identical.
This results from the similar calculation. The two ex-
tensions only differ if the ratio for
E(C
0
)
E
inc
(C
0
)
is greater
ICPRAM 2012 - International Conference on Pattern Recognition Applications and Methods
12
1
1.5
2
2.5
3
3.5
4
0.1
0.2
0.3
α
Measure value
σ
ov
Inc
, σ
ov
ExFromRest
σ
ov
ExFromCl
Figure 6: Experiment E03; Parameters: n = 128, k = 8,
r = 1.1, p
in
= 0.7, p
out
= 0.05, 1.0 ≤ α ≤ 4.0. Each main
line shows the mean values, the thin lines correspond to the
first and third quintiles.
than the ratio
E(C)
E
inc
(C)
, which is very seldom. The ex-
tension σ
ov
ExFromCl
(Formula 25) continuously returns
a lower value. Overlapping nodes do not belong to the
evaluated cluster in this extension. As there is a high
probability that overlapping nodes possess a strong
connection to all of their clusters (also due the rela-
tive high value p
in
which leads to the appearance of
nodes with high degree), excluding these nodes from
the observed cluster causes a strong connection out-
wards, to the rest of the graph. Therefore the con-
ductance value of the cut induced by the cluster has
a low value. This example illustrates how important
the manner in which the evaluation for overlaps is in-
tegrated into an index is.
1
1.5
2
2.5
3
3.5
4
0.1
0.2
0.3
α
Measure value
M
ov
]
M
ov
mod
Figure 7: Experiment E04; Parameters: n = 128, k = 8,
r = 1.1, p
in
= 0.7, p
out
= 0.05, 1.0 ≤ α ≤ 4.0. Each main
line shows the mean values, the thin lines correspond to the
first and third quintiles.
In the last experiment E04 the index M
OV
and its
modification are compared. The parameters for the
cluster generation model are identical to experiment
E03. That means α is the variable parameter again.
The experiment E04 is illustrated in Figure 7. One
can see that the values are almost mirrored horizon-
tally. Low values for α cause relatively high M
OV
and
respectively low
]
M
ov
mod
values. The higher α is, the
more equal the indices values are. In the original M
OV
every cluster is weighted equally. With a low α there
are some small clusters which possess a strong con-
nection outwards and decrease the value. Even well
separated large clusters cannot avoid this, because of
the equal weighting of the clusters. The modified
M
OV
considers the different cluster sizes, therefore
well separated large clusters increase the value and
small clusters are neglected.
7 CONCLUSIONS AND FUTURE
WORK
In this paper, we discussed the problem of finding
appropriate measures to evaluate overlapping graph
clusterings. In particular, we proposed three methods
to adapt existing crisp evaluation measures to handle
overlapping graph clusterings in an appropriate man-
ner. We proposed to modify the quality indices in a di-
rect way, by incorporation of edge weights and in an
indirect way. When taking a direct way, the quality
measure evaluates not only the intra-cluster density
and the inter-cluster sparsity but also measures the
quality of the overlapping parts e.g. considering the
overlap size and the membership of the overlapping
nodes. We demonstrated the first extension method
on the density measure.
If a crisp evaluation measure is applied directly
to a graph clustering with overlaps, the calculation
contains inaccuracies because overlapping nodes and
edges can be considered multiple times. Our second
extension method uses edge weights, so that overall
each element is considered exactly one time. Incorpo-
ration of the edge weights was demonstrated on New-
man’s modularity. We applied the incorporation of the
node weights to the M
OV
index.
In the third method, the evaluation of the overlap-
ping parts is integrated indirectly. That is, depending
on the extended measure and its criteria, one has to
decide how the overlapping parts are handled. There
are indices, which assess the quality of each cluster
separately, and then use the obtained values to calcu-
late the overall “goodness” of the clustering. For these
measures, the overlapping parts can be handled in dif-
ferent ways depending on the decision where to make
the cut between the observed cluster and the rest of
the graph. We showed three possible extensions and
gave an example using the conductance measure.
M
OV
is one of the few already existing indices for
overlapping graph clusterings. In this paper, we mod-
ADAPTATION AND ENHANCEMENT OF EVALUATION MEASURES TO OVERLAPPING GRAPH
CLUSTERINGS
13

ified it to make M
OV
more sensitive for different clus-
ter sizes. The idea is that the quality of large clus-
ters should have more influence on the index than the
quality of small clusters. This can be done using the
weighting of clusters qualities depending on the clus-
ter size.
To analyse the new measures, in particular the in-
fluence of the modification on the original measure,
we used a generation model for overlapping graph
clusterings. The model is a modification of a common
method. We enhanced it using a power law distribu-
tion of cluster sizes and node degrees to produce more
realistic clusterings. The experiments with this gener-
ation model confirmed that all our extensions for crisp
evaluations measures provide an appropriate and reli-
able adaption to handle overlapping graph clusterings.
In the future we are also going to test the new mea-
sures on data from real-world networks. Another po-
tential research topic for future work is the adaption
of our extension methods to overlapping clustering on
directed or/and weighted graphs. One more interest-
ing research question is, whether the new measures
can also be successfully used to generate overlapping
graph clusterings. In future work we will study if us-
ing the proposed measures as fitness functions within
overlapping clustering algorithms will improve the
clustering performance for overlapping clusterings.
REFERENCES
Adamcsek, B., Palla, G., Farkas, I., Der
´
enyi, I., and Vic-
sek, T. (2006). Cfinder: locating cliques and overlap-
ping modules in biological networks. Bioinformatics,
22(8):1021.
Aggarwal, C. and Wang, H. (2010). Managing and Mining
Graph Data, volume 40. Springer-Verlag New York
Inc.
Ahn, Y., Bagrow, J., and Lehmann, S. (2010). Link commu-
nities reveal multiscale complexity in networks. Na-
ture, 466(7307):761–764.
Baumes, J., Goldberg, M., and Magdon-Ismail, M. (2005).
Efficient identification of overlapping communities.
Intelligence and Security Informatics, pages 27–36.
Brandes, U., Delling, D., Gaertler, M., et al. (2007). On
modularity clustering. IEEE Transactions on Knowl-
edge and Data Engineering, pages 172–188.
Brandes, U. and Erlebach, T. (2005). Network analysis:
methodological foundations, volume 3418. Springer
Verlag.
Brandes, U., Gaertler, M., and Wagner, D. (2003). Exper-
iments on graph clustering algorithms. Algorithms-
ESA 2003, pages 568–579.
Chakrabarti, D., Faloutsos, C., and McGlohon, M. (2010).
Graph mining: Laws and generators. Managing and
Mining Graph Data, pages 69–123.
Delling, D., Gaertler, M., G
¨
orke, R., Nikoloski, Z., and
Wagner, D. (2006). How to evaluate clustering tech-
niques. Univ., Fak. f
¨
ur Informatik, Bibliothek.
Fortunato, S. (2010). Community detection in graphs.
Physics Reports, 486(3-5):75–174.
Gavin, A., B
¨
osche, M., Krause, R., Grandi, P., Marzioch,
M., Bauer, A., Schultz, J., Rick, J., Michon, A., Cru-
ciat, C., et al. (2002). Functional organization of the
yeast proteome by systematic analysis of protein com-
plexes. Nature, 415(6868):141–147.
Girvan, M. and Newman, M. (2002). Community structure
in social and biological networks. Proceedings of the
National Academy of Sciences of the United States of
America, 99(12):7821.
Gregory, S. (2007). An algorithm to find overlapping com-
munity structure in networks. Knowledge Discovery
in Databases: PKDD 2007, pages 91–102.
Lancichinetti, A., Kivel
¨
a, M., and Saram
¨
aki, J. (2010).
Characterizing the community structure of complex
networks. PloS one, 5(8):e11976.
Lancichinetti, A. and Radicchi, F. (2008). Benchmark
graphs for testing community detection algorithms.
Physical Review E, 78(4):046110.
L
´
az
´
ar, A.,
´
Abel, D., and Vicsek, T. (2010). Modularity mea-
sure of networks with overlapping communities. EPL
(Europhysics Letters), 90:18001.
Nepusz, T., Petr
´
oczi, A., N
´
egyessy, L., and Bazs
´
o, F.
(2008). Fuzzy communities and the concept of brid-
geness in complex networks. Physical Review E,
77(1):016107.
Newman, M. and Girvan, M. (2004). Finding and evaluat-
ing community structure in networks. Physical review
E, 69(2):026113.
Nicosia, V., Mangioni, G., Carchiolo, V., and Malgeri, M.
(2009). Extending the definition of modularity to di-
rected graphs with overlapping communities. Jour-
nal of Statistical Mechanics: Theory and Experiment,
2009:P03024.
Palla, G., Der
´
enyi, I., Farkas, I., and Vicsek, T. (2005).
Uncovering the overlapping community structure of
complex networks in nature and society. Nature,
435(7043):814–818.
Schaeffer, S. (2007). Graph clustering. Computer Science
Review, 1(1):27–64.
Tan, P., Steinbach, M., Kumar, V., et al. (2006). Introduction
to data mining. Pearson Addison Wesley Boston.
ICPRAM 2012 - International Conference on Pattern Recognition Applications and Methods
14
