
CARDIAC CYCLE ARTEFACT REMOVAL IN
MAGNETOENCEPHALOGRAPHIC DATA OF PATIENTS WITH
DEEP BRAIN ELECTRODES
Implementation of Simultaneous Magnetoencephalographic and Local Field
Potential Recordings
Antje Bock
1
, Andrea A. K¨uhn
1
, Lutz Trahms
2
and Tilmann H. Sander
2
1
Department of Neurology, Charit´e Berlin, Campus Virchow, Augustenburger Platz 1, 13353 Berlin, Germany
2
Physikalisch-Technische Bundesanstalt, Abbestr. 2-12, 10587 Berlin, Germany
Keywords:
Magnetoencephalography, Deep brain stimulation, Local field potentials, Cardiac cycle artefact, Principal
component analysis, Signal space projection, Coherence.
Abstract:
Simultaneous magnetoencephalography (MEG) and local field potential (LFP) recordings in patients under-
going deep brain stimulation (DBS) for severe movement disorders is a promising technique both for clinical
applications and basic research. Recordings can be accomplished during the time interval between electrode
insertion and implantation of the stimulator while electrodes are externalised. At present, strong cardiac cycle
artefacts (CCA) are observed in the MEG signals around the area, where the disposable stainless steel electrode
wires leave the skull. The CCA refers to the remanent magnetic field of those wires underneath the sensors,
which are moved by local pulsations of the blood vessels. Here, we demonstrate a new approach to partially
remove the CCA by applying principal component analysis (PCA) to an averaged CCA and subsequent signal
space projection (SSP) method. Further steps of analysis such as coherence calculations are less distorted after
SSP.
1 INTRODUCTION
Deep brain stimulation (DBS) offers the unique op-
portunity to directly record local field potentials
(LFP) from the human basal ganglia (BG) (Silberstein
et al., 2003; K¨uhn et al., 2004). By implementing
simultaneous magnetoencephalography (MEG) and
LFP recordings in patients undergoing DBS, cortical
brain activity in terms of magnetic fields in addition to
electrical neuronal activity directly from the BG can
be measured. Results will give fundamentally new
insights about information encoding and processing
in the cortico-BG network. However, MEG record-
ings are very noisy due to the cardiac cycle artefact
(CCA). The CCA refers to local pulsations of the
blood vessels moving the weakly magnetised (exter-
nalisation) stainless steel electrode wires relative to
the MEG sensors (Litvak et al., 2010). The principal
component analysis (PCA) of the averaged CCA can
be calculated in order to identify the pattern and di-
mensionality of the artefact, which, in turn, can then
be eliminated from the MEG data by applying signal
space projection (SSP). Subsequent coherence calcu-
lations lead to improved topographic distributions.
2 METHODS
2.1 Patients and Recordings
Nine patients with Parkinson’s disease (PD) (2 fe-
males, mean age 55.89 ± 11.53 years) and eight pa-
tients suffering from dystonia (5 females, mean age
51.50 ± 8.38 years) were included in this study (17
in total). DBS electrodes were implanted bilater-
ally in the subthalamic nucleus (STN) in the PD pa-
tients or in the internal globus pallidus (GPi) in the
dystonic patients, respectively. During the time in-
terval (2 to 5 days) before connection of the elec-
trodes to a subcutaneous pulse generator, simultane-
ous LFP and MEG recordings can be accomplished.
To this end, patient’s heads were positioned in a 125-
channel whole head MEG system (KIT, Eagle Tech-
nology, Kanazawa, Japan). Rest recordings of 300 s
325
Bock A., Kühn A., Trahms L. and Sander T..
CARDIAC CYCLE ARTEFACT REMOVAL IN MAGNETOENCEPHALOGRAPHIC DATA OF PATIENTS WITH DEEP BRAIN ELECTRODES -
Implementation of Simultaneous Magnetoencephalographic and Local Field Potential Recordings.
DOI: 10.5220/0003706703250328
In Proceedings of the International Conference on Bio-inspired Systems and Signal Processing (BIOSIGNALS-2012), pages 325-328
ISBN: 978-989-8425-89-8
Copyright
c
2012 SCITEPRESS (Science and Technology Publications, Lda.)
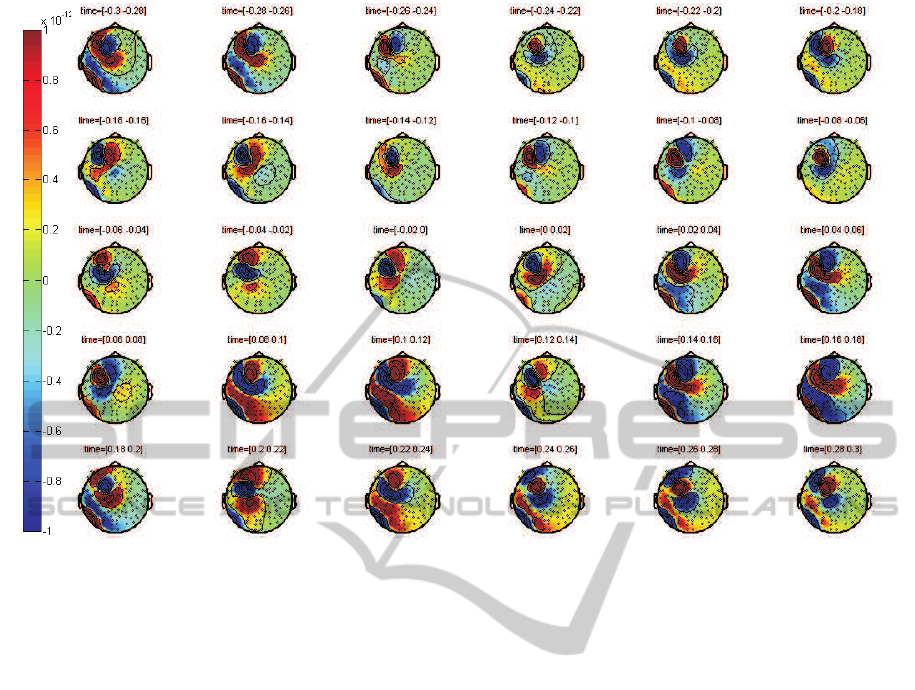
Figure 1: Averaged CCA of a dystonic patient calculated by R peak alignment (field strength indicated in Tesla).
duration were made while patients were asked not to
move and keep their eyes open. Simultaneously with
changes of the magnetic flux, LFP signals were ac-
quired with a 32 channel low noise EEG amplifier.
The DBS macroelectrodes in each hemisphere com-
prise 4 contacts, which are numbered 0, 1, 2, and 3
with 0 being the most caudal one. LPF signals were
recordedusing contact 0 of the left electrode as a com-
mon reference and then re-referenced to bipolar sig-
nals by subtracting adjacent contact pairs from each
other. Additionally, electrocardiograms (ECGs) were
recorded monopolarly with reference to the left deep
brain electrode contact 0. A ground electrode was
placed on the patient’s forehead. Data were sampled
at 2000 Hz and off-linefiltered between 5 and 120 Hz.
PD patients were recorded twice in one session, once
after overnight withdrawal from dopaminergic medi-
cation (OFF) and 30 to 60 minutes after intake of 200
mg of L-DOPA (ON).
2.2 Cardiac Cycle Artefact Removal
In MEG data, the heartbeat generates the cardiac
artefact (CA). The CA reflects the electrical current
within the heart muscle (Jousm¨aki and Hari, 1996),
which is a significant contribution to the MEG even
though MEG is recorded at a distance of about 200
mm from the heart. In patients with externalised elec-
trode wires, a second artefact can be detected, which
is the cardiac cycle artefact (CCA) (Litvak et al.,
2010). The CCA refers to the time variable magnetic
field due to local pulsations of the blood vessels mov-
ing the weakly magnetised externalisation wires rela-
tive to the MEG sensors. Both artefacts are best iden-
tified by finding the R wave, which is the deflection
of highest amplitude within the electrocardiographic
QRS complex. The QRS complex reflects the depo-
larisation of the heart’s right and left ventricles and
lasts about 100 ms. The CCA is of much higher am-
plitude than the CA as it has a technical origin, for
which reason the CA can be ignored within the scope
of this work. The R peak of the ECG signal has then
been used as a trigger for averaging the CCA in all
channels with trials of 600 ms length (300 ms before
and 300 ms after trigger onset).
As it can be assumed that the magnetic and elec-
tric fields propagate instantaneously, the averaged
CCA (aCCA) can be calculated by time-locking the
magnetic channels to the ECG. Figure 1 shows the
resulting topographic maps of all magnetic channels
(the number of the remaining channels of each patient
varied between 90 and 110, because saturated chan-
nels close to the artefact source have been sorted out)
for time epochs of 20 ms. The patient’s head in the
map is seen from above with sketched ears and nose
to denote its orientation. The little black dots indicate
BIOSIGNALS 2012 - International Conference on Bio-inspired Systems and Signal Processing
326

the locations of the sensors. The aCCA is the pat-
tern that is located within the left hemisphere around
the fronto-parietal area, where the electrode wires are
placed in loops underneath the skin. The intensity of
the magnetic field changes are color-coded and given
in Tesla. Positive values are shown in yellow, orange
and red color shades and represent sources, while neg-
ative blue-colored values show sinks. Arterial blood
flow velocity is about 1 m/s in thick blood vessels,
therefore the temporal allocation of the aCCA pat-
tern differs from the one of the QRS complex and the
strongest aCCA signal appears later than the R peak
at 0 ms.
A common method to detect the dimensionality
of a multivariate data set is the PCA. PCA using the
covariance method is an orthogonal linear transfor-
mation into uncorrelated variables (principal compo-
nents) by calculating the eigenvalue decomposition of
a covariance matrix. The PCA of the CCA can now be
calculated in order to identify the pattern and dimen-
sionality of the artefact. Figure 2 shows all patients’
(m = 26) resulting set of the first 30 eigenvalues in
decreasing order. The eigenvalues represent the en-
ergy of the eigenvectors. Eigenvalues have been stan-
dardised to the maximum eigenvalue being 1, as the
magnetisation of the electrode wires differs among
patients. A sharp bend at the fifth eigenvalue can be
seen in all curves, indicating that the dimensionality
of the CCA is 5 ≤ dim
CCA
≤ 10 and fairly similar for
all data sets.
0 5 10 15 20 25 30
0
0.1
0.2
0.3
0.4
0.5
0.6
0.7
0.8
0.9
1
Index
Eigenvalue
Standardized Values
Figure 2: First 30 standardised eigenvalues (m = 26) of the
PCA.
Given that the PCA eigenvalues of the aCCA have
a similar dependence, it is reasonable to use the signal
space projection (SSP) method as proposed by Uusi-
talo and Ilmoniemi (Uusitalo and Ilmoniemi, 1997) to
suppress the most powerful CCA components from
the data set. For this, the PCA decomposition is
backprojected to the channel level after removing the
first five principal components. If A
1,...,n
(90 ≤ n ≤
110) is the matrix containing the sorted eigenvectors
eigenvector
1
, eigenvector
2
, ..., eigenvector
k
, the data
set X
SSP
(t) after SSP equals
X(t)
SSP
=
(0)(0)(0)(0)(0) A
6,...,k
A
−1
X
raw
(t)
(1)
where X
raw
(t) is the raw data set.
2.3 Coherence between MEG and LFP
Channels
In order to map frequency-specific coupling between
cortical and BG activity, coherence has been applied.
Coherence (COH) is a frequency-indexed measure
quantifying the extent of two signals holding a consis-
tent phase difference (if a certain frequency is present
in both signals) and is defined as follows:
COH( f) =
hM
n
( f)s
∗
( f)i
p
hM
n
( f)M
∗
n
( f)ihs( f )s
∗
( f)i
(2)
where M
n
( f) is the Fourier transform of a time do-
main MEG channel and s( f) the Fourier transform
of an LFP signal. Coherence has been calculated be-
tween all magnetic channels and one LFP electrode
contact each before and after SSP (Figure 4 and 3).
3 RESULTS
After CCA removal by SSP, topographic distributions
have changed and specifically spread out coherence
patterns below 10 Hz are removed (Figure 3). After
SSP, coherence between the STN and ipsilateral sen-
sorimotor and premotor areas are found in the beta
band (13 to 30 Hz) in most of the PD patients during
OFF state, such as the one shown in Figure 3. This
feature is less pronounced when PD patients are ON
dopaminergic medication. Some of the dystonic pa-
tients show a similiar coherence pattern between the
GPi and cortical areas. Not consistently, but in some
of the dystonic patients, coherence between cortical
prefrontal areas and the GPi in the alpha frequency
band (7 to 12 Hz) becomes apparent after CCA re-
moval (Figure 4).
4 DISCUSSION AND
CONCLUSIONS
The SSP approach is based on a priori spatial sepa-
ration of the CCA and cortical brain signals and the
topography of the CCA is quite well defined, so this
way of artefact removal works adequately for our type
of magnetoencephalographic data. Our method is an
CARDIAC CYCLE ARTEFACT REMOVAL IN MAGNETOENCEPHALOGRAPHIC DATA OF PATIENTS WITH
DEEP BRAIN ELECTRODES - Implementation of Simultaneous Magnetoencephalographic and Local Field Potential
Recordings
327
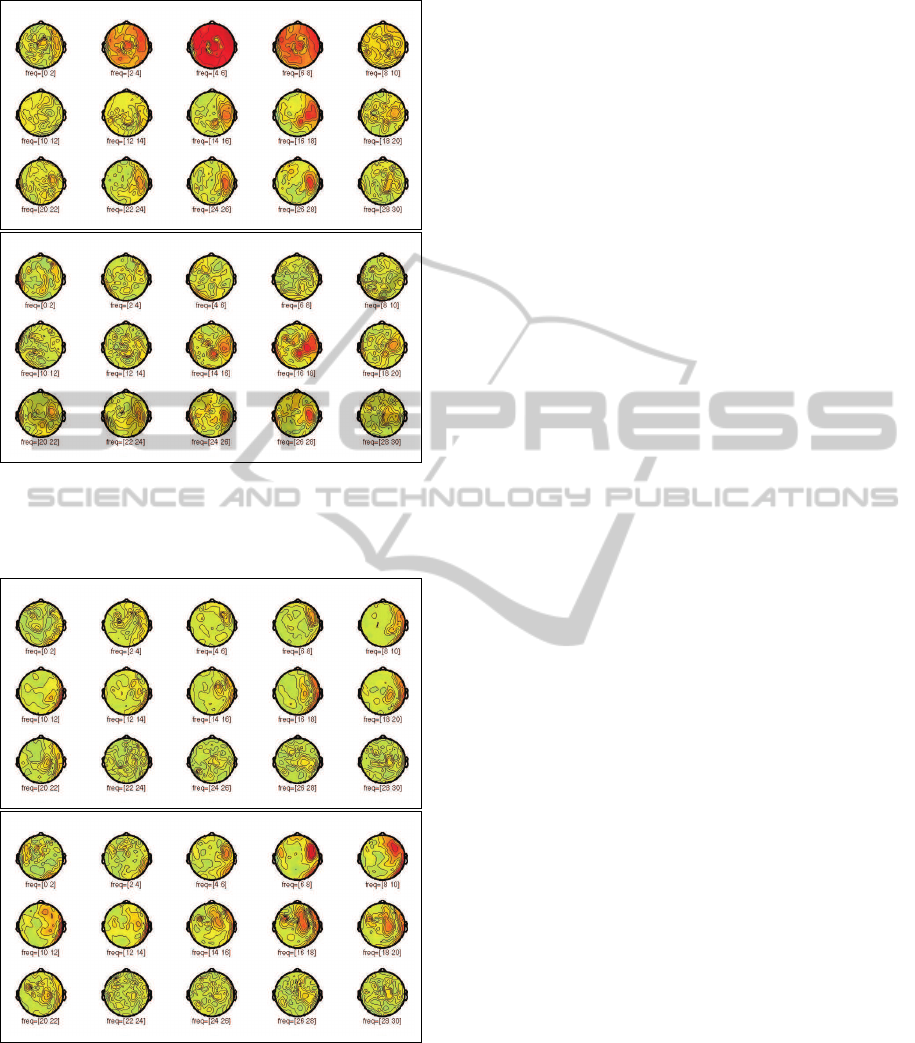
Figure 3: Coherence before (top plot) and after (bottom
plot) SSP in a PD patient between all magnetic channels
and contact 2 of the right electrode in the STN for frequency
bins of 2 Hz size from 0 to 40 Hz.
Figure 4: Coherence before (top plot) and after (bottom
plot) SSP in a dystonic patient between all magnetic chan-
nels and contact 3 of the right electrode in the GPi for fre-
quency bins of 2 Hz size from 0 to 40 Hz.
alternative to optimised beamforming (Litvak et al.,
2010) with regard to artefact suppression. In contrast
to beamforming, SSP does not require an electrical
source model. CCA removal not only suppresses co-
herences that are caused by the CCA, but also uncov-
ers coupling between the basal ganglia and cortical
brain regions, which were not visible before SSP. The
advantage of beamforming is that the location of the
coherent current in the brain is found. PCA on aCCA
followed by SSP could therefore be used as a prepro-
cessor for beamforming.
Future work has to investigate the reasons for the
CCA influencing coherences and statistical testing of
coherence differences before and after SSP (Maris
et al., 2007).
ACKNOWLEDGEMENTS
We would like to thank K. Obermayer for helpful dis-
cussions and support. A. B. is supported by a fellow-
ship from Dr. Robert Leven und Dr. Maria Leven-
Nievelstein-Stiftung.
REFERENCES
Jousm¨aki, V. and Hari, R. (1996). Cardiac artifacts in mag-
netoencephalogram. Journal of Clinical Neurophysi-
ology, 13:172–176.
K¨uhn, A. A., Williams, A., Kupsch, A., Limousin, P., Hariz,
M., Schneider, G. H., Yarrow, K., and Brown, P.
(2004). Event-related beta desynchronization in hu-
man subthalamic nucleus correlates with motor per-
formance. Brain, 127:735–746.
Litvak, V., Jha, A., Oostenveld, R., Barnes, G. R., Penny,
W. D., Zrinzo, L., Hariz, M. I., Limousin, P., Friston,
K. J., and Brown, P. (2010). Optimized beamforming
for simultaneous MEG and intracranial local field po-
tential recordings in deep brain stimulation patients.
Neuroimage, 50:1478–1588.
Maris, E., Schoffelen, J. M., and Fries, P. (2007). Nonpara-
metric statistical testing of coherence differences. J
Neurosci Methods, 163:161–175.
Silberstein, P., Kuehn, A. A., Kupsch, A., Trottenberg, T.,
Krauss, J. K., Woehrle, J. C., Mazzone, P., Insola, A.,
Lazzaro, V. D., Oliviero, A., Aziz, T., and Brown, P.
(2003). Patterning of globus pallidus local field poten-
tials differs between Parkinson’s disease and dystonia.
Brain, 126:2597–2608.
Uusitalo, M. A. and Ilmoniemi, R. J. (1997). Signal-space
projection method for separating MEG or EEG into
components. Medical and Biological Engineering and
Computing, 35:135–140.
BIOSIGNALS 2012 - International Conference on Bio-inspired Systems and Signal Processing
328
