
3D VISUALIZATION OF HAPLOTYPE RISK MAPS
Sergio Torres-S
´
anchez
∗
, Manuel Garc
´
ıa-S
´
anchez
∗
, Germ
´
an Arroyo, Nuria Medina-Medina, Rosana
Montes-Soldado, Francisco Soler-Mart
´
ınez and Mar
´
ıa M. Abad-Grau
Departamento de Lenguajes y Sistemas Inform
´
aticos - CITIC, Universidad de Granada, Granada, Spain
∗
These authors have contributed equally to this paper.
Keywords:
Genetic risk maps, Genome-wide association studies, 3D visualization.
Abstract:
Traditionally, genetic risk maps consider genotypic differences in a small number of single markers. However,
a more recent approach considers a very large set of input variables some of them with very little effect and
haplotypes with several consecutive markers instead of genotypes. While a bidimensional map can only show
the first of the two approaches, a 3D map together with a powerful visualization tool of virtual reality may
combine both approaches, so that the molecular biologist can get immerse and explore every genetic risk factor
represented in the map. Maps enriched with information from different annotation sources may fully benefit
of this 3D immersive feature.
1 INTRODUCTION
With the growing number of genome-wide associa-
tion studies that are currently being performed, and
the widely accepted decision of releasing genome-
wide data for researching purpose, biostatisticians
and bioinformatitians are being able of creating risk
models to predict the individual susceptibility to a
complex disease using genetic data as the input to
their methods (Wray et al., 2003).
Given a risk model and an individual genotype,
an individual risk map can be created with the vari-
ants the individual has for all the variables selected by
the model. Although very different approaches have
been used to build a risk model, such as aggregated
genetic scores (Evans et al., 2009; Jager et al., 2009)
or Bayesian networks (Sebastiani et al., 2005), most
of these genetic models show a modest accuracy in
polygenic diseases. The accuracy does not improve
when instead of using only the known allelic variants
a genome-wide search is performed.
However, by using more than one single nu-
cleotide marker at a time and haplotypes instead of
genotypes, genome-wide search models have signif-
icantly increased accuracy. This is the case of us-
ing a Naive Bayes Classifier (Sebastiani et al., 2010)
as a haplotype-based model to predict the individ-
ual predisposition to multiple sclerosis (MS) (Torres-
S
´
anchez et al., 2011). The accuracy especially in-
creases when the genome-wide search select even loci
with a very little effect on the disease, so that many
input variables are used in the model. This is in agree-
ment with the current evidence that MS is a polygenic
disease with hundred loci of modest effects and thou-
sands of very small effects ((IMSGC), 2010). Another
genotype-based model recently proposed and based
on a multi-step logistic regression protocol supports
this evidence (Wang et al., 2011).
Individual risk maps obtained from the haplotype-
based model for susceptibility to MS have three main
differences with those based in the more traditional
models: (1) they are much larger as there are many
genetic loci affecting the risk, (2) they represent hap-
lotypes instead of genotypes, so that how risk variants
distribute among a pair of homologous chromosomes
matters and (3) each input variable represents a loci
with a few markers instead of only one.
In this work we first succinctly describe the algo-
rithm to build the haplotype-based predictive model
and afterwards we show an example of an haplotype-
based individual risk map defined from a model of
MS. We also show the genotype version of the risk
map that would be obtained with 2D approaches and
how the 3D risk map allows the observer to obtain
both haplotype and genotype knowledge about the
risk factors for an individual and how the map can
be modified by the user by choosing different genetic
models. Finally, in Sec. 4, we describe the main fea-
tures of 3DRiskMapper, the software we have pro-
duced for the virtual exploration of a 3D risk map.
275
Torres-Sánchez S., García-Sánchez M., Arroyo G., Medina-Medina N., Montes-Soldado R., Soler-Martínez F. and M. Abad-Grau M..
3D VISUALIZATION OF HAPLOTYPE RISK MAPS.
DOI: 10.5220/0003708502750280
In Proceedings of the International Conference on Bioinformatics Models, Methods and Algorithms (BIOINFORMATICS-2012), pages 275-280
ISBN: 978-989-8425-90-4
Copyright
c
2012 SCITEPRESS (Science and Technology Publications, Lda.)

Figure 1: A Naive Bayes classifier, with n input variables
v
1
, v
2
, . . . , v
n
and the class attribute K.
Conclusions appear in Section 5.
2 INDIVIDUAL RISK MAPS
To build our individual 2D maps (Torres-S
´
anchez
et al., 2011) we first needed a genome-wide haplotype
based individual model. Opposite to genetic-based
predictive models which have genotypes as input
variables, the genome-wide haplotype-based model
(Abad-Grau et al., 2011a) has haplotypes as input
variables. In a genome-wide haplotype-based model,
the whole set of variants that are transmitted together
for all the chromosomes and all the positions used by
the model are called a genome-wide haplotype. The
individual risk model is defined on top of an haplo-
type risk model, which accepts genome-wide haplo-
types as a configuration for the set of input variables
and returns the risk probability of each haplotype.
The predictive model of individual risk is defined
by the product of the haplotype risk of the two homol-
ogous (parental and maternally inherited) genome-
wide haplotypes. It has to be noted that both, the hap-
lotype risk model and the individual risk model has a
binary output variable (named the class variable). In
the case of the haplotype risk model, the class variable
is whether the genome-wide haplotype introduced as
an input is a high-risk one (Abad-Grau et al., 2011b).
The model is a Naive Bayes Classifier (Sebastiani
et al., 2010) so that the haplotype variants v
1
, v
2
. . . , v
n
are the input variables and the class variable K is
whether the haplotype is a high risk haplotype or not
(see Fig. 1).
As explained above, the individual risk model is
obtained by multiplying the probability for each ho-
mologous genome-wide haplotype of an individual of
being a high risk one. Therefore, the class variable in
the individual risk model is whether the individual is
affected or not. Thus, the individual risk model can be
considered a recessive genetic model as only if both
genome-wide haplotypes are high risk ones, the indi-
vidual has the disease:
p
i
(a f f ) = p
hi1
(K = high) × p
hi2
(K = high) (1)
with p
i
(a f f ) being the probability for individual i of
being affected, p
hi1
(K = high) being the probability
of the first genome-wide individual haplotype of be-
ing classified as a high risk one and p
hi2
(K = high)
being the probability of the second genome-wide in-
dividual haplotype of being classified as a high risk
one.
Figure 2 shows an example of an individual
haplotype-based risk map. Haplotypes are divided by
chromosomes. High risk variants are plot in red color
while low risk variants are plot in green color. Ho-
mologous chromosomes are shown in the same row.
To make sure about which chromosomes are inher-
ited from which parent, parental genotype informa-
tion from the same genome-wide data set (‘Interna-
tional Multiple Sclerosis Genetics Consortium’ et al.,
2007) was used. For clarity purpose, the map has been
built using only c × 2 relevant loci per chromosome,
with c being the chromosome number. In reality, the
most accurate haplotype-based risk models for MS re-
quire thousand variables, in agreement with a large
collection of data supporting the idea of MS being
a polygenic disease with a few loci with large effect
and thousand of them with small or very small effect
((IMSGC), 2010).
Figure 3 shows the genotype risk map for the hap-
lotype risk map shown in Figure 2. Therefore, every
heterozygous loci (a high risk variant in one chromo-
some and a low risk variant in the other one) are plot
in blue color. Homozygous loci for the low risk vari-
ant are plot in green color and homozygous loci for
the high risk variant are plot in red color.
3 3D RISK MAPS
Opposite to the 2D haplotype and genotype risk maps
shown in Figures 2 and 3, real maps have thousands
of loci that cannot be easily explored. Moreover, their
meaning as maps showing the most important features
of DNA molecules regarding a disease is difficult to
understand as a first view. Finally, they show either
haplotype variants or genotypes but not both in the
same map.
For these three reasons we have designed a 3D
risk map that can be explored using a virtual reality
software that copes with these issues. Therefore, a
biomedical researcher can get immerse inside the map
to better explore it and deal with its large size. In ad-
dition, genotype and haplotype information are dis-
played in a unique map. To achieve this goal and also
BIOINFORMATICS 2012 - International Conference on Bioinformatics Models, Methods and Algorithms
276
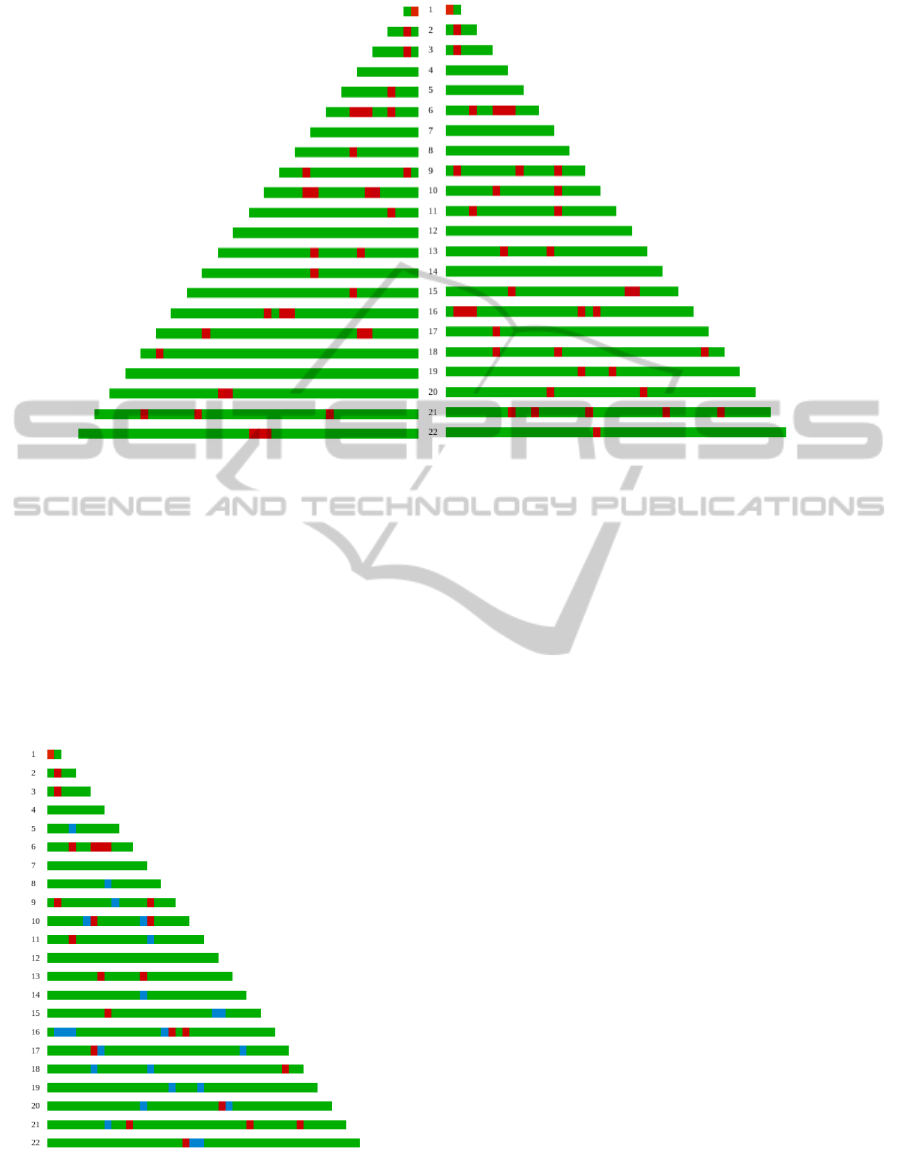
Figure 2: Genome-wide haplotype risk map. Low risk variants are plot in green color while high risk variants are plot in red
color.
make them more intuitive to be understood as a first
view we have designed them in the same double helix
shape of a DNA molecule. However, only one DNA
molecule per chromosome number is needed instead
of a pair of them. Therefore, each helix represents the
information of each homologous chromosome instead
of being just one helix complementary to the other.
Data are shown as nucleic acid base pairs
(A,C,G,T) so that homologous bases bind to each
Figure 3: Genome-wide genotype risk map for the haplo-
type risk map shown in Figure 2. Homozygous loci for high
risk variants are plot in red color. Green color is used for ho-
mozygous loci for low risk haplotypes. Heterozygous loci
(a low and a high risk variant) are plot in blue color.
other forming the double helical structure. Haplotype
data are shown in one side of the plane obtained from
the unrolled helical structure while genotype data are
shown on the other side. High risk haplotypes are col-
ored in red while low risk haplotypes are colored in
green. On the other side of the DNA string (i.e. on
the genotypic risk map), the information of both win-
dows is synthesized, so that the base is green if both
haplotypes are green, same if both haplotypes are red,
and if the individual is heterozygous in that window
(that is, they have a high risk and a low risk haplo-
type), the color of the base is blue. Although the user
will see the map in rotation, a static view of the 3D
map can be seen in Figure 4 (only 5 chromosomes are
shown). This is an example of a real risk map for an
individual with MS.
4 SOFTWARE FEATURES
The main idea was to develop an intuitive, user-
friendly visualization tool which can show the re-
quired genetic information. It is a known fact that
bioinformatic researchers need to learn how to use
many different software in order to extract, process
and analyze genetics data, therefore it is a good idea
to provide an easy tool so that it can be installed and
used without any special requirement or knowledge.
This philosophy has been applied in every aspect
of 3DRiskMapper, the tool for the visualization of 3D
individual risk maps, including the virtual immersion.
The input of the software is a plain text file containing
3D VISUALIZATION OF HAPLOTYPE RISK MAPS
277
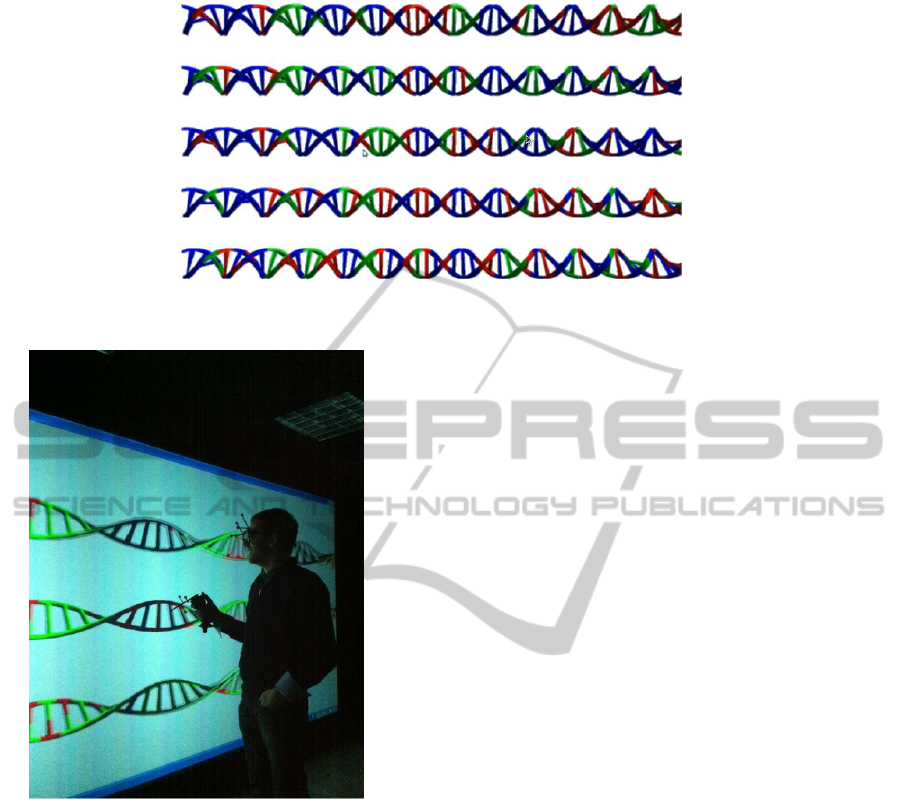
Figure 4: 3D genome-wide individual risk map.
Figure 5: A 3DRiskMapper is being used at the powerwall
of the virtual reality lab (University of Granada).
one row per chromosome. These rows have as many
columns as the number of markers –usually single
nucleotide markers– windows considered for a given
chromosome in a previous disease susceptibility anal-
ysis. This means that the length of a row could not
correspond with the real length of the chromosome,
as it only depends on the number of windows consid-
ered in the analysis, being a window a sequence of
consecutive markers. The numbers in the rows can be
0 or 1, where 0 means that the window configuration
or haplotype for that individual chromosome has been
classified as a risk haplotype, and 1 that it is has been
classified as a protective (or low risk) haplotype. We
decided to use a simple format like this, and any other
type of files can be easily converted to it.
Once 3DRiskMapper checks that the input file has
a correct format, a graphic window containing 3D
representation of each DNA strings (chromosomes)
is displayed. These strings are double helix-shaped,
they have one nucleic base for each window in the
chromosome, and they slowly turn around them-
selves. Also, each side of the strings is colored differ-
ently depending on whether it is a haplotype or geno-
type risk map.
As a double helix is not the best way to visualize
this information, the user can unroll the 3D model,
for an easy examination of the bases. In addition, the
chromosomes can be flipped to change from haplo-
type to genotype risk maps, and the camera move-
ment offers many possibilities, so that it is possible
to scroll the model and zoom it in and out, depending
on how many chromosomes and which sections of the
strings the user wants to examine. The user can also
change color maps depending on the genetic model
selected. Therefore, if a recessive model is used, only
those positions homozygous for the risk allele are
coloured. In the case of a dominant genetic model,
both homozygous positions for the risk allele or het-
erozygous positions are coloured. When an additive
model is selected by the user, homozygous positions
for the risk allele are shown with higher intensity than
heterozygous positions and homozygous positions for
the low-risk allele are not coloured. Another feature
of 3DRiskMapper is that it can be used in an immer-
sive three-dimensional environment, thereby achiev-
ing a better visualization of genetic information.
The software was tested at the laboratory of vir-
tual reality (Universidad de Granada) as it has all
the necessary equipment to get a stereoscopic view
of the chains in 3D. Four systems can be used by
3DRiskMapper at the lab:
1. Haptic Workbench. This immersive workbench is
an active stereo system that shows a 3D image on
a mirror placed just under a CRT monitor, which
is able to display two images (a different image is
BIOINFORMATICS 2012 - International Conference on Bioinformatics Models, Methods and Algorithms
278
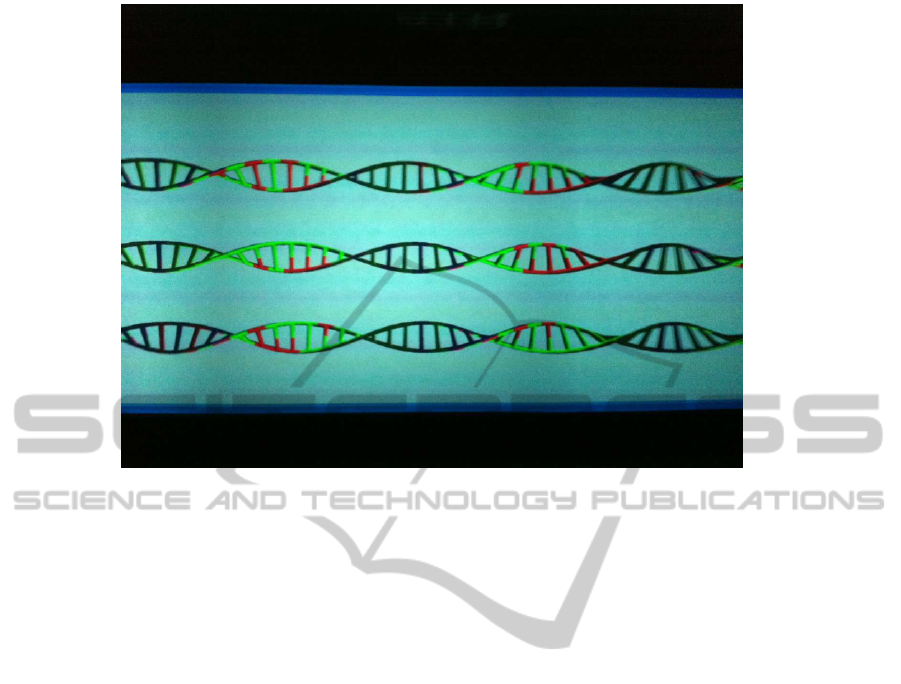
Figure 6: A close-up of a 3DRiskMapper output at the powerwall. Partial image of haplotype 6 for an individual with MS
(top image), one of the individual’s parent (image in the middle) and a healthy individual (bottom image) is being shown.
shown for each eye) at the same time. This mir-
ror reflects the images to an active pair of glasses,
which gives a 3D experience to the user.
2. Workbench Table. This workbench uses passive
stereo by means of glasses with circular polariza-
tion. In this system a beamer projects both images
(left and right eye) on a translucent screen. Addi-
tionally, the system has a tracking device that al-
lows to modify the point of view of the observer.
3. Portable System. This system uses a stereoscopic
back projection with circular polarization. It can
be easily transported in a car.
4. Powerwall. This system is similar to a 3D cin-
ema, but in this case, several beamers project on
the same screen, so the immersion is produced by
stereoscopy. The user wears a pair of 3D passive
stereo glasses. The screen is divided into three
different parts, in such a way that two beamers
project two images for each one. This room is
ideal for presentations and work sessions, where a
group of people can examine and comment the 3D
model easily. The glasses work using linear pro-
jection. Figure 5 shows a picture of a powerwall
where 3DRiskMap is being used. Although a joy-
stick can be used with a powerwall to interact with
the software, the current version of 3DRiskMap-
per does not have this feature and the user needs
to use the keyboard to change the map perspec-
tive, its size or the genetic model. Figure 6 shows
a close-up where a partial view of chromosome 6
for three individuals can be seen.
Every system is especially appropriate for a dif-
ferent scenario. Therefore, whereas the Haptic Work-
bench allows the interaction with the model, the
Workbench Table allows a comfortable visualization
of the model. The Portable System allows to show the
model in different places from the research building,
whereas the Powerwall can help in work groups.
3DRiskMapper has been developed in C++, and
for display purposes, the OpenGL graphics library
has been used. OpenGL, the standard library for 3D
graphics, allows to display 3D images in a special way
to produce 3D immersion. In addition, since the free
distribution is one of the key points of the software,
instead of using the GLUT library, which provides
a windowing application programming interface for
OpenGL, the open source alternative, freeglut, has
been used. Thus, 3DRiskMapper will work in any
platform, as freeglut can be installed in any operating
system. In fact, although the code has been written to
work on Windows, Linux and Mac OS X.
Finally, 3DRiskMapper has not special hardware
requirements for small maps, so that it works in any
computer with an average graphics card, with differ-
ent hardware and operative systems.
If users intend to run the application in a 3D im-
mersive environment, they will need the appropriate
equipment, such as stereoscopic vision goggles or a
haptic device to interact with the maps.
3D VISUALIZATION OF HAPLOTYPE RISK MAPS
279

5 CONCLUSIONS
We have designed a 3D individual map able to
gather the features of the more classic genotype-
based risk maps with the more recent and accurate
haplotype-based risk maps. We have also developed
3DRiskMapper, a software application able to build a
3D risk map and provide the user with a virtual reality
interface so that they can get immerse in these usually
very large maps to explore them.
3D risk maps combine haplotype and genotype in-
formation in order to identify risk loci and therefore
the risk a individual has to a disease. They constitute a
a purelly visual tool provided to biomedical analysts.
We believe this tool is very important to reduce the
complexity in accessing, analysing and manipulating
result data from association studies.
As a future work, 3DRiskMapper may be en-
hanced with a more intuitive user interface, so that
users can interact in a very natural way, i.e. with their
own hands to unroll and rotate the helixes with the
information of risk loci. Maps enriched with infor-
mation from different annotation sources may fully
benefit of this 3D immersive feature.
6 WEB RESOURCES
The software is developed as open code under GNU
Public License 3.0 and can be downloaded from
http://bios.ugr.es/3DRiskMapper.
ACKNOWLEDGEMENTS
The authors were supported by the Spanish Research
Program under project TIN2010-20900-C04, the An-
dalusian Research Program under project P08-TIC-
03717 and the European Regional Development Fund
(ERDF).
REFERENCES
Abad-Grau, M., Medina-Medina, N., Masegosa, A., and
Moral, S. (2011a). Haplotype-based classifiers to pre-
dict individual susceptibility to complex diseases. In
Proceedings of BIOINFORMATICS 2012 - Interna-
tional Conference on bioinformatics Models, Methods
and Algorithms, volume 1.
Abad-Grau, M., Medina-Medina, N., Montes-Soldado, R.,
Matesanz, F., and Bafna, V. (2011b). Sample repro-
ducibility of genetic association using different multi-
marker tdts in genome-wide association studies: Char-
acterization and a new approach. PLoS ONE, ac-
cepted.
Evans, D., Visscher, P., and Wray, N. (2009). Harness-
ing the information contained within genome-wide as-
sociation studies to improve individual prediction of
complex disease risk. Human Molecular Genetics,
18:3525–31.
(IMSGC), I. M. S. G. C. (2010). Evidence for poly-
genic susceptibility to multiple sclerosis - the shape
of things to come. Am J Hum Genet, 86:621–5.
‘International Multiple Sclerosis Genetics Consortium’,
D. H., Compston, A., Sawcerand, S., Lander, E., Daly,
M., Jager, P. D., de Bakker, P., Gabriel, S., Mirel, D.,
Ivinsonand, A., Pericak-Vance, M., Gregory, S., Ri-
oux, J., McCauley, J., Haines, J., Barcellos, L., Cree,
B., Oksenberg, J., and Hauser, S. (2007). Risk alle-
les for multiple sclerosis identified by a genomewide
study. New England Journal of Medicine, 357(9):851–
62.
Jager, P. D., Chibnik, L., Cui, J., Reischl, J., Lehr, S., Si-
mon, K., Aubin, C., Bauer, D., Heubach, J., Sand-
brink, R., Tyblova, M., Lelkova, P., ’Steering com-
mittee of the BENEFIT study, committee of the BE-
YOND study’, S., committee of the LTF study’, S.,
committee of the CCR1 study’, S., E, E. H., Pohl, C.,
Horakova, D., Ascherio, A., Hafler, D., and Karlson.,
E. (2009). Integration of genetic risk factors into a
clinical algorithm for multiple sclerosis susceptibil-
ity: a weighted genetic risk score. Lancet Neurol.,
8(12):1111–9.
Sebastiani, P., Abad-Grau, M. M., and Ramoni, M. F.
(2010). Data mining and knowledge discovery hand-
book, Oded Maimon and Lior Rokach (eds.), chapter
Bayesian Networks, pages 175–208. Springer.
Sebastiani, P., Ramoni, M. F., Nolan, V., Baldwin, C. T., and
Steinberg, M. H. (2005). Genetic dissection and prog-
nostic modeling of overt stroke in sickle cell anemia.
Nature Genetics, 37:435–440.
Torres-S
´
anchez, S., Medina-Medina, N., Montes-Soldado,
R., Masegosa, A. R., and Abad-Grau, M. M. (2011).
Riskoweb: Web-based genetic profiling to complex
disease using genome-wide snp markers. In Rocha,
M. P., Corchado, J. M., Fdez-Riverola, F., and Va-
lencia, A., editors, Proceedings of the 5th Interna-
tional Conference on Practical Applications of Com-
putational Biology & Bioinformatics (PACBB 2011),
volume 1, pages 1–8.
Wang, J., D, D. P., Jager, P. D., Pelletier, D., de Bakker,
P., Kappos, L., Polman, C., ‘Australian, (ANZgene)’,
N. Z. M. S. G. C., Chibnik, L., Hafler, D., Matthews,
P., Hauser, S., Baranzini, S., and Oksenberg, J.
(2011). Modeling the cumulative genetic risk for
multiple sclerosis from genome-wide association data.
Genome Medicine, 3:3.
Wray, N., Goddard, M., and Visscher, P. (2003). Predic-
tion of individual genetic risk to disease from genome-
wide association studies. Genome Research, 17:1520–
28.
BIOINFORMATICS 2012 - International Conference on Bioinformatics Models, Methods and Algorithms
280
