
THE COMBINATION OF HMAX AND HOGS IN AN ATTENTION
GUIDED FRAMEWORK FOR OBJECT LOCALIZATION
Tobias Brosch and Heiko Neumann
Institute of Neural Information Processing, Ulm University, Ulm, Germany
Keywords:
Combination of HMAX and HOGs, Attention, Object localization, Performance evaluation.
Abstract:
Object detection and localization is a challenging task. Among several approaches, more recently hierarchical
methods of feature-based object recognition have been developed and demonstrated high-end performance
measures. Inspired by the knowledge about the architecture and function of the primate visual system, the
computational HMAX model has been proposed. At the same time robust visual object recognition was
proposed using feature distributions, e.g. histograms of oriented gradients (HOGs). Since both models build
upon an edge representation of the input image, the question arises, whether one kind of approach might be
superior to the other. Introducing a new biologically inspired attention steered processing framework, we
demonstrate that the combination of both approaches gains the best results.
1 INTRODUCTION
Finding objects in images is a key task for a variety of
important applications. The visual input stream pro-
vides various features among which edges serve as
powerful clues for object detection. Exploiting edge
maps, hierarchical methods of feature-based object
recognition have recently been developed and demon-
strated high-end performance measures. Inspired by
the known function and architecture of the primate vi-
sual system, the computational HMAX model (Serre
et al., 2005; Mutch and Lowe, 2008) has been pro-
posed. At the same time robust visual object recogni-
tion was proposed using histograms of oriented gra-
dients (HOGs) (Dalal and Triggs, 2005). Since both
models build upon an edge representation of the in-
put image, we explore, whether one kind of feature is
superior to the other.
• The HMAX mechanism constitutes a hierarchical
model applying iteratively mechanisms of feature
combination and pooling. It compares small parts
of an intermediate representation in a template
like fashion to obtain individual features (Mutch
and Lowe, 2008).
• In contrast to the template matching applied in the
HMAX model, the HOGs describe local distribu-
tions of features derived from the input, namely
contrasts in the luminance image. These distribu-
tions are calculated for regular-subdivision in in-
put images and normalized by the distributions in
the discretized neighborhood. HOGs thus can be
considered as a likelihood of the presence of cer-
tain structure and its distribution in the input data.
Though being quite different in their processing na-
ture, both mechanisms provide some scale and po-
sition invariance and build upon an initial edge rep-
resentation of the input scene. We explore whether
the two feature types constitute in a similar way to
the classification result or if they significantly facil-
itate each other when used in combination. This
exploration is done proposing a generic coarse-to-
fine framework for object localization utilizing sev-
eral standard techniques of past research. It suggests a
systematic way to combine multiple processing chan-
nels which are by no means limited to the features
used in this work. To compare it with previous results,
evaluation is done on two different datasets consisting
of different object types. We demonstrate state of the
art performance on a car data set presented in (Agar-
wal et al., 2004a) and show that it is also suited for dif-
ferent object categories such as pedestrian on a subset
of the very challenging Daimler Pedestrian set (En-
zweiler and Gavrila, 2009). The results demonstrate
that neither feature type alone represents a complete
description of the input and that classification signifi-
cantly benefits from the combination of both types.
The remaining part of this paper is organized as
follows: We describe the novel framework of object
localization in section 2, the data sets are presented
281
Brosch T. and Neumann H. (2012).
THE COMBINATION OF HMAX AND HOGS IN AN ATTENTION GUIDED FRAMEWORK FOR OBJECT LOCALIZATION.
In Proceedings of the 1st International Conference on Pattern Recognition Applications and Methods, pages 281-288
DOI: 10.5220/0003708702810288
Copyright
c
SciTePress

in section 3, results are shown in section 4 and finally
we discuss the results and the connection to previous
work in section 5.
2 ARCHITECTURE
The overall architecture is described in two parts:
1. The basic processing framework combining
HMAX and HOGs (histogram of oriented gradi-
ents) features to end up with an assembly of view
tuned units (VTUs) indicating presence of a target
object at a given location and scale.
2. An attention guided region of interest (ROI) se-
lector component inspired by the architecture of
(Hamker, 2005). It combines coarse-to-fine pro-
cessing (Schyns and Oliva, 1994) and the idea
of cascaded classifiers (Viola and Michael, 2001;
Zhu et al., 2006; Heisele et al., 2001) to focus pro-
cessing on relevant parts of the input scene.
The suggested processing framework is illustrated in
Figure 1.
2.1 Preprocessing
The processing starts with a two-level hierarchy. In
addition to plain edge detection using a Gabor stage,
we introduce a normalization step to compensate dif-
ferent illumination conditions of the input image I by
a center surround normalization mechanism given by
I
norm
=
I − G
σ
∗ I
1 + I + G
σ
∗ I
, (1)
where G
σ
is a Gaussian with standard deviation σ = 2
and the operator ∗ denotes the spatial convolution op-
erator. The resulting activities are mapped to a range
of [0, 1]. The edges are extracted by the convolution
of I
norm
with 2D-Gabor-filters of six different orienta-
tions to generate pairs of oriented response maps. The
Gabor filters are described by
G(x,y) =
1
2πσ
2
exp
−
1
2
x
2
+ y
2
σ
2
·
exp
2πi f
0
x
x
,
(2)
where f
0
x
= 0.25 pixels and σ is chosen for half-
magnitude overlap of adjacent Gabor-envelopes (ro-
tated for different orientations). Last, the energy
response of the complex-valued Gabor-responses
(i.e. the absolute value of the complex filter response)
forms the S1 layer activities which define an (x, y, θ)-
space that is input for further processing along two
parallel streams, namely HMAX and HOGs.
2.2 Selective Feature Channels
After the S1 stage, processing splits into two streams
composed of the different feature processing ap-
proaches, namely HMAX and HOGs respectively. A
discussion of their function follows below.
• HMAX: To provide better comparability to the
single scale HOGs features (see below), we de-
cided to employ a single scale HMAX scheme in
contrast to the multiple scales and max-pooling
across scales in (Mutch and Lowe, 2008). For
completeness, we briefly summarize the process-
ing steps of their approach which aim to pro-
vide a certain amount of position and scale in-
variance by iterative application of feature com-
bination (simple cells “S”) and pooling mecha-
nisms (complex cells “C”): Layer C1 responses
are computed using max-filtering on the S1-layer
(Gabor-filter responses) of size 3 × 3. During
training small patches P of size n × n × p
s
, n ∈
{4,8,12,16}, p
s
= 6 (p
s
is the number of edge
orientations) are extracted from this layer, then
sparsified, rated and selected by the classifier.
During testing, a patch P is compared to each re-
gion X of C1 units using a Gaussian radial ba-
sis function to obtain a similarity estimate of each
patch:
R(X,P) = exp
−
kP − Xk
2
2ασ
2
, (3)
As in (Mutch and Lowe, 2008) the standard devi-
ation σ is set to 1. To compensate for the effect
of comparison in the higher dimensional space in
the case of n ∈ {8,12,16}, the normalization fac-
tor α is set to α = (n/4)
2
. The maximal response
of a patch in a small neighborhood of its origi-
nal position in its training image forms an entry in
the C2 feature vector. Depending on the searched
scale of a target object (i.e. search for a near or
distant object) the neighborhood is adjusted. We
set the neighborhood arbitrarily to 10% of the es-
timated object size (given by the dataset) which
seems to work well. This results in different C2
layers (red, green and blue ellipses in Figure 1),
each layer representing an (x,y, f ) space, where f
is the number of patches or, more generally, the
number of features.
• HOGs: We chose the basic variant of HOG fea-
tures using square cells and square blocks adopt-
ing the best parameters as described in (Dalal and
Triggs, 2005) (for the pedestrian set we adopted
parameters from (Enzweiler and Gavrila, 2009)).
To allow for better comparison, we chose the same
input (the previously described S1 stage) to both
ICPRAM 2012 - International Conference on Pattern Recognition Applications and Methods
282
S1
Input Image
C1
S2
C2
HOGs HMAX
VTUs
car
...
max
mean
Preprocessing
Orientation Selective
Responses
Energy Response
max
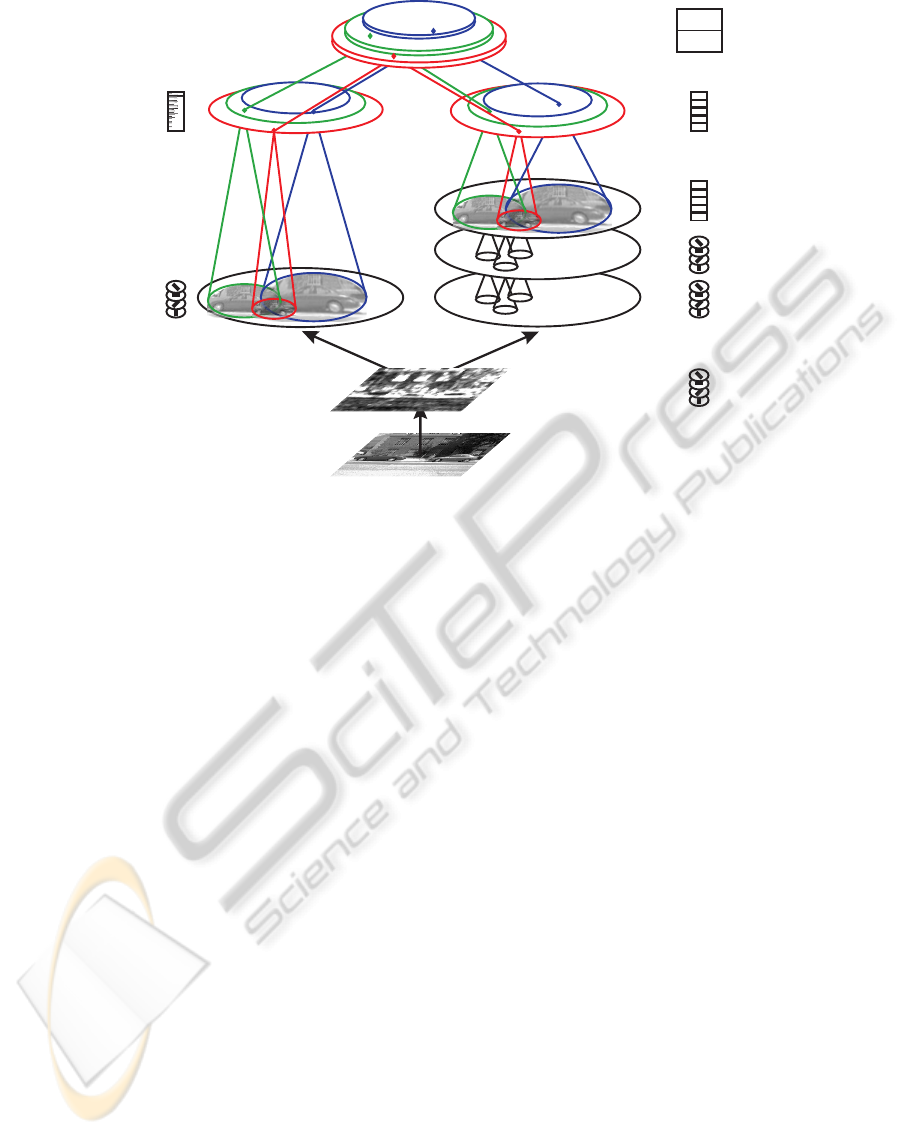
Figure 1: General architecture: The input image is preprocessed and Gabor filtered (layer S1). Subsequent processing results
in a feature vector of two different types of features (layer C2, big red ellipses correspond to all locations of small target
objects, small blue ellipses to all possible locations of large target objects) at each possible location and scale of a target
object. The right side illustrates the HMAX processing, the left side the creation of the HOG features. The final stage of
the processing cascade is formed by view tuned units (VTUs). These encode the likelihood of the presence of a target object
at a given location and scale (e.g. likelihood of presence of a car). Please note, that for the purpose of better readability, we
omitted the component of attentional guidance (please see text section 2.4).
feature types, HMAX and HOGs. Note, how-
ever, that according to (Dalal and Triggs, 2005)
the common S1 layer (which is chosen to allow
comparability to the HMAX features) might not
be optimal for HOG features due to the slightly
smoothing nature of a Gabor filter. The scene is
split into small cells of size 6 × 6 pixels across
all orientations. For each orientation the mean is
taken and normalized across the 3 × 3 neighbor-
ing cells (so called blocks) using L2 normaliza-
tion. Similar to adjusting the neighborhood in the
HMAX processing stream, we adjusted cell size
to end up with the same number of features at each
scale (i.e. the layers searching for near and distant
objects; red, green and blue circles in Figure 1).
In analogy to the HMAX stream, the computa-
tions yield a similar C2 layer structure, wherein
each layer represents an (x,y, f ) space.
2.3 Channel Fusion and View-tuned
Representations
The final stage for feature processing is formed by
View Tuned Units (VTUs) (Riesenhuber and Poggio,
1999a; Riesenhuber and Poggio, 1999b; Jiang et al.,
2006). A VTU encodes the likelihood of presence of
a certain object at its position and scale (e.g. a VTU at
the center for large objects specialized for cars). Once
the activity of each VTU is known the most likely
presence of an object is given by the correspond-
ing object-VTU having maximal activity. To obtain
a suitable measure of object presence, we chose an
early fusion mechanism (i.e. the combination of our
intermediate C2 feature vectors of each feature type
at each position and scale forms the input to a classi-
fier. The activity of a VTU at this location and scale
is then given by the output of the classifier). In con-
trast to a late fusion mechanism, which directly results
in VTUs (or another intermediate representation) for
each feature type, the early fusion variant employed
here has the advantage that no additional fusion mech-
anism for this second intermediate level is required.
2.4 Attention Guided Region of Interest
Selector Framework
The extensive search of a large input scene using a
strong classifier at several locations leads to an unfa-
vorable computational cost. In order to reduce those
costs we apply several concepts and principles of
THE COMBINATION OF HMAX AND HOGS IN AN ATTENTION GUIDED FRAMEWORK FOR OBJECT
LOCALIZATION
283

computational mechanisms that have been success-
fully employed in previous work.
• Coarse-to-Fine Processing (CtF). Experimental
investigations have shown that early visual pro-
cessing in humans is dominated by coarse fea-
tures in contrast to fine grained details which seem
to dominate later processing stages (Schyns and
Oliva, 1994). From a computational point of
view, several studies applied the principle of CtF
processing and reported significant benefits, e.g.
(Pedersoli et al., 2010; Amit et al., 2004).
• Cascaded Classifiers. Recent approaches
showed that the computational cost of extensive
object search can be greatly reduced by applying
a cascade of detectors (Viola and Michael, 2001;
Zhu et al., 2006; Heisele et al., 2001). Iteration
of a process that allows to discard many locations
from further processing at an early stage greatly
reduces processing time while maintaining a high
classification rate.
• Inhibition of Return and Neighborhood Sup-
pression (IOR-Nsupp). Once a suspected or fi-
nal target position is found the surrounding re-
gion can be suppressed, enabling the detection of
further candidate locations (IOR) and sparsifying
the amount of locations to be searched (Nsupp).
This can be formulated in a dynamic framework
(Hamker, 2005) as well as in a static context
(Agarwal et al., 2004a; Mutch and Lowe, 2008).
We apply the neighborhood suppression described
in (Agarwal et al., 2004a) with the parameters of
(Mutch and Lowe, 2008).
Our attention guided region of interest selector frame-
work combines elementary principles of each of these
three mechanisms: We use a simple cascade of two
classifiers which already resulted in promising results
(this can be extended to support multiple resolution
layers as well as multiple classifiers). The first classi-
fier is applied only on the features obtained from the
input image that has been downsampled to a quarter
of the original resolution (CtF processing). To pre-
vent that possible target locations are discarded, the
early stage classifier output behavior is biased to a
low rejection rate which can be trained and set to a
desired false rejection rate (Viola and Michael, 2001;
Zhu et al., 2006; Heisele et al., 2001). To evaluate
the VTU responses, we apply the IOR-Nsupp mech-
anism to identify target locations of the next classi-
fier which is applied on the features of the full resolu-
tion input (at this level experimental evaluation sug-
gested 60% of the neighborhood suppression of the
final classification stage to facilitate a low rejection
rate). After the final classifier is applied, object loca-
tion estimates are created under consideration of the
IOR-Nsupp mechanism.
3 TEST SETS
The evaluation of the proposed model is done on two
different data sets. We chose the UIUC car data set
(Agarwal et al., 2004a) to compare our model to the
results presented in (Mutch and Lowe, 2008). To
demonstrate generalizability to a different kind of ob-
jects we took a subset of the very challenging Daim-
ler Pedestrian data set (Enzweiler and Gavrila, 2009).
Please note, that we chose a one layered architecture
of HMAX and that the edge input to HOGs are subop-
timal according to (Dalal and Triggs, 2005) in order
to allow direct comparability between the two feature
types. Consequently the performance of each feature
type might suffer a bit compared to the optimal im-
plementation.
3.1 UIUC Car Data Set
Figure 2 shows some sample images of the UIUC car
data set (Agarwal et al., 2004a). It contains images
of side views of cars for use in evaluating object de-
tection algorithms. It comprises 1,050 training im-
ages, a single-scale test sequence and 108 multi-scale
test images containing 139 cars at various scales and
some evaluation files (Agarwal et al., 2004b). We will
concentrate on the multiple scales test sequence since
our model achieved almost perfect results on the sin-
gle scale scenario like reported in (Mutch and Lowe,
2008). The evaluation program of (Agarwal et al.,
2004b) results in three measures, namely recall, pre-
cision and F-measure (the harmonic mean of preci-
sion and recall).
Table 1: Symbols used in defining performance mea-
surement quantities with their accompanying meanings
(cf. (Agarwal et al., 2004a)).
symbol
meaning
T P Number of true positives
FP Number of false positives
FN Number of false negatives
nP Total number of positives in data set
(nP = T P + FN)
Using the notation of table 1, these are defined as
Rec =
T P
T P + FN
=
T P
nP
,
ICPRAM 2012 - International Conference on Pattern Recognition Applications and Methods
284

Figure 2: Sample images of the car data set of (Agarwal et al., 2004a). First row: test images containing side-views of cars at
multiple scales. Second row: left: negative training images, right: positive training images.
Prec =
T P
T P + FP
,
F-measure =
2 · Rec · Prec
Rec + Prec
.
(4)
It is only when both recall and precision have high
values that the F-measure is close to one.
3.2 Daimler Pedestrian Data Set
Figure 3 visualizes some of the images of the Daim-
ler benchmark (Enzweiler and Gavrila, 2009). The
training set contains 15,560 pedestrian samples and
6,744 full images not containing any pedestrians. The
test sequence consists of 21,790 images with 56, 492
pedestrian labels. It was captured from a vehicle dur-
ing a 27 min drive through urban traffic at a resolution
of 640× 480 pixels. Only pedestrians of a height of at
least 72 pixels must be detected. Detection of smaller
pedestrians, partially occluded pedestrians, cyclists,
etc. are optional and are not counted as detection or
false positive. Using the ratio of intersection area and
union area of the bounding boxes of a system alarm
a
i
and a ground-truth event e
j
Γ(a
i
,e
j
) =
A(a
i
∩ e
j
)
A(a
i
∪ e
j
)
, (5)
a correct detection is given if Γ(a
i
,e
j
) > 0.25.
Due to computational resource constraints we
trained our model on only 5,000 positive and 5, 000
negative training images without any bootstrapping
and evaluated it on the 1,846 images containing at
least one pedestrian of at least 72 pixels height.
4 RESULTS
4.1 Feature Types
We pose the question whether HMAX or HOGs fea-
tures encode the same information or whether they
provide supplementary information and thus mutually
support for each other. This question is quite difficult
to answer. From a theoretical point of view, HOGs
as well as HMAX features consist of an assembly of
nonlinear operations which are hard to compare. Thus
we concentrate on an experimental evaluation. Per-
forming initial tests using three different classifiers
(AdaBoost (Freund and Schapire, 1997) using a de-
cision tree classifier, Gaussian kernel SVM and lin-
ear SVM
1
we chose a linear SVM classifier which
constantly resulted in good classification results at a
reasonable training and classification time. We did
a systematic evaluation of three different variants of
the suggested architecture, the fusion of processing
channels (full model, see Figure 1) and ones with
only one channel being active. Based on these re-
sults, we found that it is the combination of HMAX
and HOGs features that results in the best perfor-
mance compared to either feature type alone (Table 2
shows the results along with comparable previous re-
sults. (Lampert et al., 2008) reported a F-measure of
98.6%. However, they used a spatial pyramidal struc-
ture that does not compare well to our single scale
variant which allows for comparison with HMAX fea-
tures). Taking into account the standard deviation, the
performance gain is significant. To exclude the pos-
sibility of a wrong classification bias, we calculated
a precision-recall curve which is displayed in Figure
4. It clearly shows that the combination of HMAX
and HOGs channels performs best compared to either
channel alone.
To assure independence of the evaluated data set,
we applied our model to the task of pedestrian detec-
tion using a subset of the challenging Daimler Pedes-
trian set (see section 3.2). We just adjusted the HOG
parameters to those given in (Enzweiler and Gavrila,
2009) choosing a scale factor of 1.25 (most similar to
their parameter set S
6
) and left everything else identi-
1
See (Fradkin and Muchnik, 2006) for more details on
support vector machine classifiers; we used the implemen-
tation of (Fan et al., 2008).
THE COMBINATION OF HMAX AND HOGS IN AN ATTENTION GUIDED FRAMEWORK FOR OBJECT
LOCALIZATION
285
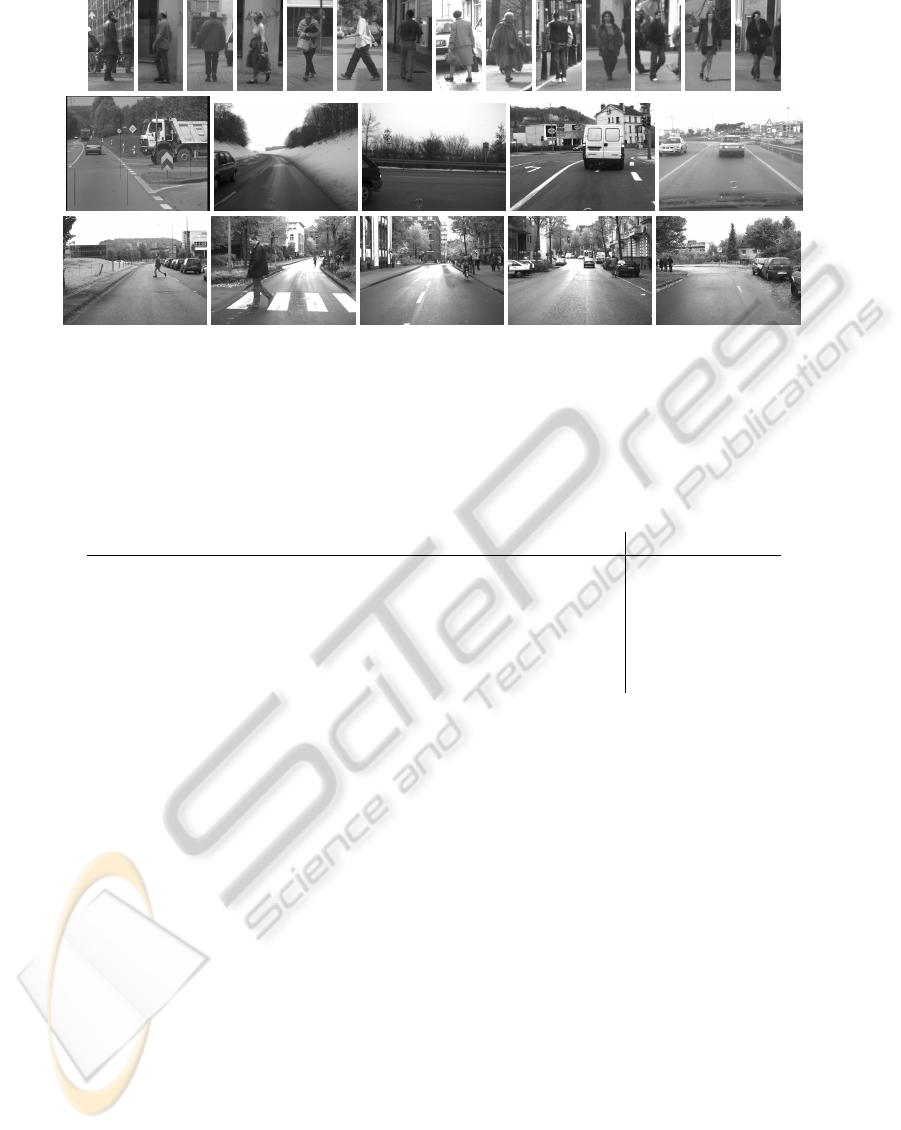
Figure 3: Sample images of the pedestrian data set of (Enzweiler and Gavrila, 2009). First row: positive training images,
second row: images containing no pedestrians to generate negative training images and third row: test images.
Table 2: Results on the multiple scales car detection task (at Recall=Precision=F-measure). Scores of our model are the
average of 8 independent runs along with standard deviation. Scoring methods were those of (Agarwal et al., 2004a). Note
that despite the lower classification rate of our simplified HMAX model compared to (Mutch and Lowe, 2008) and the
suboptimal input to the HOG features (to provide comparability), the feature combination of HMAX and HOGs features
compensates for it.
Model Performance
Agarwal et al. (Agarwal et al., 2004a) 39.6%
Fritz et al. (Fritz et al., 2005) 87.8%
Mutch & Lowe (Mutch and Lowe, 2008) (sophisticated HMAX) 90.6%
Our model (only HMAX) 84.08% ± 1.4%
Our model (only HOGs) 68.35%
Our model (HMAX&HOGs) 90.83% ± 1.2%
cal. Due to computational constraints we limited our-
selves to a subset of the very large dataset presented
in (Enzweiler and Gavrila, 2009) with still consider-
able extent (see section 3.2 for details, evaluation took
multiple weeks of CPU-time). To allow for compari-
son with the results of (Enzweiler and Gavrila, 2009)
we supplemented the precision measure by the false
positives per frame measure. The resulting false pos-
itives per frame-recall curve is visualized in Figure 5.
This confirms that the combination of features gains
best performance.
4.2 Region of Interest Selector
Variations
In section 2.4 we presented a novel region of interest
selector framework combining several state of the art
techniques. In addition to the examination of HMAX
and HOGs features we explored the impact of the
different processing stages of our coarse-to-fine ar-
chitecture. We compared four configurations of our
novel model:
1. The entire Coarse to Fine model as described in
section 2.
2. The model using only the Coarse resolution part.
3. A variant of processing the entire image at its
Coarse and Fine level (i.e. no selective process-
ing on the high resolution part is done).
4. The model using only the Fine resolution part thus
omitting the coarse level and its contribution.
Results are visualized in Figure 6. It shows that each
resolution level itself does not perform as well as the
model variants using both resolution levels. The two
variants using both resolution levels (i.e. the Coarse
and Fine and Coarse-to-Fine variants) perform almost
identically. This demonstrates that the coarse infor-
mation is sufficient to arouse attention to the relevant
target locations. Even more interesting is the signif-
icant benefit of the Coarse-to-Fine architecture. The
measured processing time of the high resolution fea-
tures of the Coarse-to-Fine variant is just about 15%
of the processing time of the Coarse and Fine variant.
Of course the processing can be highly parallelized.
ICPRAM 2012 - International Conference on Pattern Recognition Applications and Methods
286
0 0.1 0.2 0.3 0.4
0.6
0.65
0.7
0.75
0.8
0.85
0.9
0.95
1
1−Precision
Recall
Precision−Recall−Curve UIUC Car Data Set
HMAX and HOGs
HMAX
HOGs
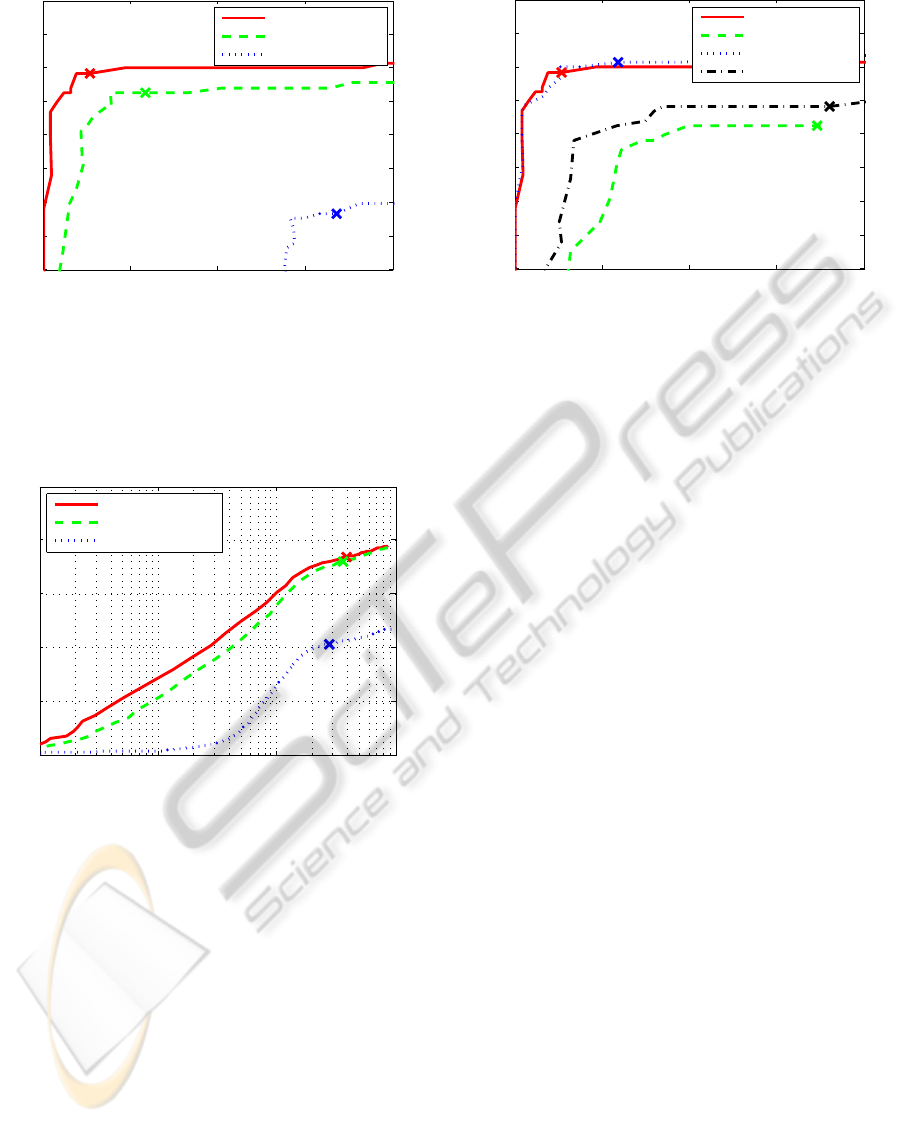
Figure 4: Precision-recall curves of the combination of
HMAX and HOG features in comparison to classification
results using either feature alone on the UIUC car data set.
The “X” marks the system output without any bias. Note,
that for the sake of comparison, the input to the HOG fea-
tures is not optimal.
10
−2
10
−1
10
0
10
1
0
0.2
0.4
0.6
0.8
1
False Positives Per Frame
Recall
Precision−Recall−Curve Daimler Pedestrian Subset
HMAX and HOGs
HMAX
HOGs
Figure 5: False positives per frame-recall curves of the com-
bination of HMAX and HOG features in comparison to
classification results using either feature alone on a subset
of the Daimler Pedestrian set. The “X” marks the system
output without any bias (note that only a subset was used
for training as well as testing; compare to (Enzweiler and
Gavrila, 2009) their Figure 6d subset S
6
).
However, even if one had unlimited parallel process-
ing resources, the architecture significantly limits the
amount of used data. A course resolution image is
sufficient to predict target locations with a high pre-
cision. This can be very handy in a surveillance sce-
nario there a large region can be watched using a wide
angle camera. A controllable camera can then focus
on relevant parts of the scene and confirm respectively
decline presence of an object at this location.
0 0.1 0.2 0.3 0.4
0.6
0.65
0.7
0.75
0.8
0.85
0.9
0.95
1
1−Precision
Recall
Precision−Recall−Curve UIUC Car Data Set
Coarse-to-Fine
Coarse
Coarse and Fine
Fine
Figure 6: Precision-recall curves of the proposed coarse-to-
fine architecture in comparison to components of it on the
UIUC car data set.
5 DISCUSSION
Among several approaches, more recently local fea-
ture descriptors based on edge maps demonstrated
high-end performance measures. We explored the
combination of two commonly used feature descrip-
tors for object detection and localization and our re-
sults show that it is worth investigating feature combi-
nations from hierarchical feature processing based on
filtering and max-selection (HMAX) as well as fea-
ture distributions (HOGs). Our research demonstrates
that (though being based on the same input) both
feature types facilitate each other and result in im-
proved classification performance in different tasks.
Despite using only simple variants of two different
processing variants based on the same kind of im-
age features (edges) at only two different spatial res-
olutions, we showed state of the art performance on
the UIUC car data set (Agarwal et al., 2004a). The
simplified basic variants of the feature descriptors
were chosen to provide comparibility between the two
kinds of feature descriptors. Consequently, all re-
sults can be further improved by using the complete
models as described in the given literature. In addi-
tion, we presented a novel general architecture com-
bining elementary principles of previous work in a
schematic way that eases extensions in several direc-
tions. We demonstrate significant benefits of each of
the applied mechanisms. The proposed architecture is
meant to serve as a general framework combining dif-
ferent optimization techniques of classification, com-
putational cost reduction as well as combination of
different feature types (e.g. coarse-to-fine processing,
classifier cascades, neighborhood suppression). It is
THE COMBINATION OF HMAX AND HOGS IN AN ATTENTION GUIDED FRAMEWORK FOR OBJECT
LOCALIZATION
287

easily extendable by a more advanced classifier cas-
cade (e.g. (Viola and Michael, 2001)) or a cascade of
increasingly more complex classifiers (e.g. (Heisele
et al., 2001)). These in turn could be combined with
efficient subwindow search techniques (e.g. (Lampert
et al., 2008; An et al., 2010)). We demonstrated the
combination of two feature types. However, in the
same way the two feature types have been combined,
it can easily be extended by an arbitrary number of ad-
ditional features. We think that the presented results
encourage further investigations in this direction and
we will investigate ways of incorporating additional
features based on, for example, motion, depth clues,
color, etc.
ACKNOWLEDGEMENTS
We thank the five reviewers for their comments to im-
prove the manuscript. T.B. is supported by a scholar-
ship from the Graduate School of Mathematical Anal-
ysis of Evolution, Information, and Complexity at
Ulm University. H.N. and T.B. are supported in part
by the Transregional Collaborative Research Centre
SFB/TRR 62 “Companion-Technology for Cognitive
Technical Systems” funded by the German Research
Foundation (DFG). We greatly appreciate the compu-
tational ressources provided by the (bwGRID, 2011).
REFERENCES
Agarwal, S., Awan, A., and Roth, D. (2004a). Learning
to Detect Objects in Images via a Sparse, Part-Based
Representation. TPAMI, 26(11):1475–1490.
Agarwal, S., Awan, A., and Roth, D. (2004b). UIUC
Image Database for Car Detection download page.
http://l2r.cs.uiuc.edu/∼cogcomp/Data/Car/. [Online;
accessed 27-Mar.-2010].
Amit, Y., Geman, D., and Fan, X. (2004). A Coarse-to-
Fine Strategy for Multiclass Shape Detection. TPAMI,
26(12):1606–21.
An, S., Peursum, P., Liu, W., Venkatesh, S., and Chen,
X. (2010). Exploiting Monge Structures in Optimum
Subwindow Search. In CVPR.
bwGRID (2011). member of the German D-Grid
initiative, funded by the Ministry for Education
and Research (Bundesministerium f
¨
ur Bildung und
Forschung) and the Ministry for Science, Research
and Arts Baden-Wuerttemberg (Ministerium f
¨
ur Wis-
senschaft, Forschung und Kunst Baden-W
¨
urttem-
berg). http://www.bw-grid.de. [Online; accessed 13-
Apr.-2011].
Dalal, N. and Triggs, B. (2005). Histograms of Oriented
Gradients for Human Detection. In CVPR, volume 1,
pages 886–893.
Enzweiler, M. and Gavrila, D. M. (2009). Monocu-
lar Pedestrian Detection: Survey and Experiments.
TPAMI, 31(12):2179–95.
Fan, R., Chang, K.-W., Hsieh, C.-J., Wang, X.-R., and Lin,
C.-J. (2008). LIBLINEAR: A Library for Large Lin-
ear Classification. JMLR, 9:1871–1874.
Fradkin, D. and Muchnik, I. (2006). Support Vector Ma-
chines for Classification. DIMACS Series in Dis-
crete Mathematics and Theoretical Computer Science,
70:13–20.
Freund, Y. and Schapire, R. E. (1997). A Decision-
Theoretic Generalization of On-Line Learning and an
Application to Boosting. Journal of Computer and
System Sciences, 55:119–139.
Fritz, M., Leibe, B., Caputo, B., and Schiele, B. (2005).
Integrating Representative and Discriminative Models
for Object Category Detection. In ICCV.
Hamker, F. H. (2005). The Emergence of Attention by
Population-based Inference and its Role in Distributed
Processing and Cognitive Control of Vision. Com-
puter Vision and Image Understanding, 100:64–106.
Heisele, B., Serre, T., Mukherjee, S., and Poggio, T. (2001).
Feature Reduction and Hierarchy of Classifiers for
Fast Object Detection in Video Images. In CVPR.
Jiang, X., Rosen, E., Zeffiro, T., Vanmeter, J., Blanz, V., and
Riesenhuber, M. (2006). Evaluation of a Shape-Based
Model of Human Face Discrimination using FMRI
and Behavioral Techniques. Neuron, 50(1):159–72.
Lampert, C. H., Blaschko, M. B., and Hofmann, T. (2008).
Beyond Sliding Windows: Object Localization by Ef-
ficient Subwindow Search. In CVPR, pages 1–8.
Mutch, J. and Lowe, D. G. (2008). Object Class Recogni-
tion and Localization using sparse Features with lim-
ited Receptive Fields. IJCV, 80(1):45–57.
Pedersoli, M., Gonz
`
alez, J., Bagdanov, A. D., and Vil-
lanueva, J. J. (2010). Recursive Coarse-to-Fine Local-
ization for fast Object Detection. In ECCV, volume 6.
Riesenhuber, M. and Poggio, T. (1999a). Are Cortical Mod-
els Really Bound by the “Binding Problem”? Neuron,
24:87–93.
Riesenhuber, M. and Poggio, T. (1999b). Hierarchical Mod-
els of Object Recognition in Cortex. Nature Neuro-
science, 2(11):1019–1025.
Schyns, P. G. and Oliva, A. (1994). From Blobs To Bound-
ary Edges: Evidence for Time- and Spatial-Scale-
Dependent Scene Recognition. Psychological Sci-
ence, 5(4):195–200.
Serre, T., Wolf, L., and Poggio, T. (2005). Object Recog-
nition with Features inspired by Visual Cortex. In
CVPR, pages 994–1000.
Viola, P. and Michael, J. (2001). Rapid Object Detection us-
ing a Boosted Cascade of Simple Features. In CVPR.
Zhu, Q., Avidan, S., Yeh, M.-C., and Cheng, K.-T. (2006).
Fast Human Detection Using a Cascade of Histograms
of Oriented Gradients. In CVPR.
ICPRAM 2012 - International Conference on Pattern Recognition Applications and Methods
288
