
LASER DOPPLER FLOWMETERS PROTOTYPES VALIDATION
USING MONTE CARLO SIMULATIONS
Edite Figueiras
1
, Rita Campos
1
, Ricardo Oliveira
1
, Luís F. Requicha Ferreira
1
, Frits de Mul
2
and Anne Humeau-Heurtier
3
1
Instrumentation Center (GEI-CI), Physics Department, Faculty of Sciences and Technology of Coimbra University
Rua Larga, 3004-516, Coimbra, Portugal
2
University of Twente, Department of Applied Physics, Biomedical Optics Group, Enschede, Netherlands
3
Laboratoire d'Ingénierie des Systèmes Automatisés (LISA), Université d'Angers
62 avenue Notre Dame du Lac, 49000 Angers, France
Keywords: Laser doppler flowmetry, Monte carlo simulations, Microcirculation.
Abstract: Two new laser Doppler flowmeter prototypes are herein validated with Monte Carlo simulations. The first
prototype is a multi-wavelength laser Doppler flowmeter with different spaced detection fibres that will add
depth discrimination capabilities to LDF skin monitoring. The other prototype is a self-mixing based laser
Doppler flowmeter for brain perfusion estimation. In order to validate these two prototypes, Monte Carlo
simulations are performed. For the first prototype validation, Monte Carlo simulations in a phantom
consisting of moving fluid (pumped milk) at six different depths as well as in a skin model are proposed.
For this prototype, the results show that the first order moment of the photocurrent power spectrum (M1)
and mean depth measured both increase with the fibre distances tested. Moreover, M1 increases with the
concentration of milk, whereas the mean depth measured decreases with the milk concentration for the
phantom results. Furthermore, we show that increasing the wavelength of incoming light, in the skin model,
increases the mean depth probed. For the second prototype validation, Monte Carlo simulations are carried
out on a rat brain model. We show that the mean measurement depth in the rat brain with our probe is
0.15 mm.
1 INTRODUCTION
Laser Doppler flowmetry (LDF) is a Doppler Effect-
based technique used for microcirculation blood
flow monitoring where monochromatic light, guided
by optical fibres, is transmitted to the tissues under
study. In the tissues the laser light can be reflected,
absorbed, transmitted or scattered. The photons
scattered by moving particles, like red blood
cells (RBCs), are frequency shifted in accordance
with the Doppler Effect. These photons get red
blood cells velocity information. If they are detected,
together with static particles scattered photons, they
will produce a stochastic photocurrent in the
photodetector. This photocurrent is related with the
velocity and concentration of the RBCs (Bonner and
Nossal, 1981); (Humeau et al., 2007).
Currently, LDF does not give any absolute
measure of blood perfusion, i.e. it is not possible to
express the flux signal in absolute flow units,
because variables as the sampled volume, the
photons path-length, the direction of the blood flow,
and the amount of blood vessels and their length in
the measuring volume are unknown (Nilsson et al.,
2003); (Morales, 2005). For that reason, LDF signals
collected in different tissues cannot be directly
compared. Moreover, LDF signals recorded from
human skin lack in estimating the sampling depth.
These difficulties lead to ambiguities in the
discrimination of the fraction of light scattered from
superficial and deeper blood microcirculation skin
layers (Oliveira et al., 2011). Besides this,
commercial available flowmeters use different signal
processing algorithms and calibration procedures
making impossible the comparison of their results
(Nilsson et al., 2003); (Morales, 2005). Concerning
LDF invasive measurements, the smallest
commercial probes available (with 450 µm
diameter) are too large for research studies in small
organs of animals as rat brain, causing damage in an
24
Figueiras E., Campos R., Oliveira R., F. Requicha Ferreira L., de Mul F. and Humeau-Heurtier A..
LASER DOPPLER FLOWMETERS PROTOTYPES VALIDATION USING MONTE CARLO SIMULATIONS.
DOI: 10.5220/0003709100240033
In Proceedings of the International Conference on Bioinformatics Models, Methods and Algorithms (BIOINFORMATICS-2012), pages 24-33
ISBN: 978-989-8425-90-4
Copyright
c
2012 SCITEPRESS (Science and Technology Publications, Lda.)

extension that may negatively impact local
measurements (Oliveira et al., 2011).
Monte Carlo methods are statistic methods used
in stochastic simulations with applications in several
areas as physics, mathematics, and biology. Monte
Carlo simulations of light transport are very helpful
in photon propagation studies in turbid media, as
skin. They have been widely used in LDF area (see
for example Figueiras et al., 2011). In Monte Carlo
methods, the light transport in turbid media is based
on the simulation of the photon trajectories, where
separate photons travel through the tissues. Several
phenomena as scattering, absorption and refraction
can be simulated based on the scattering functions,
Fresnel relations, etc.
We present herein Monte Carlo simulations
results for validation of two new laser Doppler
flowmeter prototypes. These prototypes have been
built in order to eliminate two drawbacks existing in
the LDF technique. The first prototype aims at
giving depth perfusion measurements information
(non invasive prototype) for human skin. The second
prototype aims at reducing the size of LDF invasive
probes for rat brain measurements (invasive
prototype). For the first prototype validation, Monte
Carlo simulations in a phantom consisting of moving
fluid at six different depths are herein proposed.
Simulations in a skin model are also presented. For
the second prototype validation, Monte Carlo
simulations are carried out on a rat brain model. In
what follows, we first present the two prototypes and
the three simulated models. Finally, the Monte Carlo
simulations are detailed and the computed signals
are presented.
2 MATERIALS AND METHODS
2.1 Prototypes
Skin microcirculation is present in the dermis and is
organized into two horizontal plexuses: the most
superficial is situated in the papillary dermis at 0.4 -
0.5 mm below the skin surface; the second plexus is
located at the dermal subcutaneous interface at
1.9 mm from the skin surface where arteriovenous
anastomoses can be found (Brevarman, 2000);
(Roustit et al., 2008). A new laser Doppler
flowmeter prototype with depth discrimination
capabilities is being built in order to determine the
sampling depth of the backscattered photons used to
compute the LDF signal (Oliveira et al., 2011). This
prototype is a non-invasive and multi-wavelength
prototype device, with 635, 785, and 830 nm laser
wavelengths. The probe used is from Perimed
®
AB
and has a central emitting fibre and collecting fibres
located at 0.14, 0.25 and 1.2 mm from the emitting
fibre (Oliveira et al., 2011).
A self-mixing based prototype with a
miniaturized laser Doppler probe is also being built
in order to monitor blood flow changes in rat deep
brain structures without causing significant damage
to the tissue (Oliveira et al., 2011). In self-mixing
method, the monitor photodiode at the rear face of
the laser diode is used for signal detection; a single
optical fibre is therefore used for light emission and
detection. Pigtailed laser diodes, with 785 and 1308
nm laser wavelengths and with single mode optical
fibre are used. Standard single mode optical fibres
have 125 and 250 μm of cladding and jacket
diameters, respectively. The probe consists of the
stripped optical fibre inserted in a micro-needle with
an outer diameter of 260 µm (Oliveira et al., 2011).
Measurements will be made in the rat brain
hippocampus. As commercial available probes have
a 450 μm diameter, the use of only one optical fibre
allows us to reduce the size of the probe to 58%.
2.2 Phantom and Simulation Models
2.2.1 Phantom Model
The phantom model was built with the purpose to
evaluate, in vitro, the non-invasive flowmeter
prototype response to moving fluid at different
depths (as it can be found in skin) (Figueiras et al.,
2010). The phantom consists of a Teflon®
microtube rolled around an aluminium metal piece
with a total of six layers. The inner and outer
diameters of the microtube are 0.3 and 0.76 mm,
respectively. Commercial skimmed milk has been
chosen as a moving fluid because it has various
components that act as scatterers, namely
carbohydrates, fat, and protein. Moreover, it does
not sediment like microspheres, and it has similar
behaviour to intralipid solutions (Waterworth et al.,
1995). Finally, milk is easier for handling than blood
and, besides, it is cheaper. However, as milk is
unstable, we use the same milk solution for one day
only. Milk is pumped in the microtubes with a
motorized syringe with different velocities: 1.56,
3.12, 4.68, 6.25, 7.78, and 9.35 mm/s. Different milk
solutions were used: 100% milk, and aqueous
solutions with 50% and 25% of milk.
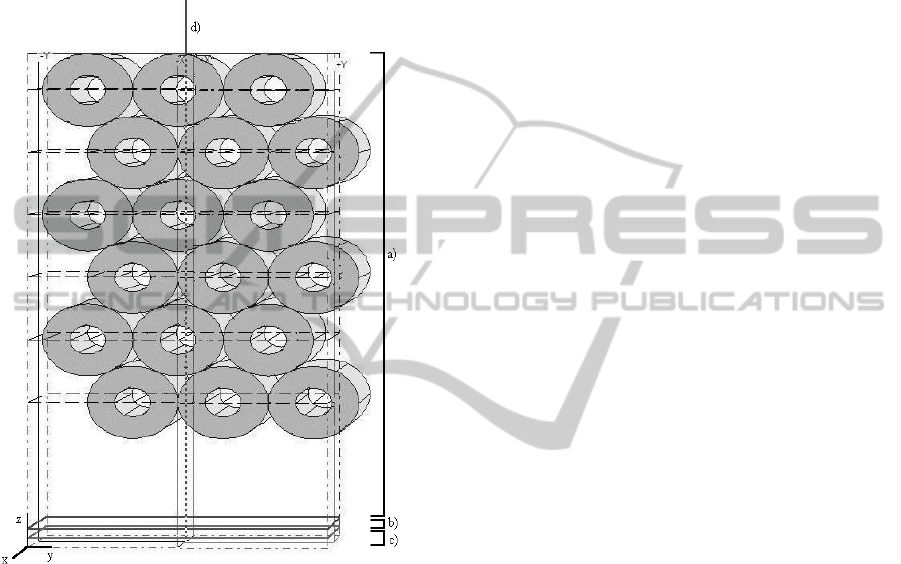
The first simulated model (presented in figure 1)
consists of three main layers. The first layer is
composed of a set of objects equivalent to the six
microtube layers and it has a total depth of 5 mm.
LASER DOPPLER FLOWMETERS PROTOTYPES VALIDATION USING MONTE CARLO SIMULATIONS
25
The two deeper layers mimic the aluminium plate
and have a thickness of 0.1 mm each one: one acts
as a scatterer with isotropic semi-spherical
backscattering and the other is a totally reflecting
layer. The laser light was considered as a pencil
beam shape and it was positioned at the top of the
most superficial tube. A parabolic profile was used
for the milk flow simulations where the maximum
velocity is twice the mean velocity.
Figure 1: Simulation phantom model: it consists of three
main layers: a) the upper layer, composed of microtubes
with skimmed milk as moving fluid; and the two deeper
layers, b) and c) mimic the aluminium plate. d) represents
the laser beam.
The simulations were made only for 635 nm
laser light wavelength due to the absence of
information concerning milk and Teflon optical
properties for 785 and 830 nm laser light. The milk
optical properties used were published by
Waterworth et al. (1995), where the refractive index
for milk is 1.346, absorption (µ
a
) and scattering
coefficients (µ
s
) are 0.00052 and 52 mm
-1
,
respectively. The Teflon optical properties used
were published by Li et al. (2008) where the
refractive index is 1.367, µ
a
= 0.001 mm
-1
and µ
s
=
167 mm
-1
, respectively. Henyey-Greenstein phase
function was used with g = 0.90 for both
components (Waterworth et al., 1995; Li et al.,
2008).
Simulations were made for six different
velocities for milk speed, three different milk
solutions and three different detection distances,
which gives a total of 54 simulations, with 5,000,000
photons detected in each simulation.
2.2.2 Skin Model
The skin simulations were made for three
wavelengths (635, 785 and 830 nm) and three
different emitting-receiving fibre separations (0.14.
0.25 and 1.2 mm), the ones used in the non self-
mixing prototype.
The skin model was based in the model
presented by Fredriksson et al. (2008; 2009). It
consists of 6 layers with different thicknesses and a
given blood concentration at three different flow
velocities with random direction (see table 2 from
Fredriksson et al., 2009). Oxygenated blood with
hematocrit equal to 42% was considered (normal
hematocrit values: 36-44% for females; 39-50% for
males). A parabolic distribution was considered for
the blood velocities.
The skin and blood optical properties for 635 and
785 nm were also based on Fredriksson et al. (2009),
whereas for 830 nm they were based on the results
presented by Simpson et al. (1998) and Prahl (1999).
The skin and blood optical properties are
summarized in table 1. Concerning the scattering
functions, the blood was modelled with the
Gegenbauer kernel scattering phase function, with
α
GK
= 1 for all wavelengths and g
GK
= 0.95 mm
-1
for
635 nm and g
GK
= 0.948 mm
-1
for 785 and 830 nm.
For static tissue the Henyey-Greenstein phase
function was used with g = 0.85 mm
-1
. The
refractive index was set to 1.4 for all skin layers,
1.58 for the probe and 1 for the surrounding air.
The laser light was simulated as an external
photon beam, with pencil beam shape with a
perpendicular entrance in the tissue and the path
tracking was recorded with 1/µ’
s
resolution (µ’
s
refers to the reduced scattering coefficient). The
numerical aperture (NA) of the fibres is 0.37. A total
of 3 times 4 simulations were made where
10,000,000 photons were detected in each one.
The optical properties of deoxygenated and
oxygenated blood are equal except for the absorption
coefficient (see table 5 of Fredriksson et al., 2009).
However, this value is rather independent of the
level of oxygenation of the blood, once the chosen
wavelengths are close to the 800 nm isobestic point
of oxygenated and deoxygenated haemoglobin.
BIOINFORMATICS 2012 - International Conference on Bioinformatics Models, Methods and Algorithms
26

Table 1: Optical properties for the six skin layers and oxygenated blood (hematocrit=42%) used in skin simulations for 635,
785 and 830 nm.
μ
a
(mm
-1
) μ’
s
(mm
-1
) g
Wavelength (nm) 635 785 830 635 785 830 635 785 830
Epidermis 0.15 0.1 0.0122 4.8 3.5 1.81 0.85 0.85 0.9
Papillary dermis 0.15 0.1 0.0122 3 2 1.81 0.85 0.85 0.9
Superior blood net 0.15 0.1 0.0122 3 2 1.81 0.85 0.85 0.9
Reticular dermis 0.15 0.1 0.0122 3 2 1.81 0.85 0.85 0.9
Inferior blood net 0.15 0.1 0.0122 3 2 1.81 0.85 0.85 0.9
Subcutis 0.15 0.1 0.00856 2.4 2 1.12 0.85 0.85 0.9
Blood 0.34 0.5 0.52 2.13 2 2 0.991 0.991 0.991
2.2.3 Rat Brain Model
The rat hippocampus consists of several substances
such as grey matter, white matter and blood vessels,
among others. The blood percentage is nearly 4.5%
and the white matter is up to 4% of the blood
volume. As the percentage of white matter is very
low we considered that the hippocampus has 95.5%
of grey matter and 4.5% of blood (3.6% of
oxygenated blood and 0.9% of deoxygenated blood)
(Fredriksson et al., 2009); (Hamberg et al., 1996).
The optical properties chosen in the simulations
for the 785 nm wavelength were based on
Fredriksson et al. (2009). The absorption
coefficients used were 0.2, 0.5 and 0.64 mm
-1
for
grey matter, oxygenated and deoxygenated blood,
respectively. The scattering coefficients were 0.78
mm
-1
for the grey matter and 2 mm
-1
for oxygenated
and deoxygenated blood and the anisotropy factor
was 0.900 for grey matter and 0.991 for oxygenated
and deoxygenated blood (Fredriksson et al., 2009).
Concerning the scattering functions, the blood
(oxygenated and deoxygenated) was modeled with
the Gegenbauer kernel scattering phase function,
with α = 1 and g = 0.948 mm-1 (Fredriksson et al.,
2009). For grey matter the Henyey-Greenstein phase
function was used with g = 0.85 mm
-1
(Fredriksson
et al., 2009). For blood a hematocrit equal to 42%
was considered. The refractive index was set to 1.4
to all components and the laser light was simulated
as a pencil beam with a perpendicular entrance in the
tissue. The path tracking was recorded with 1/µ’
s
resolution, where µ’
s
is the reduced scattering
coefficient. The numerical aperture (NA) of the
optical fibres is 0.11.
The simulations were performed only for the
785 nm laser light wavelength due to the absence of
information concerning optical properties of grey
matter, oxygenated and deoxygenated blood for the
1300 nm laser light beam.
2.2.4 Monte Carlo Simulations
For the simulations, Monte Carlo software
‘MONTECARL’ from Frits de Mul was used (De
Mul et al., 1995); (De Mul, 2004).
3 RESULTS AND DISCUSSION
3.1 Phantom Simulations
The results obtained in the phantom model, namely
the mean depth of the Doppler events per photon,
the percentage of Doppler shifted photons detected
and the mean of Doppler scattering events per
photon are given in table 2 for 1.56 mm/s milk
velocity.
The emitting-receiving fibre separation
influences the measurements, in such a way that for
larger fibre separations, a larger sample volume is
probed. Therefore, increasing the fibre distance,
photons travel through deeper objects leading to an
increase in the mean depth of Doppler shifted
photons. Previous studies (Fredriksson et al., 2008;
Fredriksson et al., 2009) based on light propagation
in tissue using Monte Carlo computational
simulations are in agreement with these results. The
milk concentration also influences the mean depth,
which decreases with the increase of milk
concentration. This is due to a higher degree of
multiple Doppler shifts registered for higher milk
concentrations.
The percentage of Doppler shifted photons
detected increases with the emitting-receiving
separation for each velocity. This is expected
because when the fibre distance increases, the
measured sample volume increases, and the photons
LASER DOPPLER FLOWMETERS PROTOTYPES VALIDATION USING MONTE CARLO SIMULATIONS
27

will encounter a larger amount of moving scatterers.
When the concentration of milk increases the
percentage of Doppler shifts detected also increases.
The higher the milk concentration, higher scatterers
are present, consequently, more scattering events
occur.
Likewise, the mean Doppler scattering events per
photon also increase with the fibre distance for each
velocity. This is not surprising as we are considering
a homogenous model (for the scatterers velocity and
concentration). Therefore, an increase in the
sampled volume will naturally lead to more Doppler
scatters events. Increasing the milk concentration, a
higher degree of multiple Doppler scattering is
reached, because the higher the concentration, the
higher the scatterers.
Similar results were obtained for all velocities in
what concerns the mean depth of the Doppler events
per photon, the percentage of Doppler shifted
photons detected and the mean of Doppler scattering
events per photon, as this parameters are
independent of the velocity of the moving fluid.
The first order moment of the Doppler power
spectrum, M1, was also evaluated. Figure 2 shows
the effect on M1 when the fiber distance increases,
for each velocity and for a milk concentration of
25%. It can be seen that higher values of M1 come
from larger fiber separations whereas the lower
values of M1 are obtained for 0 mm fiber separation.
Another observation is that, in general, M1 increases
with the velocity and with the milk concentration.
This is not surprising since M1 is proportional to
perfusion (Perf), which in turn is proportional to the
scatterers concentration times their average velocity.
However, in some specific cases M1 does not
increase with the velocity, especially for the two
highest velocities for 1.2 mm fiber distance. This
might be due to the phantom model that saturates in
such extreme situations.
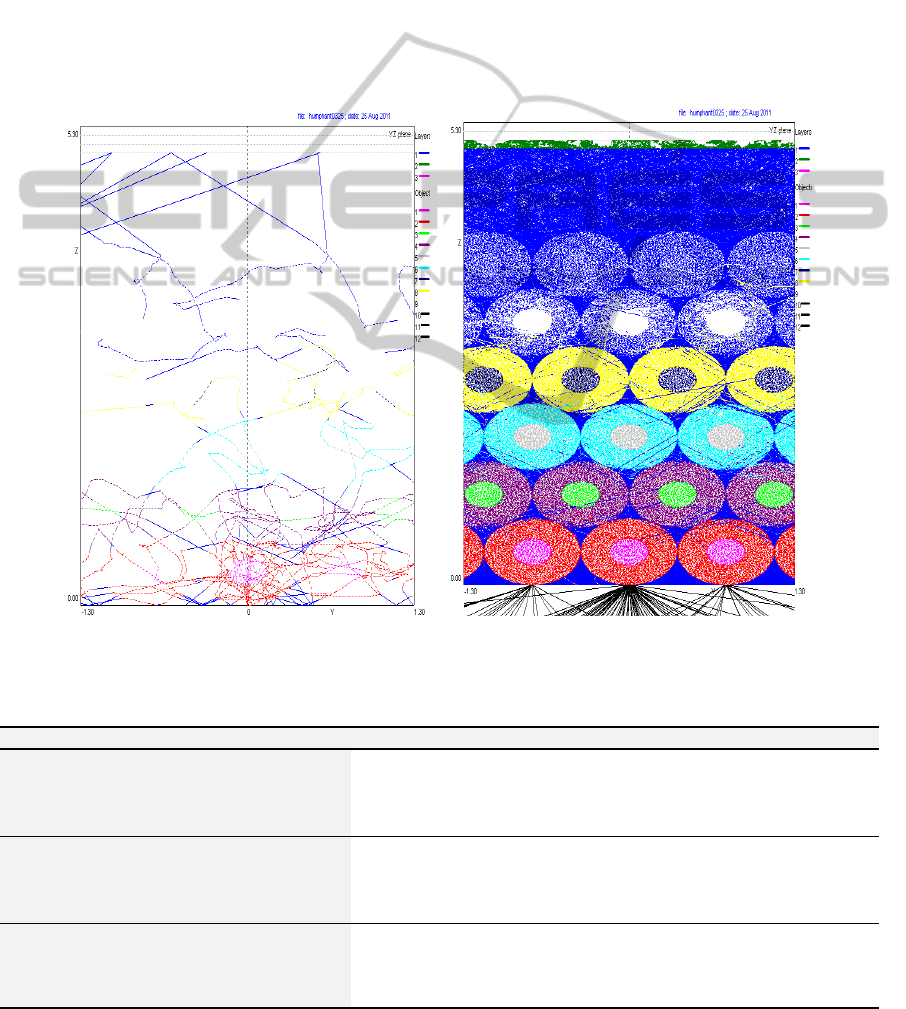
In order to better understand the path travelled by
the photons, a path tracking study was done. The
path tracking can be ‘followed’ in MC software
during the simulations. In figure 3 it can be seen the
path tracking for 25 [figure 3a)] and 13128 [figure
3b)] photons injected. In figure 3 b) it can be clearly
seen the three layers (cf. figure 1). The average
number of paths travelled by each photon and the
respective average depth were estimated.
Furthermore, the average path length for each
photon was also evaluated.
0 0.14 0.25 1.2
0
0.5
1
1.5
2
2.5
3
3.5
4
x 10
21
Emitting-receiving fibre distance (mm)
M1 (Hz)
1.56 mm/s
3.12 mm/s
4.68 mm/s
6.25 mm/s
7.78 mm/s
9.35 mm/s
Figure 2: M1 vs. emitting-receiving fibre distance, on the
phantom model with 25% milk concentration for 635 nm
laser light wavelength.
The results for 1.56 mm/s are presented in table
3. The results are similar for all simulated velocities
because these parameters are independent of the
scatterers velocity. For different milk concentrations,
there is not a clear tendency for the variation of the
number of paths with the milk concentration.
The average number of paths for each photon
increases with emitting-receiving fibre distance (cf.
table 3).
Table 2: The mean depth of the Doppler events for each photon, the percentage of Doppler shifted photons detected and the
mean of Doppler scattering events per photon for the phantom model, with milk pumped at 1.56 mm/s, for 635 nm laser
light wavelength.
Fibre distance (mm)
Mean Doppler depth (mm) Detected Doppler (%) Mean Doppler scattering
Milk concentration Milk concentration Milk concentration
25 % 50% 100% 25% 50% 100% 25 % 50% 100%
0 0.36 0.34 0.32 4.77 6.73 10.27 3.48 5.85 10.08
0.14 0.41 0.39 0.35 26 32.35 41.26 4.29 7.30 12.66
0.25 0.43 0.40 0.37 41.23 47.76 56.45 4.37 7.78 14.27
1.2 0.56 0.55 0.53 82 86 87.47 6.47 12.65 26-63
BIOINFORMATICS 2012 - International Conference on Bioinformatics Models, Methods and Algorithms
28
This is expected because as mentioned, a greater
fibre distance allows sampling a greater volume and
therefore, a bigger number of paths are registered.
The average path depth and the average path
length for each photon are the highest for 0 mm
emitting-receiving fibre distances, and they are the
lowest for 0.14 and 0.25 mm fibre distance. The
origin of this non-linearity is unclear for the
moment.
3.2 Skin Simulations
The mean depth of the Doppler events per photon,
the percentage of Doppler shifted photons detected
and the mean of Doppler scattering events per
photon obtained in Monte Carlo simulations, for the
skin model, are presented in table 4.
The mean depth for the Doppler events, the
percentage of Doppler shifted photons detected and
the mean Doppler scattering per photon increase
with fibre distance, as for the phantom model,
because a larger emitting-receiving separation
allows sampling a larger volume.
Furthermore, the mean measurement depth also
increases with the wavelength. This is due to both
skin absorption and scattering coefficients decrease
with the wavelength, allowing the photons to travel a
longer path. Similar results were obtained by
Figure 3: Path tracking registered during the simulations for: a) 25 and b) 13128 photons injected.
Table 3: Average mean path number, mean path depth and mean path length for photons for the phantom model, with milk
pumped at 1.56 mm/s.
Milk concentration Fibre distance (mm) <Path number> <Path depth> (mm) <Path length> (mm)
5%
0 3.31 1.45 10.66
0.14 7.00 0.23 2.53
0.25 9.66 0.23 2.55
1.2 25.67 0.47 5.95
50%
0 3.37 1.41 10.74
0.14 7.06 0.24 2.58
0.25 9.51 0.22 2.45
1.2 25.91 0.47 6.07
100%
0 3.49 1.41 10.43
0.14 7.04 0.22 2.53
0.25 9.53 0.21 2.43
1.2 27.67 0.45 6.24
LASER DOPPLER FLOWMETERS PROTOTYPES VALIDATION USING MONTE CARLO SIMULATIONS
29

Fredriksson et al. (2009), with a measurement depth
slightly smaller, but with the same order of
magnitude. It can be noticed that the mean depth of
the Doppler shifted photons never reaches the
reticular dermis or the layers below this one, since
reticular dermis lies at a depth of 1.175 mm and the
mean depth predicted for the Doppler events is
always lower than this value. In addition, detected
photons reached the superior blood net dermis only
when detected with the 1.2 mm fibre distance.
The percentage of Doppler shifted detected
photons also increases with the wavelength
excluding for the 1.2 mm emitting-receiving fibre
distance. This may be related to the distribution of
the Doppler events percentage in each layer (cf.
table 5). It can be seen that the reticular dermis is the
2nd layer with the most detected Doppler photons
for 1.2 mm fibre distance (for 785 and 830 nm laser
light), whereas for the other fibre distances the 2nd
layer with the most detected Doppler photons is the
papillary dermis.
This proves that the photons detected at 1.2 mm
from the emitting fibre cross a higher volume of
blood. Besides, the Doppler events percentage in the
inferior blood net (for 1.2 mm fibre distance)
decreases going from 635 to 785 nm laser light and
increases going from 785 to 830 nm laser light. This
layer has the second higher blood concentration
when compared with the other layers. Together, with
the higher volume of blood crossed and the
increasing of the blood absorption coefficient with
the wavelength may cause this nonlinearity.
In opposition, the mean Doppler scattering event
does not follow a general trend when increasing the
wavelength of the incident light but is always
smaller than 1.5, which means that there are few
photons that suffer multiple Doppler shifts.
Simulation results also demonstrate that M1
increases with the emitting-receiving fibre distance
(see table 6). Since M1 is proportional to the
concentration of moving RBCs times its average
velocity, and both parameters increase with the fibre
distance, this was expected.
Table 4: The mean depth of the Doppler events for each photon, the percentage of Doppler events detected and the mean of
Doppler scattering events per photon for the skin model.
Fibre distance (mm)
Mean depth Doppler (mm) Detected Doppler (%) Mean Doppler scattering
Wavelength (nm) Wavelength (nm) Wavelength (nm)
635 785 830 635 785 830 635 785 830
0 0.24 0.25 0.27 1.94 1.97 3.54 1.19 1.16 1.15
0.14 0.27 0.29 0.31 9.62 10.71 14.54 1.23 1.22 1.23
0.25 0.28 0.30 0.33 15.45 16.29 20.39 1.26 1.23 1.25
1.2 0.37 0.38 0.41 47.7 41.89 43.45 1.49 1.41 1.46
Table 5: Doppler events percentage in each layer for the skin model.
Wavelength
(nm)
Fibre
Distance
(mm)
Skin layers
Epidermis
Papillary
dermis
Superior
blood net
Reticular
dermis
Inferior
blood net
Subcutis
0 0 41.07 51.19 7.24 0.5 0
635 0.14 0 35.1 53.06 10.31 1.37 0.17
0.25 0 31.98 55.23 11.1 1.49 0.21
1.2 0 19.43 56.21 19.51 4.08 0.77
0 0 41.73 48.84 8.93 0.51 0
785 0.14 0 30.85 54.86 12.97 1.33 0
0.25 0 27.69 56.42 14.38 1.51 0
1.2 0 18.81 55.44 22.24 3.51 0
0 0 38.76 49.36 10.35 1.54 0
830 0.14 0 26.66 55.91 15.09 2.33 0
0.25 0 23.09 57.05 17.27 2.59 0
1.2 0 16.57 53.06 25.15 5.21 0
BIOINFORMATICS 2012 - International Conference on Bioinformatics Models, Methods and Algorithms
30

In what concerns the wavelengths, M1 firstly
decreases from 635 to 785 nm and then increases for
830 nm. This can be explained if we look at the
Doppler photons percentage that exceeds the
reticular dermis. This percentage is higher for
830 nm followed by 635 nm and lower for 785 nm,
with the exception of the 0 mm fibre distance (Table
5). As the inferior blood net has the highest
concentration of the high velocity component of
RBCs (30 mm/s), it results in a higher Doppler shifts
for 635 nm than for 785 nm photons. Therefore M1
will be higher for 635 nm than for 785 nm.
Table 7 shows the results of the path tracking study
for the skin model. It can be observed that the
average path number travelled by each photon, the
mean path depth and the average path length
increase with emitting-receiving fibre distance. This
occurs, because increasing the fibre distance a
greater tissue volume is probed, and so, more
scattering events occur. The mean path number does
not follow a general trend when increasing the
wavelength of the incident light.
The path depth increases with the laser light
wavelength due to both skin absorption and
scattering coefficients decrease with the wavelength,
allowing the photons to travel a longer path. This is
in agreement with the mean depth of Doppler events
results showed in table 4. The average path length
increases with the wavelength, excluding for the 1.2
mm emitting-receiving fibre distance. This may be
related with the distribution of the Doppler events
percentage in each layer (cf. table 5) as discussed
later when the percentage of Doppler shifted
detected photons is analyzed.
3.3 Rat Brain Simulations
In the simulation made for rat brain model, it can be
seen that the photons Doppler shifted travelled a
mean depth of 0.15 mm (cf. table 8). This value is in
accordance with Frediksson et al. (2009) which
obtained 0.16 mm of measurement depth. Each
photon suffers, in average, 2.23 scatters events. In a
total of 5,000,000 photons detected 11.9% had
Table 6: First order moment of Doppler power spectrum (M1) for skin model.
Wavelength (nm)
M1 (Hz)
Fibre distance (mm)
0 0.14 0.25 1.2
635 3.57E+18 2.51E+19 3.71E+19 1.63E+20
785 3.45E+18 2.13E+19 3.23E+19 1.05E+20
830 5.30E+18 2.66E+19 3.93E+19 1.06E+20
Table 7: Mean path number, mean path depth and mean path length for photons, using the skin model.
Wavelength (nm) Fibre distance (mm) <Path number> <Path depth> (mm) <Path length> (mm)
635
0 3.16 0.02 0.23
0.14 6.1959 0.0775 0.78
0.25 7.99 0.11 1.16
1.2 19.77 0.27 4.11
785
0 3.08 0.02 0.23
0.14 5.98 0.09 0.86
0.25 7.46 0.12 1.26
1.2 14.71 0.26 3.65
830
0 3.77 0.04 0.34
0.14 6.93 0.12 1.12
0.25 8.34 0.16 1.57
1.2 14.86 0.28 4.01
LASER DOPPLER FLOWMETERS PROTOTYPES VALIDATION USING MONTE CARLO SIMULATIONS
31

Table 8: The percentage of Doppler events detected the mean of Doppler scattering, the mean depth of the Doppler events
for each photon and M1 for the rat model.
Mean depth Doppler (mm) Detected Doppler (%) Mean Doppler scattering M1 (Hz)
0.15 11.9 2.23 3.51E+17
suffered Doppler shift and M1 was predicted to be
3.51E+17 Hz. These results will help in the rat brain
probe positioning as it shall be 0.15 mm above the
mean measurement depth.
4 CONCLUSIONS
Monte Carlo simulations used for the two new LDF
prototypes validation showed results in accordance
with the literature. For the non invasive prototype,
the phantom model presented here to evaluate the in
vitro prototype response, has shown good agreement
with theoretical expectations. M1 increases with the
concentration and with the fibre distances. The mean
depth increases with the fibre distance and decreases
with the milk concentration. For in vivo evaluation,
the estimated parameters for the skin model
corresponded to a priori expectations. We have
shown that increasing the wavelength of incoming
light (in the range of 635-830 nm) increases the
mean depth probed. Moreover, an increase of the
source-detection fibre separations leads to a higher
mean depth and M1 value. In what concerns the rat
brain model, the mean depth that photons Doppler
shifted travel was estimated to be 0.15 mm which is
in agreement with the literature.
ACKNOWLEDGEMENTS
The authors thank the “Instituto de Investigação
Interdisciplinar (III)” of the University of Coimbra,
“Acções Universitárias Integradas Luso–Francesas”
(PAUILF) programme and “Fundação para a
Ciência e a Tecnologia (FCT), Lisbon”, for
supporting this work.
REFERENCES
Bonner, R. F., Nossal, R. (1981). Model for laser Doppler
measurements of blood flow in tissue. Applied Optics;
20,2097–2107.
Braverman, I. M.(2000). The Cutaneous Microcirculation.
J Investig Dermatol Symp Proc; 5, 3-9.
De Mul, F. F. M., Koelink, M. H., Kok, M. L., Harmsma,
P. J., Greve, J., Graaff, R. and Aarnoudse, J. G.
(1995). Laser Doppler Velocimetry and Monte Carlo
Simulations on Models for Blood Perfusion in Tissue.
Applied Optics; 34, 6595-6611.
De Mul, F. F. M, 2004. Monte-Carlo simulation of Light
transport in Turbid Media. In Handbook of Coherent
Domain Optical Methods, Biomedical Diagnostics,
Environment and Material Science (chapter 12),
Tuchin, V. V. (Ed.). Dordrecht: Kluwer Publishers.
Figueiras, E., Loureiro, V., Ferreira, L. F. R. and Humeau,
A. (2009). Some Reasons to Build a New Laser
Doppler Flowmeter to Monitor Microvascular Blood
Flow. IFMBE Proceedings, World Congress on
Medical Physics and Biomedical Engineering; 25/IV,
1865-1868, Munich (Germany).
Figueiras, E., Ferreira, L. F. R. and Humeau, A. (2010).
Phantom validation for depth assessment in laser
Doppler flowmetry technique. Proceedings of EOS,
Topical Meeting on Diffractive Optics; 2413, Koli
(Finland).
Figueiras, E., Ferreira, L. F. R., De Mul, F. F. M. And
Humeau, A. (2011). Monte Carlo Methods to
Numerically Simulate Signals Reflecting the
Microvascular Perfusion. In Numerical Simulations -
Applications, Examples and Theory (Chapter 7),
Angermann, L. (Ed.). Rijeka: InTech. Available from:
http://www.intechopen.com/articles/show/title/monte-
carlo-methods-to-numerically-simulate-signals-reflect
ing-the-microvascular-perfusion
Fredriksson, I., Larsson, M. and Strömberg, T. (2008).
Optical microcirculatory skin model: assessed by
Monte Carlo simulations paired with in vivo lased
Doppler flowmetry. Journal of biomedical optics;
13,014015.
Fredriksson, I., Larsson, M. and Strömberg, T. (2009).
Measurement depth and volume in laser Doppler
flowmetry. Microvascular research; 78,4-13.
Hamberg, L. M., Hunter, G. J., Kierstead, D., Lo, E. H.,
Gonzalez, R. G. and Wolf, G. I. (1996). Measurement
of cerebral blood volume with substraction three-
dimentional functional CT. Am. J. Neuroradiol;
17(10), 1861-1869.
Humeau, A., Steenbergen, W., Nilsson, H. and Strömberg,
T. (2007). Laser Doppler perfusion monitoring and
imaging: novel approaches, Med. Biol. Eng. Comput.,
45, 421-435.
Li, Q., Lee, B. J., Zhang, Z. M. and Allen, D. W. (2008).
Light scattering of semitransparent sintered
polytetrafluoroethylene films. Journal of Biomedical
Optics; 13(5), 054064.
BIOINFORMATICS 2012 - International Conference on Bioinformatics Models, Methods and Algorithms
32

Morales, F. (2005). Improving the clinical applicability of
laser Doppler perfusion monitoring. PhD thesis,
Universidade de Groningen.
Nilsson, G. E., Salerud, E. G., Stromberg, T. N. O. and
Wardell, K. (2003). Laser Doppler perfusion
monitoring and imaging. In Biomedical photonics
Handbook (chapter 15), Vo-Dinh, T. (Ed.). Washington,
D.C.: CRC press.
Oliveira, R., Semedo, S., Figueiras, E., Requicha Ferreira,
L. F., Humeau, A. (2011). Laser Doppler Flowmeters
for microcirculation measurements, 1st Portuguese
Meeting in Bioengineering - Bioengineering and
Medical Sciences - The challenge of the XXI century,
Portuguese chapter of IEEE EMBS; Technical
University of (Portugal).
Prahl, 1999. Optical Absorption of Hemoglobin. Retrived
from http://omlc.ogi.edu/spectra/hemoglobin/index.
html
Roustit, M., Simmons, G. H., Carpentier, P., and
Cracowski, J. L. (2008). Abnormal digital
neurovascular response to local heating in systemic
sclerosis. Rheumatology; 47, 860-864.
Simpson, C. R., Kohl, M., Essenpreis, M. and Cope, M.
(1998). Near infrared optical properties of ex-vivo
human skin and subcutaneous tissues measured using
the Monte Carlo inversion technique. Phys Med Biol;
43, 2465-2478.
Waterworth, M. D., Tarte, B. J., Joblin, A. J., van Doorn,
T. and Niesler, H. E. (1995). Optical transmission
properties of homogenized milk used as a phantom
material in visible wavelength imaging. Australasian
Physical and Engineering Sciences in Medicine;18,
39-44.
LASER DOPPLER FLOWMETERS PROTOTYPES VALIDATION USING MONTE CARLO SIMULATIONS
33
