
FLOW AND PARTICLE
DEPOSITION IN THE TURBUHALER DPI
A CFD Simulation
J. Milenkovic
1
, A. H. Alexopoulos
1
and C. Kiparissides
2
1
CPERI, CERTH, 6
th
km Harilaou-Thermi rd., Thermi, Greece
2
Department of Chemical Engineering, Aristotle University of Thessaloniki, Thessaloniki, Greece
Keywords: Dry Powder Inhaler, Turbuhaler, CFD, Deposition.
Abstract: In this work the steady-state flow in a commercial dry powder inhaler device (i.e.., Turbuhaler) is described.
The DPI geometry is constructed in a CAD/CAM environment (i.e., CATIA v5) and then imported into
GAMBIT where the geometry is discretized into a computational grid. The Navier-Stokes equations are
solved using FLUENT (v6.3) and particle motion and deposition are described using an Eulerian-
fluid/Lagrangian-particle approach. Flow and particle deposition for a range of mouthpiece pressure drops
(i.e., 800-8800Pa), as well as particle sizes corresponding to single particles and aggregates (i.e., 0.5-20μm)
are examined. The total volumetric outflow rate, the overall particle deposition as well as the particle
deposition sites in the DPI are determined. The simulation results are found to agree well with available
experimental data for volumetric flow and overall particle deposition.
1 INTRODUCTION
Dry Powder Inhalers, DPIs, are one of the principle
means of delivering pharmaceuticals due to their
ease of use and cost-effectiveness. The main
function of a DPI device is the adequate dispersion
and delivery of particles. Initially the particles are in
the form of a loose powder which, under the action
of airflow is broken up and dispersed as particle
aggregates which are then further broken up into
fine particles (Ashurst et al. 2000; Newman and
Busse, 2002; Tobyn et al., 2004; Islam et al., 2008;
Alagusundaram et al.,
2010). Powder properties, e.g.,
cohesion, charge, size, and size distribution,
influence powder dispersion and the breakage of
particle agglomerates (French et al., 1996; Zeng et
al., 2000; Finlay, 2001; Newman and Busse, 2002;
Chan, 2006)
.
One of the common problems with DPIs is the
loss of powder/drug due to deposition within the
device. In order to provide the maximum drug dose
per inhalation and to ensure minimal dose-to-dose
variation it is necessary to minimize the drug losses
due to internal deposition. It is also desired to have
good control over the dispersibility of the powder,
release of drug (when attached to powder particles),
and breakup of agglomerates in order to achieve the
desired particle/agglomerate size distributions at the
DPI mouthpiece outflow (Alagusundaram et al.,
2010). Consequently, if the underlying processes are
better understood one can achieve the desired
outflow particle distribution which will conceivably
minimize oropharyngeal losses and also permit
better targeting for drug delivery in the respiratory
tract.
Due to the complex and transient flow structures
observed in most commercial DPIs as well as the
dynamic powder breakup and dispersion processes
only a small number of computational fluid
dynamics, CFD, investigations have been conducted
(Schuler et al., 1999; Ligotke, 2002). Systematic
computational studies have led to a better
understanding of the function of DPI devices. For
example, Coates et al. (2004, 2005, 2006) studied
the Aerolizer DPI in detail including the effects of
air-intake, mouthpiece, and internal grid which led
to improvements in the design and function of the
DPI. Recently, the discrete element method, DEM,
coupled to continuous phase-models has been
implemented to describe the powder dispersion
process within the inhaler (Tong et al., 2010; Calvert
et al., 2011). From the current state-of-the-art it is
5
Milenkovic J., Alexopoulos A. and Kiparissides C..
FLOW AND PARTICLE DEPOSITION IN THE TURBUHALER DPI - A CFD Simulation.
DOI: 10.5220/0003711600050013
In Proceedings of the International Conference on Biomedical Electronics and Devices (BIODEVICES-2012), pages 5-13
ISBN: 978-989-8425-91-1
Copyright
c
2012 SCITEPRESS (Science and Technology Publications, Lda.)
clear that the proper description of the agglomerate
strength as well as the particle/agglomerate
interaction with the inhaler walls are key processes
that determine the final dispersion and size
distribution of pharmaceutical powders (Adi et al.,
2011).
The Turbuhaler (AstraZeneca) is a multidose dry
powder inhaler that is widely used to deliver a
number of drugs (typically for asthma), e.g.,
terbutaline sulphate, (as Bricanyl), or budesonide (as
Pulmicort), to the upper respiratory tract (Wetterlin,
1988). Each dose is initially in the form of loosely
packed particle agglomerates, ~10-20μm in size,
which are released into a mixing/dispersion
chamber, where they are broken up into particles,
~1μm in size, which are then directed to the
inhalation channel of the device (Tsima et al., 1994;
Wetterlin, 1988). The proper function of the
Turbuhaler is dependent on the dynamic volumetric
flow as well as the peak inspiratory flow rate
attained during inhalation, the amount of particles
lost due to deposition within the device, and the
adequate dispersion and breakup of the powder
agglomerates in the airflow exiting the mouthpiece.
Recent experimental investigations have provided
detailed information on particle capture as well as
the percent and size distribution of escaped particles
in the outlet flow (de Koning et al., 2001; Hoe et al.,
2009; Abdelrahim, 2010).
In this work the steady airflow in a Turbuhaler
DPI is determined by CFD simulations and particle
motion as well as deposition is determined by
Eulerian-fluid/Lagrangian-particle simulations. In
what follows the DPI geometry, the discretization
procedure, and the CFD simulations are described in
detail. Next the results for steady-state airflow are
presented follow by the results for particle
deposition. Finally, the computational results are
compared to available experimental data.
2 RESULTS
The Turbuhaler DPI geometry was constructed in a
CAD/CAM environment (i.e., CATIA v5 R19) and
then imported into GAMBIT (v2.1) where a series of
computational grids were constructed consisting of
2
10
5
–
2
10
6
tetrahedral cells with a maximum
skewness of 0.85 (Figures 1 and 2). The
computational grids were originally refined in
regions where large gradients of flow were expected.
Further refinement was conducted within FLUENT
based on actual velocity gradients observed in initial
solutions.
The Navier-Stokes equations for airflow were solved
using the commercial CFD software (i.e., FLUENT
v6.3). The SIMPLEC scheme was employed to
describe pressure-velocity coupling. Second order
discretization was used for pressure and third order
MUSCL for momentum and turbulent variables.
Convergence of CFD simulations was assumed
when the residuals were < 10
-4
. Zero gauge pressure
boundary conditions were employed at all the
inflows, i.e., two powder loaded cylinders (see
bottom of Figure 2b) and four extra air inlets in the
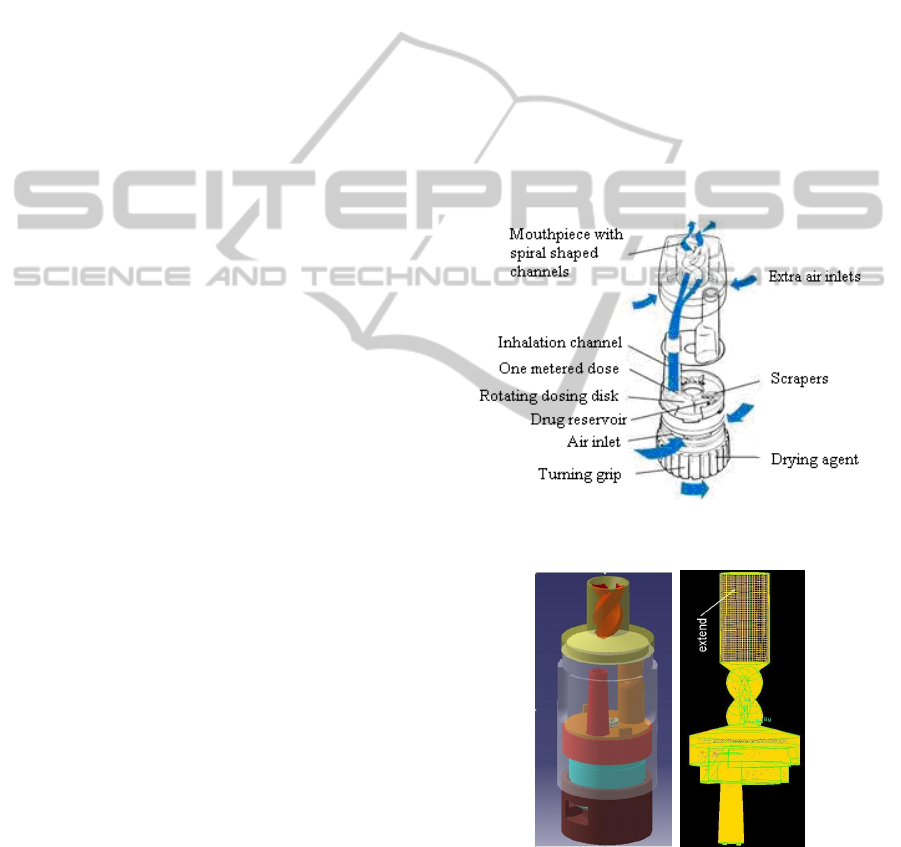
DPI dispersion chamber (see Figure 1). Different
steady state airflows were simulated by imposing a
wide range of pressure drops at the mouthpiece
outflow ranging from 800 to 8800Pa which
corresponded to volumetric flow rates of 20 to 70
l/min. Steady-state airflow can be considered an
approximation to dynamic inhalations where the
flow rate has approached the peak inspiratory value.
Figure 1: Turbuhaler Dry Powder Inhaler.
Figure 2: Turbuhaler Dry Powder Inhaler Geometry and
Grid (1 10
6
tetrahedral cells).
Eulerian-fluid/Lagrangian-particle simulations of
particle motion and deposition were conducted for
particles between 0.5-20μm in size encompassing
the single particle and particle agglomerate size
BIODEVICES 2012 - International Conference on Biomedical Electronics and Devices
6
ranges of typical pharmaceutical powders employed
in the Turbuhaler. Particles were assumed to be
released instantaneously at t = 0 and uniformly from
a surface located immediately upstream from the
powder storage site. Powder dispersion was assumed
to occur instantaneously after which no further
breakage occurred. Consequently, particles in
motion were taken to be constant in size. Upon
collision with the inhaler walls particles either
deposited or reflected. No collision-induced
breakage was examined in this work. The capture
efficiency of particles with the inhaler walls was
assumed to be either equal to one or a function of the
velocity magnitude.
2.1 Simulations of Airflow
in the Turbuhaler DPI
According to the range of volumetric airflows
examined in this work, e.g. Q = 20 - 70l/min, the
local Reynolds numbers, Re = Q ρ / μ A
1/2
, where ρ
and μ are the density and the viscosity of air and A is
the cross-sectional area, ranged from 130-16,000.
Consequently the transitional SST k-ω model was
employed to describe the transitional turbulent flows
encountered in the DPI.
Computational grids varying between 2 10
5
and
2 10
6
tetrahedral elements were employed to test for
convergence. The 1 10
6
grid was found to provide
essentially identical results as the 2 10
6
grid and was
used for the results presented in this paper. It should
be noted that the computational grid was extended
from the mouthpiece by 20mm in order to minimize
recirculation effects at the outflow surface and to
improve convergence behaviour.
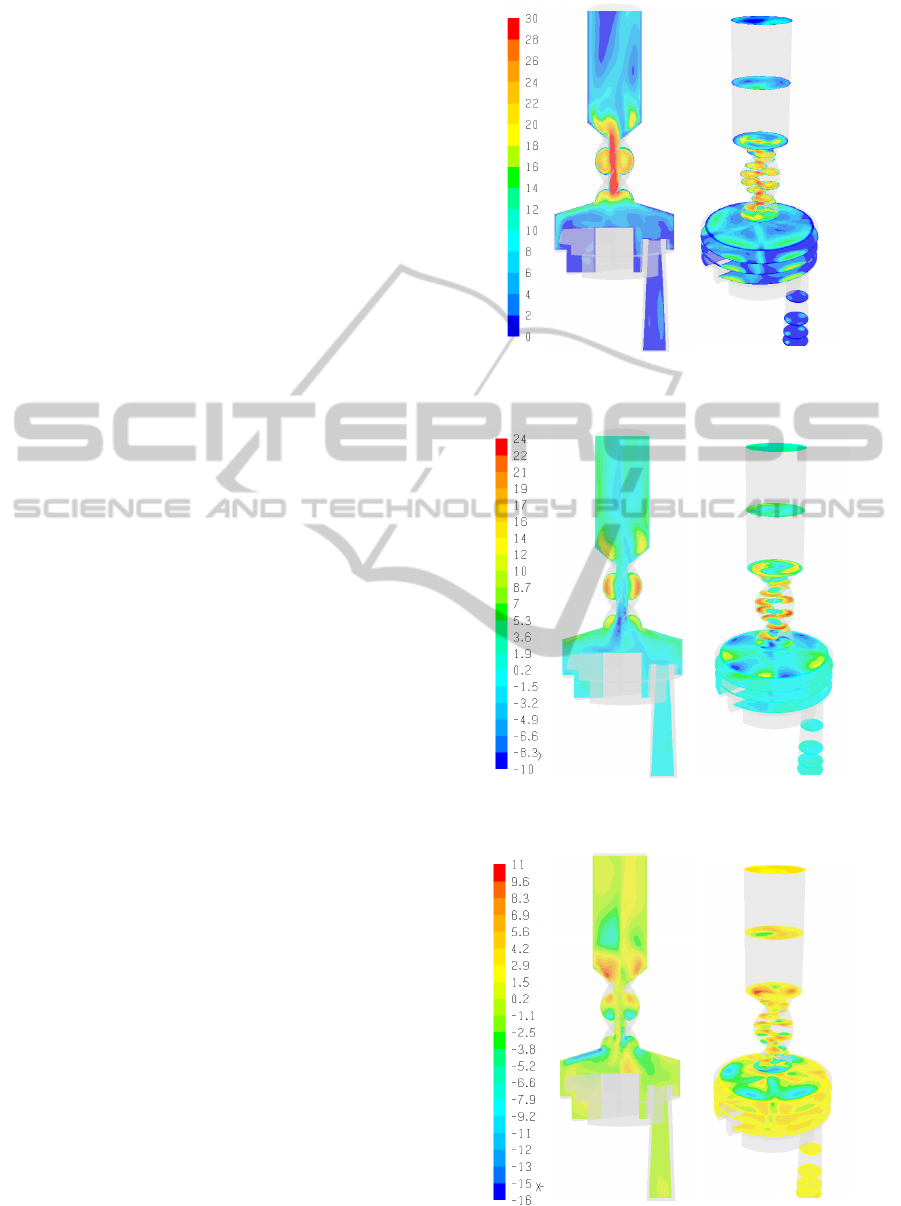
In Figures 3-5 the velocity magnitudes as well as
the tangential and radial velocities are displayed
along an axial (i.e., zx) plane and several planes
normal to the z-axis (i.e., xy sections). As can be
observed, the airflow in the DPI device is found to
be laminar in the inhalation channel with two jet
flows emanating from the powder storage cylinders.
In the dispersion chamber the flow is characterized
by large eddies and secondary flows. In the spiral
region significant tangential flows develop and
persist about halfway up the mouthpiece extension.
The tangential motion induced by the spiral airway
in the mouthpiece is significant reaching 83% of the
maximum velocity magnitude. It should be noted
that the velocity profiles observed for larger flow
rates, e.g., 60 l/min, are qualitatively similar.
Figure 3: Velocity magnitude in the Turbuhaler DPI
(mouthpiece pressure drop ΔP = 800Pa).
Figure 4: Tangential velocity in the Turbuhaler DPI
(ΔP = 800Pa).
Figure 5: Radial velocity in the Turbuhaler DPI
(ΔP = 800Pa).
FLOW AND PARTICLE DEPOSITION IN THE TURBUHALER DPI - A CFD Simulation
7
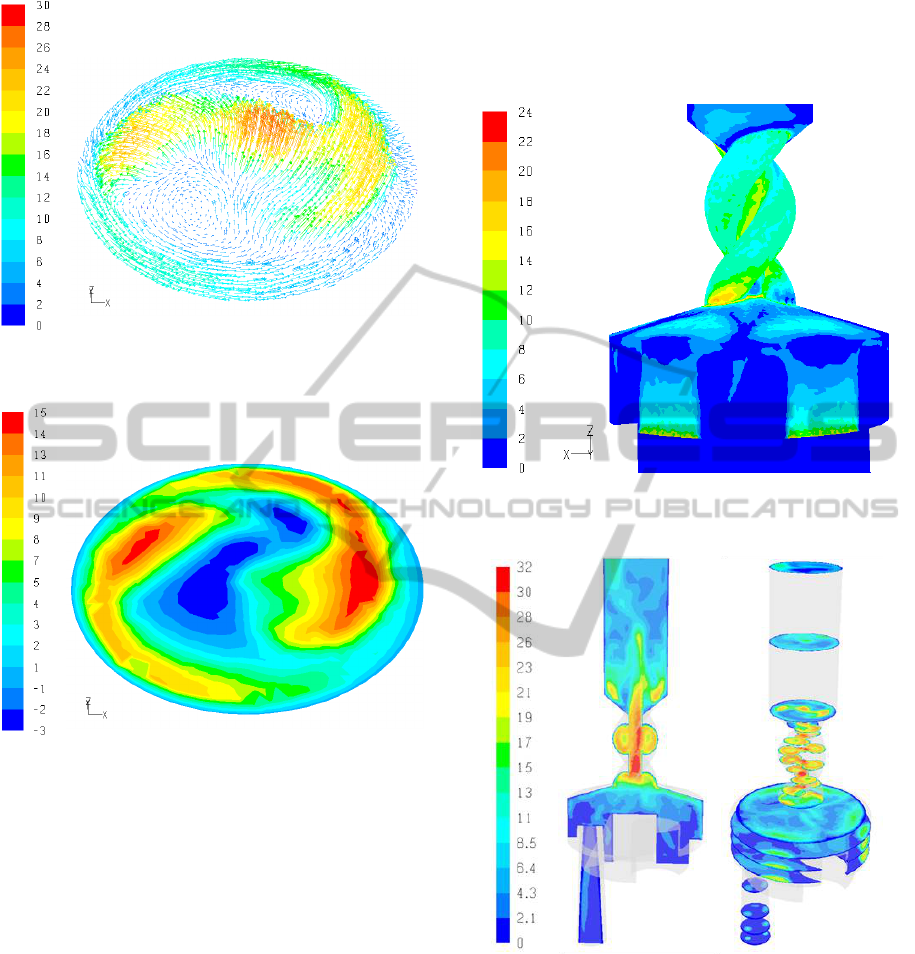
Figure 6: Velocity vectors at the mouthpiece (ΔP =
800Pa).
Figure 7: Tangential velocity at the mouthpiece
(ΔP = 800Pa).
The mouthpiece outflow of a DPI is very important
as it determines the dispersion and flow behaviour of
the particles in the oral cavity and the upper
respiratory tract and consequently influences particle
losses in the oral cavity and throat regions. In
Figures 6 and 7 the mouthpiece outflow for a
pressure drop of ΔP = 800Pa is shown in terms of
velocity magnitude and tangential velocity. It is
clear that the flow is strongly influenced from the
preceding spiral region and that the axial and
tangential components of the velocity are
nonuniform. Moreover, the strongly localized
tangential and axial airflows at the mouthpiece cause
recirculation flows in both the tangential and axial
directions, further complicating the flow.
Wall-stresses can also be determined based on the
CFD solution. In Figure 8 the wall stresses for ΔP =
800Pa are shown. It is clear that most of the wall
stresses correspond to the high flowing regions
adjacent to the dispersion chamber air inlets and
attain their maximum value at the entry and exit
regions of the spiral region.
Figure 8: Turbuhaler wall stresses.
Figure 9: Velocity magnitude in the Turbuhaler DPI –
LES results (ΔP = 800Pa).
Large Eddy Simulations, LES, fully resolve the
large scale motion of turbulent flows thus providing
more information and accurate results compared to
Reynolds Averaged Navier-Stokes approaches,
RANS, e.g., k-ε, k-ω. The computational burden of
LES is significant (e.g., at least an order of
magnitude more than with RANS models).
Consequently, only a single case (i.e., ΔP = 800Pa)
of steady-state flow of the Turbuhaler DPI was
simulated with LES using FLUENT.
BIODEVICES 2012 - International Conference on Biomedical Electronics and Devices
8
In Figure 9 the results for the mean velocity
magnitude obtained with LES is shown. The main
flow structures are similar with the k-ω SST results
in Figure 3 but, as expected, differences can be
observed in the flow details as well as in secondary
flows.
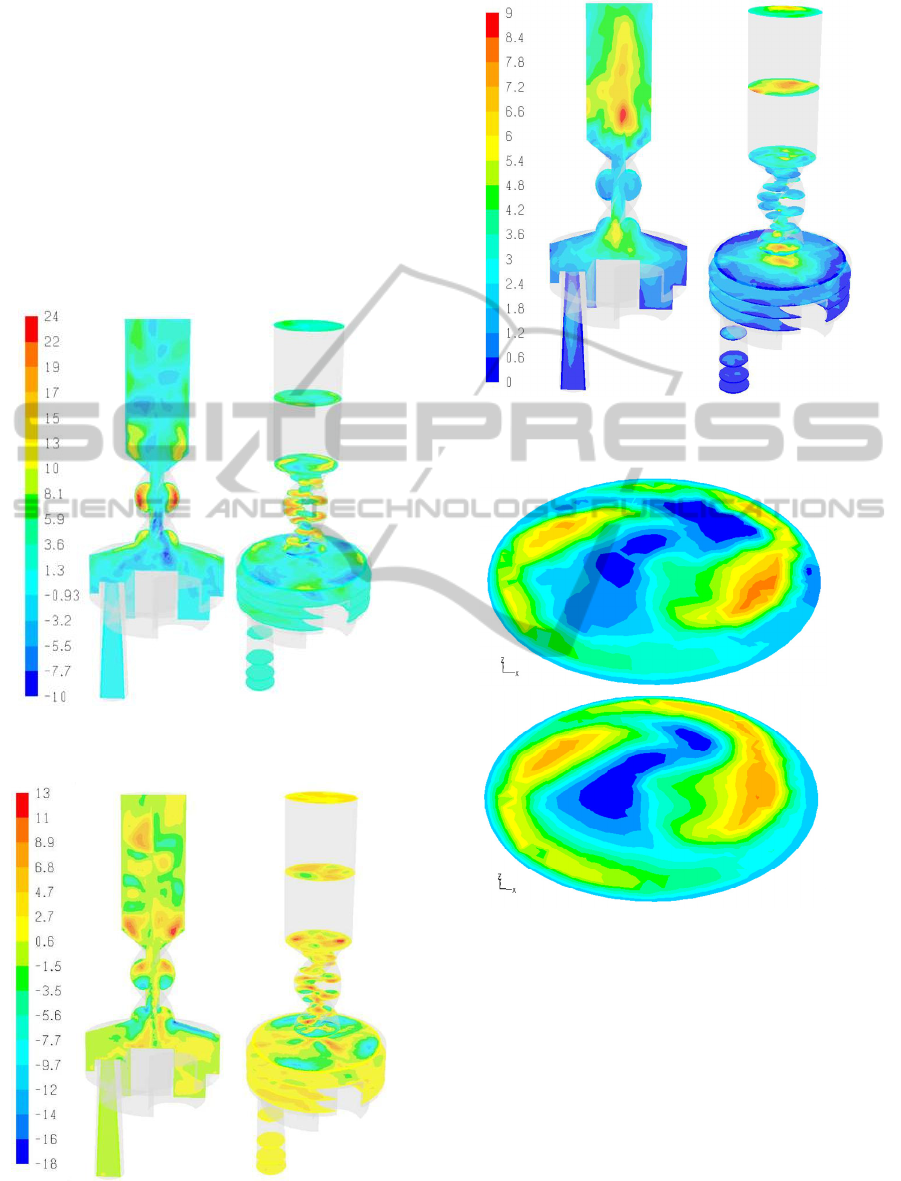
The enhanced resolution of eddies and secondary
flows with the LES is demonstrated in Figures 10
and 11 depicting the tangential and radial flow,
respectively. Compared to the radial and tangential
flows predicted with the k-ω SST model (Figures 4
and 5) there are many differences, e.g., in the large
eddies of the mouthpiece extension.
Figure 10: Tangential velocity component in the
Turbuhaler DPI – LES results (ΔP = 800Pa).
Figure 11: Radial velocity component in the Turbuhaler
DPI – LES results (ΔP = 800Pa).
Figure 12: RMS velocity magnitude in the Turbuhaler DPI
(ΔP = 800Pa).
(a)
(b)
Figure 13: Tangential velocity component at the
mouthpiece exit (ΔP = 1400Pa). (a) LES (b) k-ω SST.
In Figure 12 the magnitude of the RMS velocity
fluctuations is shown. Significant velocity
fluctuations are observed at the top of the dispersion
chamber (~6m/s) and in the mouthpiece extension
(~9m/s). The intensity of fluctuations (e.g., RMS
velocity / velocity magnitude) varies within the
device up to a value of ~50% indicating significant
local fluctuations around the mean for the length
scales of flow resolved within the LES.
The RMS fluctuations of the individual velocity
components range from 1-8m/s for the axial velocity
component and 1-4m/s for the other components
FLOW AND PARTICLE DEPOSITION IN THE TURBUHALER DPI - A CFD Simulation
9
with different spatial variations within the device.
These results demonstrate that the fundamental
assumption of local turbulence isotropy of the
RANS models is incorrect.
In Figure 13 the tangential velocities at the outlet
surface for ΔP=1400Pa are shown. It is clear that the
tangential velocities predicted by the k-ω SST and
LES turbulence models are very similar. In fact the
k-ω SST turbulence model provided the most similar
to the LES results compared to the other RANS
turbulence models (e.g., standard k-ε, RNG k-ε).
Consequently, despite the observed differences in
secondary flows (Figures 9-11) the k-ω SST model
was employed for all the simulations of this work. .
2.2 Simulation of Particle Motion and
Deposition in the Turbuhaler DPI
Eulerian-fluid/Lagrangian-particle simulations were
performed for all the flows examined in section 2.1.
These simulations are generally valid for particle
volume fractions <10%. For effective powder
dispersion the solids volume ratio in the DPI device
is approximately 10
-2
-10
-4
depending on the location
and the flow rate. Consequently, the particle phase
was assumed to not influence the airflow.
The total particle deposition in the DPI device
was determined assuming either a 100% capture
efficiency or a capture efficiency based on a critical
velocity magnitude. The later case was implemented
within FLUENT using a user-defined function for
the capture efficiency.
Single-sized simulations were performed with
particle sizes ranging from 0.5-20μm. Particle sizes
0.5-1.5μm correspond to individual particle
constituents of the agglomerates. Agglomerate
breakage and redispersion effects were not
considered. Instead, the agglomerates in the powder
storage cylinders were assumed to break-up rapidly
into their constituent particles. Clearly, agglomerate
breakage and flow occur simultaneously and this is
an area which requires further investigation.
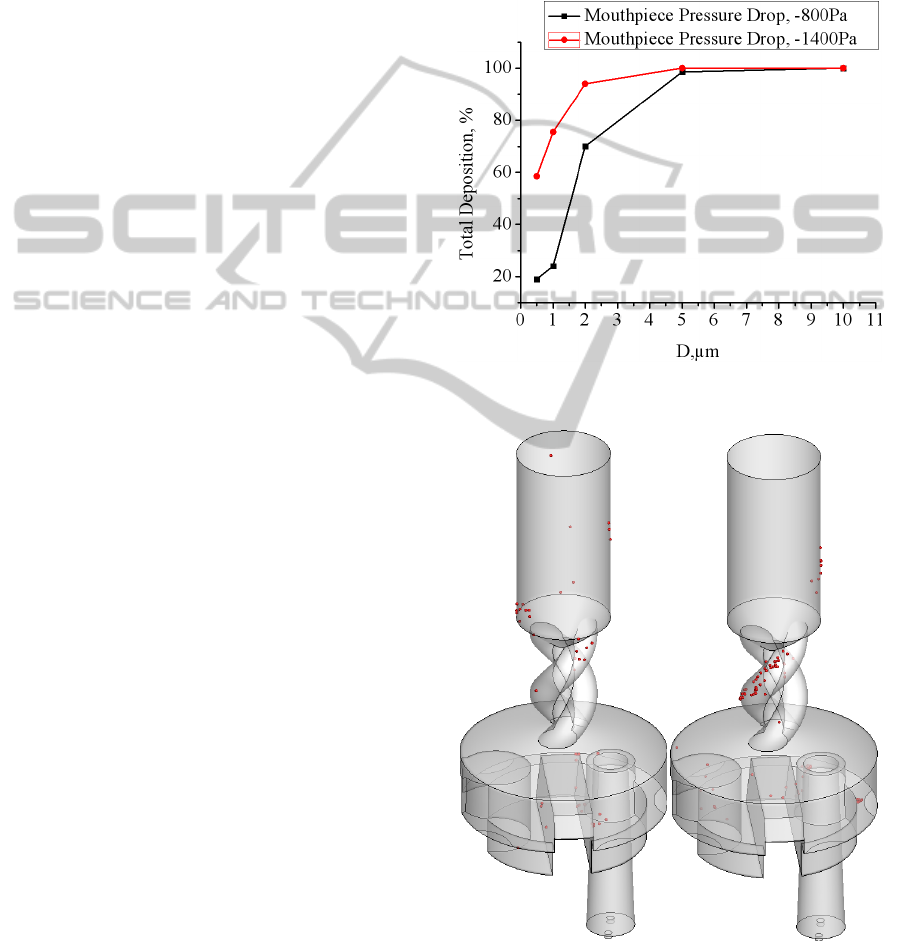
The total particle deposition in the DPI was found to
be strongly dependent on particle size. For micron
sized particles inertial forces dominate the
deposition process and for particles <100μm gravity
can be ignored during the time-scale of a single
inhalation. In Figure 14 the total depositions for
single-sized particles ranging from 0.5-10μm, for a
100% capture efficiency, and for two pressure drops,
e.g., 800 and 1400Pa, are shown. Simulations
indicate that for a pressure drop of 800Pa the
deposition of 0.5-1μm particles is 19-24% but that of
agglomerates 5-10μm is 90-100%. The predicted
total particle deposition in the DPI increases with
volumetric flow to large, and unrealistic, values
(Figure 14). Smaller deposition values can be
obtained by considering less than 100% particle
capture efficiency. Other mechanisms such as
agglomerate breakage dynamics and/or redispersion
of deposited agglomerates could also result in
smaller values of particle deposition.
Figure 14: Overall particle deposition in the Turbuhaler.
Figure 15: Particle Deposition – Effect of Pressure drop.
(a) ΔP = 800Pa, (b) ΔP = 5400Pa. D = 1μm.
BIODEVICES 2012 - International Conference on Biomedical Electronics and Devices
10
The spatial distribution of particles deposited on
the DPI walls was visualized using Tecplot. In
Figure 15 particle depositions for two pressure
drops, i.e., 800 and 5400Pa, are shown. Thus, the
larger pressure drop results increased velocities and
total particle deposition but also significantly
different particle deposition patterns. The increased
deposition for large pressure drops in the spiral
region is caused by the increased tangential flow in
this region.
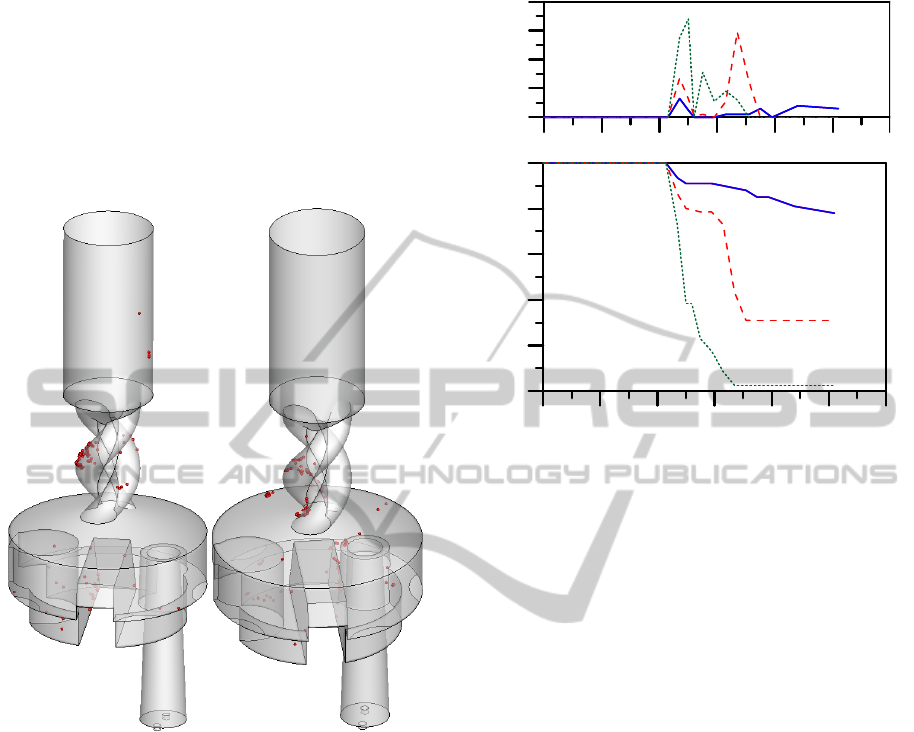
Figure 16: Particle Deposition – Effect of Particle Size. (a)
D = 2 μm, (b) D = 5 μm. ΔP = 800Pa.
In Figure 16 the effect of particle size on the
distribution of deposited particles in the DPI device
is shown. Comparing particle sizes of 1 (see Figure
15a), 2 and 5μm (Figure 16) significant differences
in the total deposition as well as the deposition
distribution are observed. The significant particle
deposition that occurs in the mouthpiece region
(which includes the spiral region0 is actually a
common problem in many commercial DPI devices
where about half the internal deposition occurs (de
Koning et al., 2001).
The results of Figures 15 and 16 can be used to
optimize the design of the DPI. For example, the
spiral region of the Turbuhaler could be redesigned
so that smaller radial and tangential velocities
develop leading to decreased particle collisions in
this region.
0.0
0.1
0.2
0.3
0.4
Absolute Deposition
2μm
5μm
1μm
(b)
0 102030405060
Axial Position, mm
0.0
0.2
0.4
0.6
0.8
1.
0
Fractional Deposition
2μm
5μm
1μm
(a)
Figure 17: Particle Deposition. (a) Fractional Cumulative
Deposition, (b) Local.Deposition (ΔP = 800Pa).
In Figure 17 the axial fractional cumulative
deposition distribution and the local fractional
deposition for ΔP = 800Pa are shown. The results
indicate significant differences in the deposition
patterns with particle size with most deposition
occurring in the dispersion chamber and the spiral
region.
2.3 Comparison to Experimental Data
The computational results of this work were
compared to the experimental results of de Koning
et al (2001) and Abdelrahim (2010) for the
Turbuhaler in terms of flow and particle deposition.
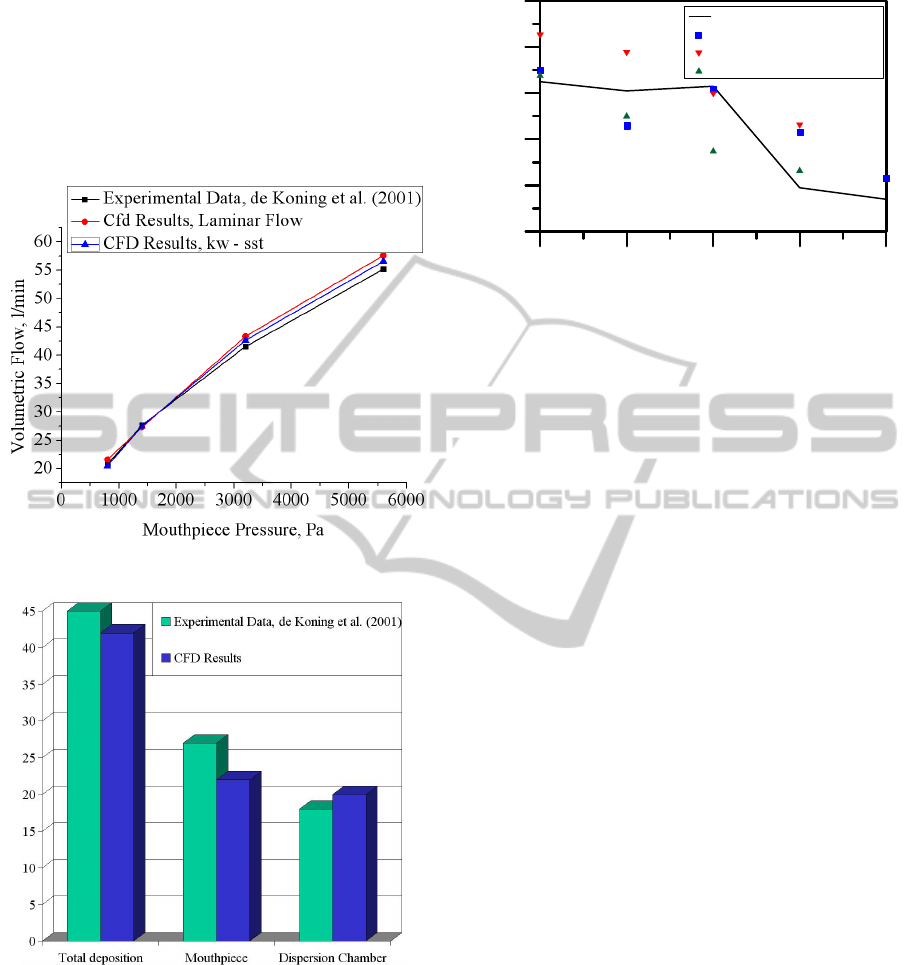
In Figure 18 the predicted steady-state volumetric
flows are plotted against the outlet pressure drop
applied at the mouthpiece. Both laminar and k-ω
SST models for flow are examined. It is clear that
both models agree very well with the experimental
data for all flow rates with the k-ω SST model being
slightly more accurate.
In Figure 19 the total, dispersion chamber, and
mouthpiece particle depositions for 1400Pa (or 30
l/min) are compared to the experimental data of de
Koning et al. (2001). A 100% capture efficiency
leads to very large total deposition values, i.e., 75%,
for this flow rate (see Figure 14) and even larger for
larger flow rates, e.g., Q>30 l/min. Consequently, in
this work the capture efficiency is related to a
FLOW AND PARTICLE DEPOSITION IN THE TURBUHALER DPI - A CFD Simulation
11
critical velocity, V
c
, above which particles reflect
(without deposition or momentum dissipation).
Assuming a critical velocity magnitude for
deposition, V
c
= 22m/s, which results in an overall
capture efficiency of ~42.5%, the mouthpiece,
dispersion chamber, and total particle deposition
results for Q = 30 l/min are in good agreement to the
experimental data.
Figure 18: Volumetric flow in the Turbuhaler.
Figure 19: Regional particle deposition in the Turbuhaler.
Q = 30 l/min. V
c
= 5m/s.
In Figure 20 the predicted total particle
deposition are compared to the experimental data of
de Koning et al (2001) and Abdelrahim (2010) for
flowrates Q = 30, 40, 50, 60 and 70 l/min and for
two different inspired volumes, i.e., 2 and 4l
(Abdelrahim, 2010). For a critical velocity of V
c
=
22 m/s and a particle diameter of D = 2μm the
agreement with the experimental data is good
considering the different experimental conditions
30 40 50 60 70
Flow Rate, l/min
10
20
30
40
50
6
0
% Total Deposition
: CFD Results
: de Koning et al. (2001)
: Abdelrahim (2010) 2l
: Abdelrahim (2010) 4l
Figure 20: Total particle deposition in the Turbuhaler. D =
2 μm. V
c
= 22 m/s. Comparison between experimental
results of de Koning et al. (2001), Abdelrahim (2010) and
computational CFD results.
(e.g., dynamic inhalation vs. steady state
simulations) and the simplicity of the particle
deposition model (e.g., velocity cut-off capture
efficiency and single-size size distribution).
3 CONCLUSIONS
This work has demonstrated the use of CFD to
determine the complicated airflow as well as particle
motion and deposition in the Turbuhaler DPI. As the
flow was either locally laminar or transitionally
turbulent the transitional SST k-ω model for
turbulence was employed. LES results revealed
some differences in the large eddies and secondary
flows but were otherwise closest to the k-ω SST
results. The simulations revealed complicated flows
with intense recirculation patterns in the dispersion
chamber and strong tangential flows in the spiral
region of the mouthpiece.
Particle deposition was found to depend on size
and flow rate and occurred predominantly in the
dispersion chamber and the mouthpiece. The
computational solutions were compared to
experimental data for volumetric flow and regional
deposition of de Koning et al. (2001) and good
agreement was observed for volumetric flow.
Particle deposition data were in agreement to
experimental data only for capture efficiencies less
than 100%. A simple capture efficiency model
assuming a critical velocity limit for particle capture
was found to produce total particle depositions
similar to the experimental values of de Koning et al
(2001) and Abdelrahim (2010).
Future work will involve dynamic inhalations
and will elaborate on the particle capture efficiency
BIODEVICES 2012 - International Conference on Biomedical Electronics and Devices
12

model. The capture efficiency can be determined
more accurately based on collision angle, velocity
magnitude, particle properties (e.g., size, shape, and
charge), surface properties (e.g., roughness, charge),
as well as particle/surface cohesion forces.
REFERENCES
Abdelrahim, ME (2010) Emitted dose and lung deposition
of inhaled terbutaline from Turbuhaler at different
conditions, Respiratory Medicine, 104, 682-689.
Alagusundaram M, N Deepthi, S Ramkanth, S
Angalaparameswari, TSM Saleem, K Gnanaprakash,
VS Thiruvengadarajan, C Madhusudhana, CM
Alagusundaram et al. (2010) Dry Powder Inhalers -
An Overview, Int. J. Res. Pharm. Sci., 1(1), 34-42.
Ashurst I, A Malton, D Prime and B Sumby (2000) Latest
advances in the development of dry powder inhalers,
PSTT, 3(7), 246-256.
Calvert G, A Hassanpour, M Ghadiri (2011) Mechanistic
analysis and computer simulation of the aerodynamic
dispersion of loose aggregates, Chemical Engineering
Research and Design, 89, 519–525.
Chan H-K (2006) Dry powder aerosol drug delivery –
Opportunities for colloid and surface scientists,
Colloids and Surfaces A: Physicochem. Eng. Aspects,
284-285, 50-55.
Coates MS, DF Fletcher, H-K Chan and JA Raper (2004)
Effect of Design on the Performance of a Dry Powder
Inhaler Using Computational Fluid Dynamics. Part 1:
Grid Structure and Mouthpiece Length, J. of
Pharmaceutical Sciences, 93, 2863–2876.
Coates MS, H-K Chan, DF Fletcher and JA Raper (2005)
Influence of Air Flow on the Performance of a Dry
Powder Inhaler Using Computational and
Experimental Analyses, Pharmaceutical Research,
22(9), 923-932.
Coates MS, H-K Chan, DF Fletcher and JA Raper (2006)
Effect of Design on the Performance of a Dry Powder
Inhaler Using Computational Fluid Dynamics. Part 2:
Air Inlet Size, J. of Pharmaceutical Sciences, 95(6),
1382-1392.
de Koning JP, MR Visser, GA Oelen, AH de Boer, ThW
van der Mark, PMJ Coenegracht, ThFJ Tromp and
HW Frijlink (2001) Effect of Peak Inspiratory Flow
and Flow Increase Rate on In Vitro Drug Deposition
from Four Dry Powder Inhaler Devices, in Dry
Powder Inhalation: Technical and Physiological
Aspects, Prescribing and Use, Thesis,
Rijksuniversiteit Groningen, Ch. 6., 83-94.
Finlay W. (2001) The Mechanics of Inhaled
Pharmaceutical Aerosols. An Introduction, Academic
Press, London.
French DL, DA Edwards and RW Niven (1996) The
Influence of Formulation on Emission Deaggregation
and Deposition of Dry Powders for Inhalation, J.
Aerosol Sci., 27(5), 769-783.
Hoe S, D Traini, H-K Chan, PM Young (2009) Measuring
charge and mass distributions in dry powder inhalers
using the electrical Next Generation Impactor (eNGI),
European J. of Pharmaceutical Science, 38, 88-94.
Islam N and E Gladki (2008) Dry powder inhalers (DPIs) -
A review of device reliability and innovation, Int. J. of
Pharmaceutics, 360, 1-11.
Ligotke MW (2002) Development and characterization of
a dry powder inhaler. In: Dalby RN, Byron PR, Peart
J, Farr SJ, editors. Respiratory drug delivery VIII, vol.
I. Tucson, AZ: Serentec Press Inc., 419–422.
Newman SP and WW Busse (2002) Evolution of dry
powder inhaler design, formulation, and performance,
Respir Med., 96(5), 293-304.
Olsson et al. Patent Application Publication. Pub. No. US
2007/0107721 A1. Pub. Date: May, 17, 2007.
Schuler C, A Bakshi, D Tuttle, A Smith, S Paboojian, H
Snyder, D Rasmussen, A Clark (1999) Inhale’s dry-
powder pulmonary drug delivery system: Challenges
to current modeling of gas-solid flows. In:
Proceedings of FEDSM99: 3rd ASME/JSME joint
fluids engineering conference and 1999 ASME Fluids
Engineering summer meeting, FEDSM99-7895.
Tobyn M, JN Staniforth, D Morton, Q Harmer and ME
Newton (2004) Active and intelligent inhaler device
development, Int. J. of Pharmaceutics 277, 31–37.
Tong ZB, RY Yang, KW Chu, AB Yu, S Adi, H-K Chan
(2010) Numerical study of the effects of particle size
and polydispersity on the agglomerate dispersion in a
cyclonic flow, Chemical Engineering Journal 164,
432–441.
Tsima MP, GP Martin, C Marriott, D Gardenton and M
Yianneskis (1994) Drug delivery to the respiratory
tract using dry powder inhaler, Int. J. of
Pharmaceutics, 101, 1-13.
Wetterlin K (1988) Turbuhaler: A New Powder Inhaler for
Administration of Drugs to the Airways.
Pharmaceutical Research, 5(8), 506-508.
Zeng X-M, GP Martin, C Marriott and J Pritchard (2000)
The influence of carrier morphology on drug delivery
by dry powder inhalers, Int. J. of Pharmaceutics, 200,
93–106.
FLOW AND PARTICLE DEPOSITION IN THE TURBUHALER DPI - A CFD Simulation
13
