
KINEMATIC FEATURES OF REACH AND GRASP MOVEMENTS IN
STROKE REHABILITATION USING ACCELEROMETERS
Julien Stamatakis
1
, Adriana Gonzalez
1
, Benoit Caby
1
, Stephanie Lefebvre
2,3
,
Yves Vandermeeren
2,3
and Benoit Macq
1
1
Institute of Information and Communication Technologies, Electronics and Applied Mathematics
Universit
´
e catholique de Louvain, Louvain-la-Neuve, Belgium
2
Institute of NeuroSciences, Universit
´
e catholique de Louvain, Brussels, Belgium
3
Department of Neurology, Cliniques Universitaires de Mont-Godinne, Universit
´
e catholique de Louvain, Yvoir, Belgium
Keywords:
Accelerometers, Codamotion, Kalman Filter, Kinematic Analysis, Stroke.
Abstract:
Rehabilitation is an essential process to recover impaired motor functions after stroke. Typically, visual
marker-based systems such as the Codamotion are used, as kinematic analyses seem to be an excellent tool
to quantify objectively the effects of rehabilitation processes. However, this solution remains expensive. A
low-cost accelerometer-based system has been developed and its performances were compared to those of the
Codamotion system, used as a gold standard. Thanks to a model for prediction and an error model Kalman
filter, the recorded signals were broken up into gravity and dynamic accelerations components that were placed
in a global frame and compared to the Codamotion signals. The vertical z-axis was well reconstructed and
used as a basis for kinematic analyses. Different features expressing movement speed, control strategy or
movement smoothness have been computed from both systems and compared. Despite the fact that some of
them showed differences between both systems, the accelerometer-based system computed features with a
discriminant power comparable to the ones derived from the Codamotion. In conclusion, this accelerometer-
based system is a low-cost alternative to expensive visual marker-based systems that could be extensively used
for rehabilitation processes in routine clinical practice or even at home.
1 INTRODUCTION
Stroke is one of the leading causes of brain function
impairment, affecting motor, visual and speech abili-
ties. The inability to perform motor tasks has major
consequences on daily-life activities, leading to dis-
ability and loss of autonomy. Although some of those
motor functions may be recovered spontaneously, a
rehabilitation therapy is needed in most cases (Zhou
et al., 2008). It has been shown that targeted reha-
bilitative strategies can help the patient to regain and
relearn the impaired motor skills (Zhou et al., 2008;
Cirstea and Levin, 2007; Caimmi et al., 2008). To de-
velop and refine such strategies, the patient motions
need to be monitored, in order to follow the evolu-
tion of the treatment, to supervise the correct perfor-
mances of the rehabilitation and to help correcting
some movements (Zhou and Hu, 2008). Rehabilita-
tion has to focus on daily-life tasks such as reach-
ing and grasping an object. This relatively complex
task involves the selection and control of the finger
grip aperture according to the size and shape of an
object, as well as the transport of the hand towards
the target. Several studies have been dedicated to
the evaluation of revalidation methods and treatments
(Caimmi et al., 2008; Wu et al., 2000). Kinematic
analyses seem to be an excellent and very sensitive
tool to quantify the effects of rehabilitation processes
on motor performances (Caimmi et al., 2008). Fea-
tures representing speed, accuracy or efficiency can
be extracted all along the rehabilitation process (Lang
et al., 2006) in order to assess the evolution of the re-
covery. Several systems have been developed over the
past decade in order to track human motion for kine-
matic analyses (Zhou and Hu, 2008). Visual marker-
based tracking systems such as VICON or Codamo-
tion are often used as gold standards because of their
accuracy. However, these systems are expensive and
cannot currently be applied at home or in the daily-life
environment of the patients. Other systems based on
inertial sensors like accelerometers and gyroscopes
(Kavanagh and Menz, 2008) have also been devel-
199
Stamatakis J., Gonzalez A., Caby B., Lefebvre S., Vandermeeren Y. and Macq B..
KINEMATIC FEATURES OF REACH AND GRASP MOVEMENTS IN STROKE REHABILITATION USING ACCELEROMETERS.
DOI: 10.5220/0003711701990205
In Proceedings of the International Conference on Bio-inspired Systems and Signal Processing (BIOSIGNALS-2012), pages 199-205
ISBN: 978-989-8425-89-8
Copyright
c
2012 SCITEPRESS (Science and Technology Publications, Lda.)

oped. They are small, low-cost and well adapted for
portable devices. These systems are widely used in
the medical field to detect physical activity, to pre-
vent falls of the elderly or to track upper limb motions
(Zhou et al., 2008). Multiple inertial sensors can be
combined but the size is then increased and the cali-
bration method becomes more complex.
In this paper, the development of a low-cost inertial
system based exclusively on accelerometers for kine-
matic analyses is proposed. Such a system is physi-
cally compact and can be used in daily-life environ-
ments. Few studies have focused on the exclusive
use of accelerometers. Indeed, since the measure-
ment contains gravitational, kinematic and noise com-
ponents, the dynamic acceleration is difficult to ex-
tract without some extra information. The extraction
of the dynamic acceleration in each sensor frame is
based on the frequential properties of the movements,
as proposed in Luinge and Veltink (2004). These ac-
celerations are then placed in a global frame through
a frame transformation. This system is used to ex-
tract kinematic features from reach and grasp move-
ments that are compared to those extracted from the
Codamotion system, used as ground truth.
2 MATERIAL AND METHODS
The Codamotion system (Charnwood Dynamics,
Rothley, UK) is based on active markers and in-
frared cameras, allowing the 3-D measurement of
each marker position. In the global Codamotion
frame, the horizontal x axis is parallel to the move-
ment direction, the horizontal y axis is perpendicu-
lar to x and z is the vertical axis. At a 3 m distance,
the accuracy is ±1.5 mm in x and z axes, and ±2.5
mm in y axis for peak-to-peak deviations from ac-
tual position (Zhou and Hu, 2008). The sampling fre-
quency is set to 200 Hz. The low-cost accelerome-
ter system is composed of three 3-axis accelerome-
ters, recording ±2.5 g accelerations at the sampling
rate of 66.67 Hz (1g = 9.81m/s
2
). In each sensor
frame, the x axis is tangent to the limb, y is horizon-
tally perpendicular to x and z is the normal axis to
the limb. The accuracy on the accelerations is ±0.01
g. Accelerometers have been calibrated using a min-
imization function based on the norm and direction
of the gravity field. All data have been processed
with Matlab (MathWorks, Natick, MA, USA). Sub-
jects were recruited at Cliniques Universitaires UCL
de Mont-Godinne; they provided written informed
consent. This research protocol has been approved by
the local ethical committee. Two hemiparetic stroke
patients (mRS = 2) and three healthy volunteers have
been included. Each subject had to execute 15 reach
and grasp movements at comfortable speed. They
were seated on a chair in front of the target, which was
placed at a comfortable reaching distance, i.e. 90% of
the total arm length. Each movement began with the
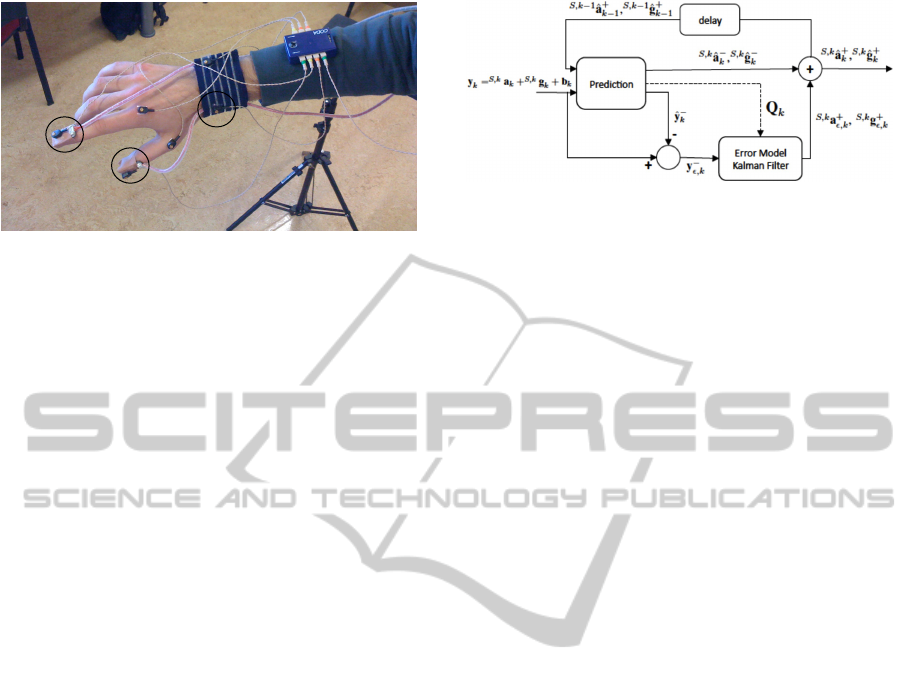
hand resting on the legs. Sensors and active markers
were placed on the index nail, thumb nail and on the
wrist of the most affected arm for the patients and on
the dominant hand for the healthy volunteers, as illus-
trated in Figure 1. The results are presented for the
sensor and the marker that were placed on the wrist.
In order to extract kinematic features of the reach
and grasp movements, the dynamic accelerations due
to movements were extracted from the accelerom-
eter signals using a Complementary Kalman Filter.
The dynamic accelerations were expressed in the Co-
damotion global frame, instead of the sensor frame,
to compare the reconstructed signal to the Codamo-
tion signal in each axis. Then, some of the most
commonly used features were computed for both sys-
tems and compared. The first feature is the Total
Movement Time (TMT) (Trombly, 1993; Chang et al.,
2005; Caimmi et al., 2008), computed as the time nec-
essary to operate the whole reach and grasp move-
ment; it is supposed longer for hemiparetic patients
(Lang et al., 2006; Michaelsen et al., 2004). The
second one is the number of Movement Units (MU),
which allows to evaluate the smoothness of the move-
ment (Trombly, 1993; Wu et al., 2007). A MU rep-
resents an increase of more than 10% of the maxi-
mum velocity between adjacent minimum and maxi-
mum in the velocity profile; it is supposed higher for
pathological patients (Chang et al., 2005) since they
have numerous, corrective and small movements. The
third feature is the Normalized Jerk (NJ), defined in
(1), where T is the total movement time, j is the jerk,
i.e. the derivative of the acceleration, and D is the
total distance of the reach and grasp movement path
in space. This represents another feature to evaluate
the smoothness of the movement, that is supposed to
be lower for healthy subjects (Caimmi et al., 2008;
Chang et al., 2005).
NJ =
s
T
5
2D
2
Z
T
stop
T
start
j
2
(t) dt (1)
The other features are the Peak Wrist Velocity
(PWV) and the percentage time to reach this value
(TPWV) (Trombly, 1993; Michaelsen et al., 2004;
Lang et al., 2006; Chang et al., 2005). PWV is usu-
ally used to reflect the level of force generation (i.e. a
high PWV is indicative of a high level of force genera-
tion) while TPWV reflects the control strategy (Chang
et al., 2005) (i.e. TPWV will express whether the
peak velocity is generated early or late in the move-
BIOSIGNALS 2012 - International Conference on Bio-inspired Systems and Signal Processing
200
!"
#"
Figure 1: A. The accelerometers are placed on the finger
nail, thumb nail and on the wrist. B. The active markers are
placed above the accelerometers; the other markers are not
used here.
ment). Both are supposed to be lower for the hemi-
paretic patients.
3 COMPLEMENTARY KALMAN
FILTER
Although accelerometers do not depend on any exter-
nal reference, they are bound to the gravity field and
therefore their output signal is dependent of both the
tilt angle and the actual acceleration. The first step in
order to recover the accelerations due to movements
(a) is thus to remove the gravity (g) components from
the recorded signals (y). The signal is also affected by
the bias (b), an intrinsic parameter of the accelerome-
ter, that is reflected by an offset in the output signal.
a = y − g − b (2)
Luinge and Veltink (2004) have worked on the ex-
traction of the gravity and offset components from the
accelerometer signal, considering as noise the accel-
eration component caused by movement. They stated
that when the movement acceleration is sufficiently
small in comparison to the gravity, the accelerometer
can be used as an inclinometer. To perform such an
extraction, they used a Complementary Kalman Fil-
ter. In this paper, the design is based on their method
but instead of extracting the gravity and the offset,
the idea is to extract the dynamic acceleration and the
gravity.
The Complementary Kalman Filter or error-state
Kalman Filter enables to combine two media (Hig-
gins, 1975). It takes one as reference, works with
the estimation of the difference between them and
uses this estimation to update the other one (Welch
and Bishop, 2001). It is often used to combine two
sensors but, in this case, it combines one sensor and
one prediction step as described in Figure 2. Further-
more, it allows the use of a linear Kalman filter while
Figure 2: Complementary Kalman Filter with sensor and
prediction values as inputs. The superscript − reprensents
an a priori value and the superscript + represents an a pos-
teriori value. A hat on the top of a symbol is used to indi-
cate an estimation. k represents the current value and k − 1
the one of the previous time step. The superscript S means
that values are expressed in the Sensor frame while the su-
perscript G means that values are expressed in the Global
frame (Codamotion).
non-linear processes can be used during the predic-
tion step. Here, an autoregressive (AR) model is set
up.
The a posteriori estimates of the acceleration
and gravity (
S,k−1
ˆ
a
+
k−1
,
S,k−1
ˆ
g
+
k−1
) from the previous
time step are used to make an a priori estimation of
the acceleration and gravity, and thus to predict the
sensor output vector
ˆ
y
−
k
. The difference y
−
ε,k
between
the a priori predicted accelerometer output
ˆ
y
−
k
and
the actual output y
k
represents the a priori prediction
error of the acceleration and gravity (
S,k
a
−
ε,k
,
S,k
g
−
ε,k
).
Then, the Kalman filter uses y
−
ε,k
and the variance
of the predicted components Q
k
to generate the a
posteriori prediction error (
S,k
a
+
ε,k
,
S,k
g
+
ε,k
) that will
be used for the update of the acceleration and gravity
predictions, resulting in their a posteriori estimations
(
S,k
ˆ
a
+
k
,
S,k
ˆ
g
+
k
).
This model is only valid if the accelerometer out-
put signal meets the conditions exposed by Luinge
and Veltink (2004). As shown in Figure 2, the Com-
plementary Kalman Filter is composed by two phases
: one for the prediction and the other for the error
model Kalman filter. The prediction phase consists
in modeling the behaviour of acceleration and gravity
signals for specific movement, as presented for grav-
ity in Luinge and Veltink (2004). The acceleration
is modeled as an AR process, which is a time se-
ries analysis model based on the previous weighted
outputs of the system (3). The AR modeling pro-
cess is based on the spectrum of the signal, thus the
coefficients of the AR model describe the frequency
changes of the signal.
S,k−1
ˆ
a
−
k
= −
p
∑
i=1
ϕ
S,k−i
i
ˆ
a
+
k−i
+ ε
k
(3)
The error model Kalman filter consists in the estima-
KINEMATIC FEATURES OF REACH AND GRASP MOVEMENTS IN STROKE REHABILITATION USING
ACCELEROMETERS
201
tion of the a posteriori prediction errors of the ac-
celeration and gravity from their a priori values and
the error covariance via Kalman filtering (Luinge and
Veltink, 2004). The state vector x
ε,k
is defined with
the state variables a
ε,k
and g
ε,k
, corresponding to the
prediction errors of acceleration and gravity, respec-
tively (4).
x
ε,k
=
a
T
ε,k
g
T
ε,k
T
(4)
The bias b
k
is considered as noise and not as a state
variable because the system is not able to distinguish
between a
k
and b
k
, since both of them are unknown.
Therefore, the extracted acceleration components will
contain an offset due to this bias, that will be removed
by high-pass filtering.
As the accelerometers do not have any exter-
nal reference, their signals are referred to the sen-
sor frame. Although the reconstructed acceleration
signal norms can be directly compared between sys-
tems, both systems must have the same reference to
compare the reconstructed signals to the Codamotion
output for each axis. It is thus necessary to put the
extracted accelerations, expressed in the local sensor
frame, into the global Codamotion frame via a frame
transformation. In order to do so, the constant expres-
sion of the gravity in the global frame
G
g is used. The
matrix M
k
, called the Rotation Matrix, is defined as
the rotation between each
S,k
g
+
k
(gravity expressed in
the sensor frame) and
G
g. Using M
k
, it is possible
to change the reference frame of the accelerations, in
order to formulate it in the global frame.
G
a
x,k
G
a
y,k
G
a
z,k
= M
k
S,k
a
+
x,k
S,k
a
+
y,k
S,k
a
+
z,k
(5)
Once the extracted accelerations are referenced in the
global coordinate frame, they need to be multiplied
by the constant of gravity g
C
= 9.81 m/s
2
in order to
have values in the MKS system of units.
4 EXPERIMENTAL VALIDATION
The first step was to set up a model for the predic-
tion of the dynamic accelerations. This model has
been built with the data recorded by the Codamo-
tion for one healthy volunteer who was not part of
the experimental group (pilot data). The parameters
of the prediction step have been chosen experimen-
tally. The recorded accelerations from the Codamo-
tion were then down-sampled to match the accelerom-
eters sampling frequency, i.e. 66,67 Hz.
Once extracted, the dynamic accelerations were
high-pass filtered (cut-off frequency of 0.4 Hz) in or-
A B
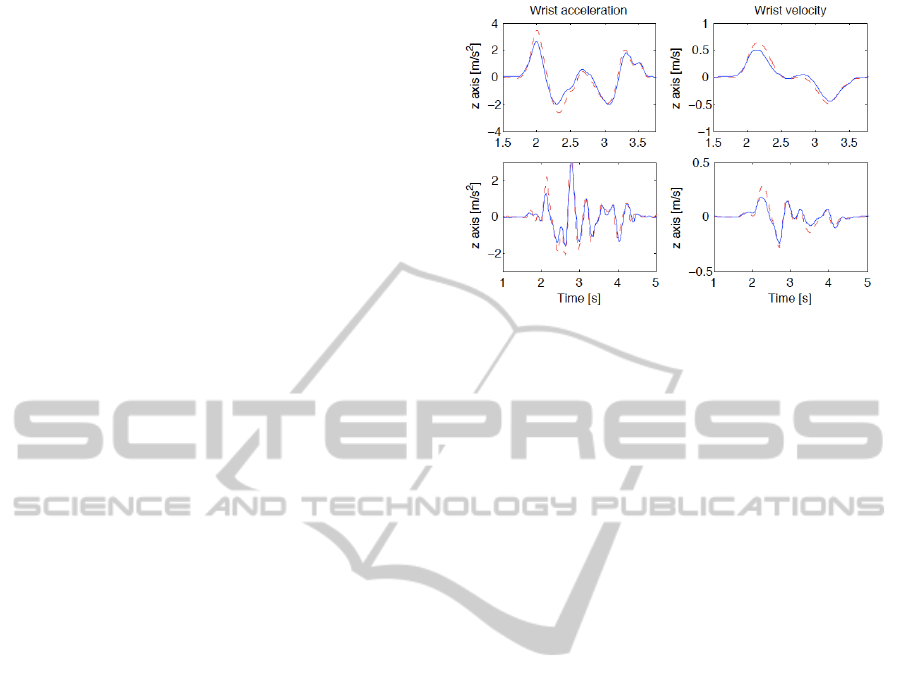
D
C
Figure 3: Accelerations and velocities for the wrist sensor.
The dashed curve is the Codamotion signal while the con-
tinuous one represents the reconstructed signal from the ac-
celerometers. Figures A and B represent the accelerations
and velocities in the global z axis for a healthy volunteer,
while Figures C and D represent the accelerations and ve-
locities for a hemiparetic patient.
der to remove the remaining bias. Then, they were in-
tegrated to obtain the velocities, which have also been
high-pass filtered to remove the drift. All signals were
also low-pass filtered at the cut-off frequency of 5 Hz.
As the features are usually extracted on the sig-
nal norms, the reconstructed acceleration norms and
the Codamotion acceleration norms have been com-
pared, as well as axis-by-axis. The correlation coeffi-
cients (r) and the mean square error (MSE) between
signals have been computed, for accelerations and ve-
locities respectively, and are presented in Table 1 and
2. Even if the norms are correlated, the reconstruc-
tion is not precise enough for feature extraction. The
main observation is that the best reconstruction is in
the z axis, whose signals are presented in Figure 3 for
a healthy volunteer and a hemiparetic patient. The x
and y axes are poorly reconstructed. This is due to
two different causes. The first one is the frame trans-
formation. Indeed, only the z direction, the direction
of the gravity, is known; whatever the orientation of
the x and y axes,
G
g will remain the same. So, the
accelerations are transformed to match the correct z
direction, but not to match the directions of x and y.
This problem remains for the velocities, as velocities
are obtained from the integration of the acceleration
signals. Secondly, according to the signals compar-
ison, the reconstructed norm is affected by a poorly
reconstruction in the x and y axes, as the z axis is
very well reconstructed. The y axis gives the worst
reconstruction. This direction is not really part of the
movement as it is performed in the x − z plane. There
are only small displacements along this axis, giving
an unprecise model for the accelerations in that par-
ticular direction.
BIOSIGNALS 2012 - International Conference on Bio-inspired Systems and Signal Processing
202

Table 1: Performances of accelerations reconstruction.
Healthy Hemiparetic
Group Group
Sensor axis r MSE r MSE
Wrist norm 0.608 0.790 0.675 0.374
x 0.736 1.359 0.572 0.773
y -0.150 2.462 0.625 0.686
z 0.934 0.284 0.899 0.239
Table 2: Performances of velocities reconstruction.
Healthy Hemiparetic
Group Group
Sensor axis r MSE r MSE
Wrist norm 0.437 0.092 0.635 0.063
x 0.314 0.174 0.258 0.087
y -0.375 0.149 0.440 0.046
z 0.949 0.008 0.875 0.010
According to these observations, the feature ex-
traction will not be performed on the signal norms, as
it is done for the Codamotion system. Indeed, the er-
rors on the x and y axes are too large to lead to accept-
able approximations of the signal norms. Instead, the
feature extraction will be based on the z axis for the
accelerometer-based system. Section 5 will demon-
strate that the two extraction methods have the same
discriminant power.
5 FEATURE EXTRACTION
The extracted features have already been shown dis-
criminant between hemiparetic and healthy subjects
when extracted with an optical system (Lang et al.,
2006; Michaelsen et al., 2004; Chang et al., 2005;
Caimmi et al., 2008). The purpose is to demon-
strate that these discriminant features have the same
behavior when extracted on the z axis of the recon-
structed accelerations and velocities. In order to do
so, random effect models (Brown and Prescott, 1999)
were built using the computing environment R (Ihaka
and Gentleman, 1996) and the NLME (Nonlinear and
Linear Mixed Effects models) package (Pinheiro and
Bates, 2006). For each feature and for each system,
a random effect model was built with one fixed ef-
fect (state, i.e. healthy or hemiparetic) and one ran-
dom effect (subject). The p-value associated with the
fixed effect state determines if the output is signif-
icantly different between the two states for a given
feature and a given system. As subject is fitted as a
random effect in the models, inference is not specific
to the observed subject but can be applied to the full
population of subjects. For each feature, a random
effect model was also built with three fixed effects
(state, system, state × system) and two random effects
(subject, trial). In this case, the p-value associated
to the fixed interaction effect (system × state) deter-
mines whether the differences between the two states
are significantly different for both systems. If not, an-
other model without the fixed interaction effect was
built to determine if the extracted features were sig-
nificantly different between the two systems (system
effect). All data have been transformed through a log
function to meet the homoscedasticity hypothesis.
TMT (Total Movement Time) has first been extracted.
The correlation between sensors is statistically sig-
nificant (r = 0.967, p < 0.001 for the healthy group
and r = 0.729, p < 0.001 for the hemiparetic group).
For both sensors, TMT is significantly shorter for the
healthy group (p < 0.05). There is neither interaction
nor system effect.
The MU (Movement Unit) has then been computed on
the velocities. There is no correlation between sys-
tems for the healthy group but a low significant one
for the hemiparetic group (r = 0.479, p < 0.05). MU
is significantly lower for the healthy group for both
systems (p < 0.001 for the Codamotion and p < 0.05
for the accelerometer-based system) and there is no
interaction effect. There is a significant system effect
(p < 0.001).
For the computation of the NJ (Normalized Jerk), the
reach and the grasp distances have been approximated
by half the arm length as those values were not avail-
able for the accelerometer-based system. For both
groups, the values are correlated between systems
(r = 0.594, p < 0.01 and r = 0.621, p < 0.01). NJ is
significantly shorter for the healthy group (p < 0.05
and p < 0.01). There is no interaction effect but a
significant system effect (p < 0.001).
PWV (Peak Wrist Velocity) shows a significant cor-
relation between the values of the two systems for the
hemiparetic group (r = 0.661, p < 0.001) but not for
the healthy group. There is no significant difference
between the groups for any system but there is a sys-
tem effect (p < 0.001).
TPWV (percentage Time to Peak Wrist Velocity)
does not show any significant difference or effect be-
tween groups or systems but the values are corre-
lated between systems, for both groups (r = 0.695,
p < 0.001 and r = 0.938, p < 0.001).
6 DISCUSSION
Discriminant kinematic features have been extracted
from both systems in order to compare the perfor-
mances of the accelerometer-based system to the Co-
KINEMATIC FEATURES OF REACH AND GRASP MOVEMENTS IN STROKE REHABILITATION USING
ACCELEROMETERS
203

Table 3: Mean features values.
Healthy Hemiparetic
Feature Accel. Coda. Accel. Coda.
TMT (s) 2.134 2.094 3.613 3.624
MU (-) 3.194 2.027 6.625 4.875
NJ (-) 69.33 54.95 297.3 229.2
PWV (m/s) 0.557 0.865 0.465 0.599
TPWV (%) 33.78 30.01 30.45 27.06
damotion, used as ground truth. These kinematic fea-
tures, i.e. TMT, MU, NJ, PWV and TPWV have been
extracted on the z axis of the reconstructed signals
for the accelerometer-based system and on the signal
norms for the Codamotion. All features were signif-
icantly correlated between systems, for both groups,
except for MU and PWV in the healthy group. TMT,
MU and NJ have been found to be discriminant fea-
tures, as expected, while PWV and TPWV have not.
However, the important observation is that both sys-
tems are discrimant for TMT, MU and NJ, and not
discriminant for PWV and TPWV, leading to the same
discriminant and non-discriminant features. There is
no interaction effect for any feature, which means that
the discriminant power of the features does not de-
pend on the system used. For features based on time,
i.e. TMT and TPWV, there is no system effect, which
means that their value does not depend on the sys-
tem used to acquire the data. There is a system effect
for MU, NJ and PWV, suggesting that the measured
value depends on the system used. Indeed, those fea-
tures are not extracted on the same signals, one being
extracted on the z dimension while the other is on the
norm. The values can thus not be similar, which leads
to a system effect; however, once again, this effect has
no impact on the discriminant faculty of the features.
7 CONCLUSIONS
Some evident limitations of visual marker-based sys-
tems are that they are expensive and not usable in
the daily clinical practice. However, their preci-
sion is valuable for the extraction of kinematic fea-
tures, that are essential to quantify stroke rehabilita-
tion processes. A low-cost accelerometer-based sys-
tem has been developed to address these drawbacks.
A Complementary Kalman Filter has been set up in
order to separate the recorded signals from the ac-
celerometers in dynamic accelerations due to move-
ments and gravity components. The dynamic acceler-
ations were placed into a global frame, instead of the
sensor frame, in order to draw a direct comparison
with the accelerations recorded by the Codamotion
system, used as ground truth. The 3-axis accelerations
and velocities have been compared between healthy
and hemiparetic subjects performing reach and grasp
movements, showing the best reconstruction in the z
axis, while the reconstructed norms were not precise
enough to be used for kinematic analyses. Feature
extraction was thus performed on the reconstructed
z axis for the accelerometer-based device and on the
norm for the Codamotion signals. Despite of that,
the accelerometer system allowed the computation of
features with a discriminant power comparable to the
ones derived from the Codamotion. Similar results
were obtained for the sensors and markers placed on
the index nail and on the thumb nail of the subjects.
This accelerometer-based device is a promising alter-
native to expensive visual marker-based systems for
rehabilitation processes, that could be used during re-
habilitation sessions or at home.
A larger set of patients should be formed, as well
as multiple recordings, in order to assess the evolu-
tion of the features all along the rehabilitation pro-
cess. Other features could also be extracted to allow a
deeper quantification of the movements. For example,
the Peak Wrist Acceleration (PWA) and the percent-
age time to reach this value (TPWA) could be used as
more sensitive features to evaluate force generation
and control strategy. Indeed, the accelerometer-based
system records accelerations, that are directly related
to force generation. Marker-based systems use veloc-
ities for the evaluation of force generation and control
strategy because this measure is more accurate as it is
the first derivative of the recorded position while the
acceleration is the second derivative.
ACKNOWLEDGEMENTS
The work of JS was supported by a FRIA grant.
The work of YV and the purchase of the Codamo-
tion system was supported by the following grants:
Fonds de la Recherche Scientifique M
´
edicale (FRSM)
3.4.525.08.F 2008 & 2010; Universit
´
e catholique de
Louvain (UCL) Fonds Sp
´
ecial de Recherche (FSR)
2008 & 2010. The work of SL was supported by UCL
FSR grants 2008 & 2010.
REFERENCES
Brown, H. and Prescott, R. (1999). Applied mixed mod-
els in medicine, statistics in practice. Chichester, NY:
John Wiley&Sons.
Caimmi, M., Carda, S., Giovanzana, C., Maini, E. S., Saba-
tini, A. M., Smania, N., and Molteni, F. (2008). Us-
ing kinematic analysis to evaluate Constraint-Induced
BIOSIGNALS 2012 - International Conference on Bio-inspired Systems and Signal Processing
204

Movement Therapy in chronic stroke patients. Neu-
rorehabilitation Neural Repair, 22:31–39.
Chang, J. J., Wu, T., Wu, W. L., and Su, F. C. (2005). Kine-
matical measure for spastic reaching in children with
cerebral palsy. Clinical Biomechanics, 20:381–388.
Cirstea, M. C. and Levin, M. F. (2007). Improvement of arm
movement patterns and endpoint control depends on
type of feedback during practice in Stroke survivors.
Neurorehabilitation Neural Repair, 21:398–411.
Higgins, W. T. (1975). A comparison of complementary and
Kalman filtering. IEEE Transactions on Aerospace
and Electronic Systems, 11(3):321–325.
Ihaka, R. and Gentleman, R. (1996). R: A language for data
analysis and graphics. Journal of computational and
graphical statistics, 5(3):299–314.
Kavanagh, J. J. and Menz, H. B. (2008). Accelerometry : A
technique for quantifying movement patterns during
walking. Gait & Posture, 28:1–15.
Lang, C. E., Wagner, J. M., Edwards, D. F., Sahrmann,
S. A., and Dromerick, A. W. (2006). Recovery of
Grasp versus Reach in people with hemiparesis post-
stroke. Neurorehabilitation Neural Repair, 20:444–
454.
Luinge, H. J. and Veltink, P. H. (2004). Inclination measure-
ment of human movement using a 3-D accelerometer
with autocalibration. IEEE Transactions on Neural
Systems ans Rehabilitation Engineering, 12(1):112–
121.
Michaelsen, S. M., Jacobs, S., Roby-Brami, A., and Levin,
M. F. (2004). Compensation for distal impairments
of grasping in adults with hemiparesis. Experimental
Brain Research, 157:162–173.
Pinheiro, J. and Bates, D. (2006). Linear and nonlinear
mixed effects models. R package version, pages 3–
10.
Trombly, C. A. (1993). Observations of improvement
of reaching in five subjects with left hemiparesis.
Journal of Neurology, Neurosurgery, and Psychiatry,
56:40–45.
Welch, G. and Bishop, G. (2001). An introduction to the
kalman filter. In Addison-Wesley, editor, SIGGRAPH
2001 course 8. In Computer Graphics. ACM Press.
Wu, C., Chen, C., Tang, S. F., Lin, K., and Huang, Y.
(2007). Kinematic and clinical analyses of upper-
extremity movements after Constraint-Induced Move-
ment Therapy in patients with stroke : A randomized
controlled trial. Archives of Physical Medicine and
Rehabilitation, 88:964–970.
Wu, C., Trombly, C. A., Lin, K., and Tickle-Degnen, L.
(2000). A kinematic study of contextual effects on
Reaching performances in persons with and without
Stroke : Influences of object availability. Archives of
Physical Medicine and Rehabilitation, 81:95–101.
Zhou, H. and Hu, H. (2008). Human motion tracking for re-
habilitation - A survey. Biomedical Signal Processing
and Control, 3:1–18.
Zhou, H., Stone, T., Hu, H., and Harris, N. (2008). Use
of multiple wearable inertial sensors in upper limb
motion tracking. Medical Engineering & Physics,
30:123–133.
KINEMATIC FEATURES OF REACH AND GRASP MOVEMENTS IN STROKE REHABILITATION USING
ACCELEROMETERS
205
