
FUZZY LOGIC APPROACH FOR ESTIMATING 85
TH
PERCENTILE SPEED BASED ON ROAD ATTRIBUTE DATA
Bayzid Khan
1
and Yaser E. Hawas
1,2
1
Roadway, Transportation and Traffic Safety Research Center,
United Arab Emirates University, Al Ain, United Arab Emirates
2
Department of Civil and Environmental Engineering, United Arab Emirates University, Al Ain, United Arab Emirates
Keywords: 85
th
Percentile Speed, Posted Speed Limit, Fuzzy Logic, Neuro-Fuzzy Training.
Abstract: This paper discusses the development of fuzzy logic model for estimating the 85
th
percentile speed of urban
roads. Spot speed survey was conducted on four randomly selected urban road segments for a typical
weekday and a weekend. The considered road segment attribute data are length of the road segment, number
of access points/intersecting links, number of pedestrian crossings, number of lanes, hourly traffic volume,
hourly pedestrian volume and current posted speed limits of the selected roads. Such attribute data were
collected and used as input variables in the model. Two models for weekday and weekend were developed
based on the field survey data. Both models were calibrated using the neuro-fuzzy technique for optimizing
the fuzzy logic model (FLM) parameters. Analyses of estimated results show that the FLM can estimate the
85
th
percentile speed to a reasonable level.
1 INTRODUCTION
Determining a safer posted speed limit for any given
roads/links is one of the major challenges for the
researchers and professionals all around the world.
Many studies tried to identify the safer speed limit
for a road (Manual on Uniform Traffic Control
Devices [MUTCD], 2003; Department for
Transportation [DfT], 2006; Global Road Safety
Partnership [GRSP], 2008). Setting a speed limit is a
multi-criteria task. Many road and roadside factors
such as the road alignment, section length, traffic
volume, pedestrian volume, current speed limit,
number of lanes, weather condition, time of the day,
law enforcement, purpose and length of the trip,
vehicles’ characteristics are to be incorporated.
(TRB, 1998; Srinivasan, Parker, Harkey, Tharpe and
Summer, 2006). Setting the speed limits also
requires understanding the drivers’ characteristics
and their driving pattern. As such, most of the
studies suggested the 85
th
percentile of the operating
speed to be set as the posted speed limit (Fitzpatrick,
Carlson, Wooldridge and Miaou, 2003).
Studies showed that the chances of involving in a
crash is least at 85
th
the percentile traffic speed
(Minnesota Department of Transportation
[MNDOT], 2002; American Association of State
Highway and Transportation Officials [AASHTO],
1985).
Developing a model to estimate the 85
th
percentile speed by incorporating all the factors is
quite challenging. The individual driver’s operating
speed depends on individual driver’s perception
about all of the above mentioned factors. For a given
road characteristics, every driver may choose
different operating speed. Therefore, it is very
important to develop a method to estimate the 85
th
percentile speed which will also address such
uncertain choice behaviour.
Many studies were conducted to determine the
factors that influence the choice of the operating
speed. Poe, Tarris and Mason (1996) showed that
access points, land-use characteristics and traffic
engineering features have influences on vehicle
speed on low speed urban streets. Haglund and
Aberg (2000) showed that the posted speed limit has
influence on drivers’ speed choice behaviour.
Fitzpatrick, Carlson, Brewer and Wooldridge (2001)
evaluated the influence of geometric, roadside and
traffic control devices on drivers’ speed on four-lane
suburban arterials and found that posted speed limit
was the most significant variable for both curve and
straight sections. Wang (2006) demonstrated that the
number of lanes, sidewalks, pedestrian movements,
46
Khan B. and E. Hawas Y..
FUZZY LOGIC APPROACH FOR ESTIMATING 85TH PERCENTILE SPEED BASED ON ROAD ATTRIBUTE DATA.
DOI: 10.5220/0003716300460054
In Proceedings of the 4th International Conference on Agents and Artificial Intelligence (ICAART-2012), pages 46-54
ISBN: 978-989-8425-95-9
Copyright
c
2012 SCITEPRESS (Science and Technology Publications, Lda.)

and access density have significant influences on the
drivers’ behaviour of choosing operating speed.
Fildes, Fletcher and Corrigan (1987) and Fildes,
Leening and Corrigan (1989) found that the road
width and the number of lanes have the greatest
influence on speed choice. Tignor and Warren
(1990) showed that the number of access points and
the nearby commercial development have the
greatest influences on the vehicle speeds. Most of
these studies used different model approaches range
from simple linear regression models to complex
curvilinear regression equations (Wang, 2006;
Tarris, Poe, Mason and Goulias, 1996; Poe and
Mason, 2000). Most of the existing models attempt
to quantify the operating speed based on physical
conditions such as road geometric design, roadside
development and traffic control devices. All of these
models used 85
th
percentile speed as a representative
measures for operating speed.
No studies on the use of FLM to estimate the
85
th
percentile speed have been found. The FLM
approach has the premise to tackle the imprecise,
vague and uncertain relationship between the inputs
and outputs. The proposed system can be regarded
as an expert system or a knowledge base. It is
critically important that the design of such system
should account for the imprecise, incomplete or not
totally reliable information (Zadeh, 1983). The key
feature of the FLM is the suitability to incorporate
intuition, heuristic and human reasoning (Hawas,
2004) and such technique is useful for problems that
entail probabilistic or stochastic uncertainty (human
behaviour modeling), or problems that cannot be
easily represented by mathematical modeling
because of the complexity of the process (Kikuchi
and Pursula, 1998). Fuzzy set theory provides a
strict mathematical framework in which vague
conceptual phenomena can be precisely and
rigorously studied (Zimmermann, 1996). The word
imprecise or vague does not mean the lack of
knowledge of data; rather it indicates the sense of
vagueness of the value of parameters.
The objective of this paper is to develop a fuzzy
logic based approach to estimate the 85
th
percentile
speed for different urban road segments based on
road segments attribute data for weekday and
weekend. In doing so, four urban road segments
(one local and three arterial roads) of Al Ain city of
United Arab Emirates have been selected randomly
(termed as ‘Site 1’ to ‘Site 4’). Only four road
segments were selected because of limited time and
resources for conducting the study. The authors do
recognize that the limited data collection cannot be
used to make general conclusions on the validity of
the devised FLM for a general network. We
emphasize here that the main contribution of this
study is the introduction of the concepts and the
procedure to develop the FLM that can be
generalized to any network given that adequate data
collection on a representative sample size is
fulfilled.
This paper is divided into five sections. The
second section provides a brief overview on data
collection methodology. In third section, the
structure of the proposed FLM is discussed in brief.
The inference engine and fuzzy operators, and
neuro-fuzzy training procedure are also discussed.
The fourth section discusses the FLM validation and
analysis of results. Concluding remarks on the use of
the FLM for estimating the 85
th
percentile speed to
set the speed limit are provided in the last section.
2 DATA COLLECTION
Spot speed survey were conducted on selected four
sites for five different time periods of the day, for a
typical weekday and weekend and for both
directions. The five time periods include both peak
(AM, MD, PM) and off-peak periods (15 minutes
within each time period). Only passenger vehicles
(excluding trucks and busses) were selected
randomly for the survey, keeping in mind that a
minimum of 50 vehicles should be observed for spot
speed study (Ewing, 1999) on each selected road
segments. The 85
th
percentile speed of the spot speed
data was calculated for 40 different cases (4
sites*2directions*5 time periods) for two days (one
typical weekday and one weekend).
The detailed road attribute data including the
length of the road segment, number of access
points/intersecting links, number of pedestrian
crossings, number of lanes, traffic count and
pedestrian count data (15 minutes count), and the
current posted speed limit for each road were
collected. The length of Site 1 is 2.78 km, has 8
access points and 3 pedestrian crossings on each
direction. The traffic volume is relatively high, but
number of pedestrian is low on both weekday and
weekend. Site 2 is 0.46 km long with 4 access points
and 3 pedestrian crossings on each direction. This
site has the highest pedestrian volume with the
lowest traffic volume among the four sites. The
length of Site 3 is 2.15 km. It has 11 and 8 access
points on direction 1 and direction 2, respectively.
The site has the highest traffic volume (among the
four sites) on both weekday and weekend.
Pedestrian volume is also high at this site. Site 4 is
FUZZY LOGIC APPROACH FOR ESTIMATING 85TH PERCENTILE SPEED BASED ON ROAD ATTRIBUTE
DATA
47

2.94 km long, 4 access points on both directions
with no pedestrian crossing. The traffic volume is
moderate with very little pedestrian activity. The
traffic and pedestrian count data were converted to
hourly volume data prior to developing the FLM. It
is to be noted that all road attribute data are fixed for
each road segments for different time periods and
for weekday and weekend except the traffic volume
and pedestrian data. The current posted speed limits
for site1, site 2, site 3 and site 4 are 40, 60, 80 and
80 km/hr, respectively.
3 DEVELOPMENT OF FLM FOR
85
TH
PERCENTILE SPEED
ESTIMATION
The development of the FLM starts with preparing
the data sets for both weekday and weekend. The
road attribute data collected from the fields were
used as the input variables. The estimated 85
th
percentile of the operating speed was used as the
output variable. The input and output variables and
their corresponding modified name used in the FLM
are shown in Table 1. Two separate models were
developed (for weekday and weekend). It is to be
noted that volume to capacity ratio was also
calculated from the hourly traffic volume to
incorporate in the FLM development.
Table 1: Input and output variables and their
corresponding modified name in fuzzy logic.
Variable
category
Variable name Denoted in
FLM
Input
variables
Length Length
Number of access
points/intersecting links
IntLnks
Number of pedestrian
crossings
PedCros
Volume to capacity (V/C)
ratio
VCRat
Hourly pedestrian volume PedVol
Posted speed limit PostSp
Output
variable
85
t
h
percentile speed SpEF
The FLM development was done in two stages
using the tool FuzzyTech (INFORM, 2001)- first,
initial models were developed for both weekday and
weekend by setting the memberships (fuzzy sets’
parameters) and the knowledge base (rules)
intuitively (using some correlation analysis).
Secondly, to overcome the limitations of intuitive
setting of knowledge base, the neuro-fuzzy logic
(integrated fuzzy and neural nets) (Hawas, 2004)
was used.
3.1 Development of Initial Fuzzy Logic
Model
The development of initial models involves three
major steps- fuzzification (converting numeric
variables into linguistic terms), fuzzy inference
(knowledge base- ‘IF-THEN’ logics) and de-
fuzzification (converting linguistic terms into
numeric output values) (Figure 1).
Figure 1: Conceptual block diagram of the proposed FLM.
3.1.1 Fuzzification
The input and output variables are numeric in nature.
The drivers mostly perceive these as linguistic
terms. For example, the traffic volume may be
perceived as high or medium or low rather than its
actual numeric values. As such, the numeric values
of each input variables were converted into three
linguistic terms and the values of the output variable
has been converted into five linguistic terms (Table
2). The minimum and maximum values of each
variable were determined from the survey results. It
is to be noted that the variability of data for the
output variable is high and grouping these data into
more linguistic terms might result in more accurate
estimation of the output variable. On the other hand,
three terms have been selected for the input
variables due to low variability of the data. It will
also reduce the number of rule bases and neuro-
fuzzy training time.
The ‘L-shape’ membership function (MBF) was
used for all variables. The MBFs were generated
using the “Compute MBF” fuzzification method.
Figure 2 shows the MBF for the Hourly Pedestrian
Volume input variable for weekday. For this
particular variable, the ranges of linguistic terms
were set as (0, 92), (42.465, 138) and (92, 184) for
the low, medium and high terms, respectively. The
possibility that a numeric level belongs to a
linguistic term’s range is denoted by the membership
degree, µ (Y axis in Figure 2). A µ of 0.0 indicates
zero possibility, while µ of 1.0 indicates full
membership.
ICAART 2012 - International Conference on Agents and Artificial Intelligence
48

Table 2: The proposed FLM variables term definitions.
Variable
name
Day of the
Week
Min Max
Linguistic
terms
Length
Weekday,
Weekend
0.46 2.94
Low,
medium,
high
IntLnks
Weekday,
Weekend
4 11
Low,
medium,
high
PedCros
Weekday,
Weekend
0 3
Low,
medium,
high
VCRat
Weekday 0.08 1.03
Low,
medium,
high
Weekend 0.07 1.13
PedVol
Weekday 0 184 Low,
medium,
high
Weekend 0 156
PostSp
Weekday,
Weekend
40 80
Low,
medium,
high
SpEF
Weekday 13.9 109.9
Very low,
low,
medium,
high, very
high
Weekend 22.36 124.89
Figure 2: Membership function for ‘hourly pedestrian
volume’ input variable.
3.1.2 Fuzzy Inference (knowledge base- ‘IF-
THEN’ logics)
The rules (IF-THEN logics) were generated to
describe the logical relationship between the input
variables (IF part) and the output variable (THEN
part). The degree of support (DoS) was used to
weigh each rule according to its importance. A
‘DoS’ value of ‘0’ means non-valid rules. Initially,
all the DoS’s were set to a fixed value of ‘1’. The IF-
THEN rules were formed exhaustively based on the
correlation of the input and output variables
considering all possible combinations of input and
output terms. The neuro-fuzzy training capability
was activated in later stage to eliminate non-valid
rules (the ones with DoS approaching zero value).
Two correlation matrices were developed for
both weekday and weekend to define the
relationship between the input and output variables
(Table 3) in the fuzzy inference system..
Table 3: Correlation values between input and output
variables for both weekday and weekend.
85
th
percentile speed
Weekday Weekend
Length 0.87 0.82
Number of access
points/intersecting
links
0.15 0.11
Number of
pedestrian crossings
-0.64 -0.35
Volume to capacity
(V/C) ratio
0.27 0.08
Hourly pedestrian
volume
-0.84 -0.57
Posted speed limit 0.77 0.53
It is to be noted that some of the correlation
values is showing unexpected signs (e.g. V/C ratio
to 85
th
percentile speed shows positive relation).
This is because of Site 2 (a local road), which has
very low 85
th
percentile speed (low posted speed
limit of 40 km/hr) and very low traffic volume.
Including the data of this particular road segment in
calculating the correlation values affects the overall
results, particularly because of the limited data (only
four segments). Site 2 data were kept for calculating
the correlation values to have representation of both
road categories in the devised FLM, keeping in mind
that increasing the sample road segments may result
in better correlation values.
The used operator type for generating the fuzzy
rules has been the ‘MIN-MAX’. The ‘MIN-MAX’
method tests the magnitude of each rule and selects
the highest one.
The fuzzy composition eventually combines the
different rules to one conclusion. The ‘BSUM’
(Bounded Sum) method was used as it evaluates all
rules. A total of 729 rules were generated for both
weekday and weekend models. Table 4 shows six
rules as an example with the final adjusted DoS’s
after the neuro-fuzzy training. Detail of the neuro-
fuzzy training will be discussed later.
The bold row indicates that for a road segment
with low length, low number of intersecting links,
low number of pedestrian crossings, medium hourly
traffic volume, medium hourly pedestrian volume
and low posted speed limit, the estimated 85
th
percentile speed is medium and the strength for this
rule (DoS) is 0.90.
FUZZY LOGIC APPROACH FOR ESTIMATING 85TH PERCENTILE SPEED BASED ON ROAD ATTRIBUTE
DATA
49

Table 4: Examples of (IF-THEN) rules.
IF THEN
Length
IntLnks
PedCros
VCRat
PedVol
PostSp
DoS
SpEF
low low low low low low 0.90 med.
low low low low med. low 1.00 med.
low low low low high low 1.00 med.
low low low med. low low 1.00 low
low low low med. med. low 0.90 med.
low low low med. high low 0.90 med.
3.1.3 Defuzzification
The results of the inference process are the linguistic
terms describing the 85
th
percentile speed. As
mentioned above, five linguistic terms were used for
the output results- very low through very high 85
th
percentile speed). In the defuzzification process, all
output linguistic terms are transformed into crisp
numeric values. This is done by aggregating
(combining) the results of the inference process and
then by computing the fuzzy centroid of the
combined area. The ‘Center-of-Maximum (CoM)
method (Ross, 1995) is used for estimating the
output numeric value, Y, as follows:
⎥
⎦
⎤
⎢
⎣
⎡
⎟
⎟
⎠
⎞
⎜
⎜
⎝
⎛
=
∑
∑
j
sult
j
j
sult
j
Yj
Y
)(
*)(
Re
Re
μ
μ
(1)
Where Y= numeric value representing the 85
th
percentile speed; µ
Result
(j) = membership value of
consequence (linguistic terms) j. Y
j
is referred to as
the base value of the consequence j. It is the
consequence’s numeric value corresponding to a µ
value of 1.
Figure 3 illustrates MBF for the output variable
(85
th
percentile speed) for weekday using the CoM
de-fuzzification procedure. The thick arrows
indicate the 85
th
percentile speed base values, Yj on
the horizontal axis and the height of the thick black
arrows indicate µ
Result
(j). The base values of the five
85
th
percentile terms are 29.9, 45.9, 61.9, 77.9 and
93.9 respectively. µ
Result
(medium), µ
Result
(high) are 1
and 0.95, respectively. The µ
Result
values of all other
terms are zeros. The 85
th
percentile speed of 69.68
km/hr (indicated by the thin black arrow) was
calculated using the Eq. (1).
Figure 3: Membership function for the ‘85
th
percentile
speed’ output variable.
3.2 Neuro-fuzzy Data Training
The initial fuzzy logic models for both weekday and
weekend were trained in neuro-fuzzy technique.
Neuro-fuzzy technique is the combination of neural
nets and fuzzy logic. It is comprised of the three
fuzzy logic steps (fuzzification, fuzzy inference and
de-fuzzification) with a layer of hidden neurons in
each process (Hawas, 2004). Fuzzy Associative
Maps (FAMs) approach is commonly used in neuro-
fuzzy technique to train the data. A FAM is a fuzzy
logic rule with an associated weight. This enables
the use of a modified error back propagation
algorithm with fuzzy logic. The neuro-fuzzy training
have been conducted in three steps- defining the
MBFs, rules and DoS for training, selection of
training parameters, and carrying out training
(INFORM, 2001).
Initially the default setting of the FuzzyTech tool
was used to define range of the numeric values for
each term. The rules were formed exhaustively with
all DoS values of 1. Therefore in the first step, all
MBFs and rules were selected for the neuro-fuzzy
training to find the optimized fuzzy logic model.
Then the parameters (step width for DoS and terms)
were selected for the training. The whole neuro-
fuzzy training was carried out for five cycles with
each cycle for 1000 iterations.
The step width for the DoS values has been set
to 0.1 for each cycle. The step width for the terms
has been set to 5% in the first cycle, which was
increased by 5% in later cycles. The maximum and
average deviations were observed after completion
of each cycle. The cycle, for which the deviation
values are less, was selected as the final FLM. The
process was run for both weekday and weekend
models. After the training phase, the MBFs and the
DoS values were determined as shown in Table 4
and Figure 4. It can be seen from the Figure 4 that
the initial 85
th
percentile speed terms were set
uniformly over the variable’s range [Figure 4(a)].
The base value for high 85
th
percentile speed is 77.9
km/hr (indicated by black arrow). The training
algorithm examines the effect of introducing a pre-
specified shift to the term’s base value (+5% in this
ICAART 2012 - International Conference on Agents and Artificial Intelligence
50

case). If the base shift results in a reduction in the
deviation, a new base is identified [71.5 in this case
as shown with black arrow in Figure 4(b) for
weekday model].
Figure 4: Membership function of ‘85
th
percentile speed’
(a) before and (b) after neuro-fuzzy training.
4 MODEL VALIDATION AND
RESULT ANALYSIS
After completing the training phase, the 85
th
percentile speeds were estimated (for both weekday
and weekend) with the same set of input data which
were used to develop the models. As the notion of
fuzzy sets are completely non statistical in nature
(Zadeh, 1965), the residual values (Figure 5) were
used to compare both weekday and weekend model
results. The x axis of the figure represents a specific
road segment and a time period. It can be seen from
the figure that the number of positive and negative
deviations are almost same for both weekday and
weekend models. The maximum deviations for
weekday and weekend are 57.63% and 81.44%,
respectively. This results in higher average deviation
for weekend (19.65% for weekend compared to
14.90% for weekday).
Figure 5 also shows that the number of residuals
with values of 15% or less represent 62.5% and 75%
of all the residuals for weekday and weekend,
respectively. It can be said that both models estimate
the 85
th
percentile speed to a reasonable level for
such limited number of sample size.
The estimated values of the 85
th
percentile speed
were classified according to their corresponding
current posted speed limits. A comparative
descriptive analysis of the estimated (model results)
and actual (field data) values of the grouped data for
both weekday and weekend models are presented in
Table 5.
It is evident in Table 5 that the mean, median,
minimum, maximum and standard deviations of the
estimated model results are very close to those of the
actual data in case of lower posted speed limit (40
km/hr) for both weekday and weekend models. On
the other hand, some variations on these values can
be observed in both models’ results for road
segments with higher posted speed limits (60 km/hr
and 80 km/hr).
Figures 6 through 8 illustrate the combined
effects of two input variables on the 85
th
percentile
speed data.
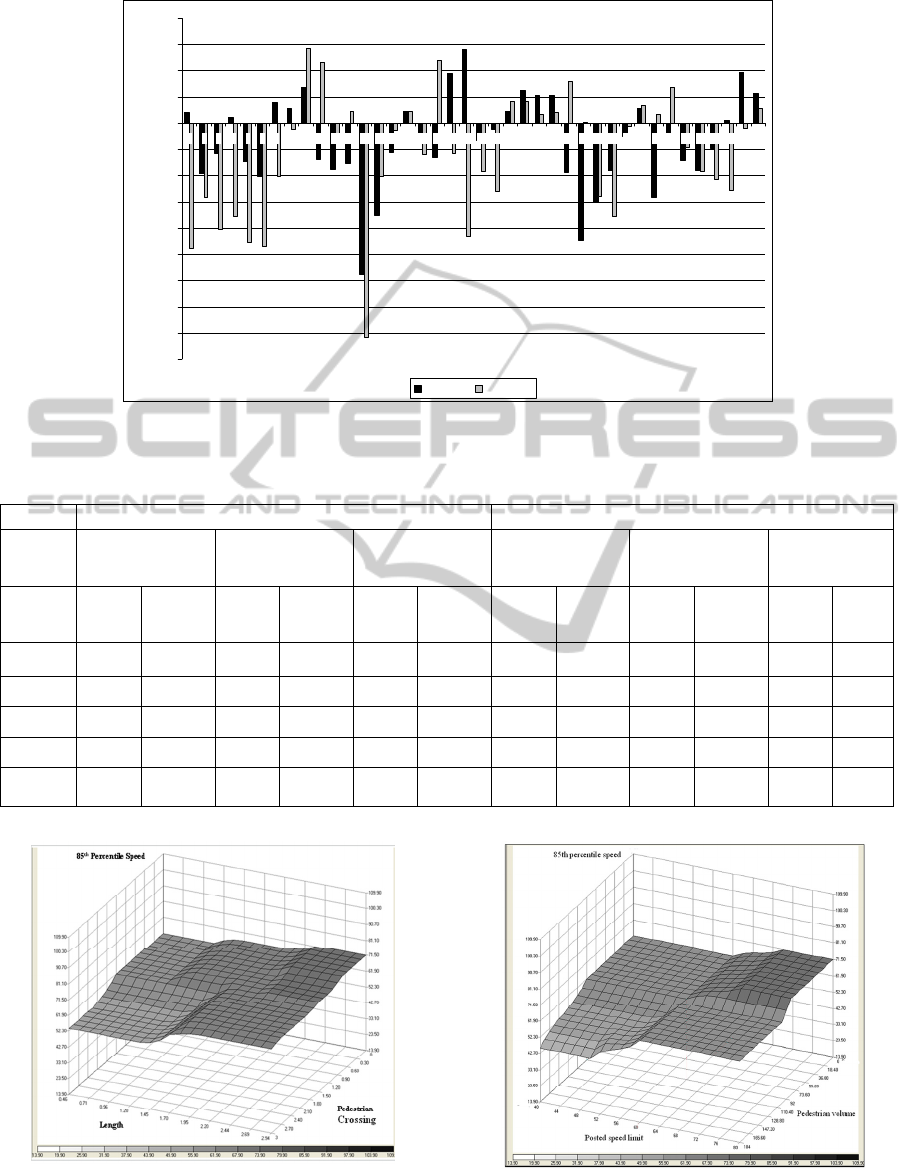
Figure 6 shows the effects of ‘number of
pedestrian crossings’ and ‘length’ on the 85
th
percentile speed for weekday model. As indicated in
the figure, the ‘length’ variable is positively
correlated with the 85
th
percentile speed. On the
other hand, the ‘number of pedestrian crossings’ is
negatively correlated with the 85
th
percentile speed.
The highest 85
th
percentile speed (71.50 km/hr) is
found for highest ‘length’ (2.9 km) and least
‘number of pedestrian crossings’ (0-1).
Similarly, Figure 7 illustrates the effects of the
‘Posted Speed Limit’ and the ‘Hourly Pedestrian
Volume’ (as input variables) on the ‘85
th
Percentile
Speed’ for weekday. As shown, the posted speed
limit is positively correlated and hourly pedestrian
volume is negatively correlated with the 85
th
percentile speed. As can also be seen, the effect of
the posted speed is not quite noticeable if it exceeds
60 km/hr in cases of high pedestrian volumes.
As shown, the posted speed limit is positively
correlated and hourly pedestrian volume is
negatively correlated with the 85
th
percentile speed.
As can also be seen, the effect of the posted speed is
not quite noticeable if it exceeds 60 km/hr in cases
of high pedestrian volumes.
FUZZY LOGIC APPROACH FOR ESTIMATING 85TH PERCENTILE SPEED BASED ON ROAD ATTRIBUTE
DATA
51
-90
-80
-70
-60
-50
-40
-30
-20
-10
0
10
20
30
40
1 2 3 4 5 6 7 8 9 10 11 12 13 14 15 16 17 18 19 20 21 22 23 24 25 26 27 28 29 30 31 32 33 34 35 36 37 38 39 40
Percentage of deviation
Weekday Weekend
Figure 5: Percentages of deviations for both weekday and weekend FLMs.
Table 5: Comparison of descriptive statistics between the actual field data and the estimated FLM results for both weekday
and weekend.
Weekday Weekend
40 km/hr 60 km/hr 80 km/hr 40 km/hr 60 km/hr 80 km/hr
S.
Data*
E.
Data**
S.
Data*
E.
Data**
S.
Data*
E.
Data**
S.
Data*
E.
Data**
S.
Data*
E.
Data**
S.
Data*
E.
Data*
*
Mean 38.2 38.94 67.82 69.77 68.7 75.89 44.79 50.55 84.71 80.89 70.1 83.74
Median 36.55 38.94 66 69.97 73 73.99 45.1 51.16 87.1 80.41 71.5 84.18
Min 29.9 29.9 55 68.78 48 71.5 39.45 40.48 52.2 79.69 47 81.61
Max 50 45.9 82 70.66 93.9 81.14 51.5 56.54 107.8 84.18 93 84.18
S.D.
***
6.37 6.07 9.6 0.93 11.36 4.12 4.49 6.32 18.66 1.48 13.61 0.91
*S. Data= Survey Data ;**E. Data= Estimated Data;***S.D.= Standard Deviation
Figure 6: Effects of ‘Length and Number of Pedestrian
Crossings’ on the ‘85
th
Percentile Speed’ (weekday
model).
Figure 7: Effects of ‘Posted Speed Limit and Hourly
Pedestrian Volume’ on the ‘85
th
Percentile Speed’
(weekday model).
ICAART 2012 - International Conference on Agents and Artificial Intelligence
52

Figure 8 illustrates the relationship between the
‘Length’ and ‘Posted Speed Limit’ (as input
variables), and the ‘85
th
Percentile Speed’ for
weekday. The two input variables are positively
correlated with the 85
th
percentile speed. The higher
the length and/or the posted speed limit, the higher is
the 85
th
percentile speed.
Figure 8: Effects of ‘Length’ and ‘Posted Speed Limit’ on
the ‘85
th
Percentile Speed’ (weekday model).
It can be said that regardless limited number of
data, fuzzy logic shows the relationship between the
input and output variables realistically. As fuzzy
logic handles linguistic terms (for a range of
numeric values), it is less sensitive to each
individual numeric value. This replicates true human
nature about perceiving factors on the roads. For
example, it is clear from Figure 6 that drivers’
choice of operating speed (represented by 85
th
percentile speed) is influenced by the length of the
road segment or pedestrian volume. With larger
length, the operating speed tends to be higher. such
changes do not occur for every one km change of
length. In reality, the decision of choosing any
particular range of operating speed tend to be stable
for range of length (say between 0 to 1 km). Fuzzy
logic predicts such relationship very realistically.
5 CONCLUSIONS
This paper discussed the development of the FLM
for estimating the 85
th
percentile speed based on six
road attributes data. The advantage of fuzzy logic is
its ability to address the uncertain nature of human
thinking (perception). The same road (road attribute
data) can be perceived differently by different
drivers and choose their operating speed
accordingly. The other advantage is the using the
neuro-fuzzy which can be utilized to automate the
development of the knowledge base.
The FLMs are widely known for describing the
vagueness and nonlinearity in the human behaviour
relationships between inputs and output. However,
such models are generally only valid in situations for
which data are available to calibrate the model. If
the FLM is to be used to assess the choice behaviour
that is not covered in the data for calibration, the
applicability of the model for estimating the 85
th
percentile speed might be questionable. As such, the
data for calibration should thoroughly cover the
entire range of (input and output) variables for better
and more accurate estimation.
Identifying and setting appropriate posted speed
limit for a given road segment is a complex task
which involves studying the speed behaviour pattern
of the drivers, the characteristics of road
environment, road geometry, etc. This study focused
on only one aspect; the drivers’ speeding behaviour
based on the basic road characteristics, the traffic
intensity and pedestrian activities for a very limited
number of road segments.
One may argue the necessity to develop such
models while such 85
th
percentile speed can be
actually measured in the field. In response to such
argument is that tremendous savings in the resources
(that would be needed to carry on actual field survey
measures over an entire network) can be
materialized. It is envisioned that these models can
be developed with a reasonable representative
sample of road segments in a typical network. The
derived models can then be validated and
subsequently applied to the entire network.
Keeping in mind the limited data set used in the
study (due to the resources constraints), that likely
contributes to deficiencies in representing the
various road characteristics and environmental
factors (with only few data points); it is legitimate to
assume that the richness in data collection will
ultimately lead to better more statistically significant
models. Along this line, it is suggested that a
systematic sampling approach should be adopted in
selecting the road segments to include in the data set
to use for models’ calibration. The principles of the
minimum sample size should be observed. It is
suggested that a stratified sampling procedure to be
used in selecting the road segments for spot speed
field observations. All the network roadway
segments may be stratified based on their intrinsic
characteristics of posted speed, length, traffic
volume, pedestrian intensity, etc. A representative
stratified sampling procedure with a minimum
FUZZY LOGIC APPROACH FOR ESTIMATING 85TH PERCENTILE SPEED BASED ON ROAD ATTRIBUTE
DATA
53

sample size according to a pre-specified confidence
level and interval should be observed in generalizing
the fuzzy logic modeling approach.
ACKNOWLEDGEMENTS
This research is part of M.Sc. thesis entitled
‘Assessing the Methodology of Setting Posted Speed
Limit in Al Ain-UAE’ funded by Roadway,
Transportation and Traffic Safety Research Center,
United Arab Emirates University.
REFERENCES
American Association of State Highway and
Transportation Officials (AASHTO), 1985. Synthesis
of Speed Zoning Practice. Technical Summary, Report
No. FHWA/ RD-85/096, Subcommittee on Traffic
Engineering, Federal Highway Administration, US
Department of Transportation.
Department for Transportation (DfT), 2006. Setting Local
Speed Limits. Retrieved from: http://www.dft.gov.uk/
pgr/roadsafety/speedmanagement/dftcircular106/dftcir
cular106.pdf.
Ewing, R., 1999. Traffic Calming Impacts. In ITE
(Institute of Transportation Engineers) Traffic
Calming: State and Practice. Washington, D.C.,
pp.99–126.
Fildes, B. N., Fletcher, M. R. and Corrigan, J. McM.
(1987). Speed Perception 1: Driver’s Judgments of
Safety and Travel Speed on Urban and Rural Straight
Roads. Report CR54, Federal office of road safety,
Department of transport and communications,
Canberra.
Fildes, B. N., Leening, A.C. and Corrigan, J. McM.
(1989). Speed Perception 2: Driver’s Judgments of
Safety and Travel Speed on Rural Curved Roads and
at Night. Report CR60, Federal office of road safety,
Department of transport and communications,
Canberra.
Fitzpatrick, K., Carlson, P., Wooldridge, M. D. and
Miaou, S., 2003. Design Speed, Operating Speed, and
Posted Speed Practices. NCHRP Report 504,
Transportation Research Board, National Research
Council, Washington D.C.
Fitzpatrick, K., Carlson, P., Brewer, M. and Wooldridge,
M., 2001. Design Factors That Affect Driver Speed on
Suburban Streets. Transportation Research Record,
1751, 18-25.
GRSP (Global Road Safety Partnership), 2008. Speed
Management: A Road Safety Manual For Decision
Makers and Practitioners. World Health Organization,
World Bank.
Haglund, M. and Aberg, L., 2000. Speed Choice in
Relation to Speed Limit and Influences from Other
Drivers. Transportation Research Part F: Traffic
Psychology and Behavior, 3, 39-51.
Hawas, Y. E. 2004. Development and Calibration of Route
Choice Utility Models: Neuro-Fuzzy Approach.
Journal of Transportation Engineering, 130 (2).
INFORM (2001). FuzzyTech 5.5: User’s Manual.
GmbH/Inform Software Corporation, Germany.
Kikuchi, S. and Pursula, M. (1998). Treatment of
Uncertainty in Study of Transportation: Fuzzy Set
Theory and Evidence Theory. Journal of
transportation Engineering, 124 (1), 1-8.
Minnesota Department of Transportation (MNDOT),
2002. Speed Limit? Here is your answer. Office of
Traffic Engineering and Intelligent Transportation
System, Minnesota Department of Transportation.
Retrieved from: http://www.dot.state.mn.us/speed/
SpeedFlyer2002.pdf.
Manual on Uniform Traffic Control Devices (MUTCD),
2003. The Manual on Uniform Traffic Control Devices
2003 Edition. approved by Federal Highway
Administrator.
Poe, C. M., Tarris, J. P. and Mason, J. M., 1996. Influence
of Access and Land Use on Vehicle Operating Speeds
Along Low-Speed Urban Streets, In
The 2nd National
Access Management Conference, Vail, Colorado.
Poe, C. M. and Mason, J. M., 2000. Analyzing Influence
of Geometric Design on Operating Speeds along Low-
Speed Urban Streets: Mixed-Model Approach.
Transportation Research Record, 1737, 18-25.
Ross, T. J., 1995. Fuzzy logic with engineering
applications. New York: McGraw-Hill.
Srinivasan, R., Parker, M., Harkey, D., Tharpe, D. and
Summer, R., 2006. Expert System for Recommending
Speed Limits in Speed Zones. Final Report, Project
No. 3-67, NCHRP, National Research Council.
Tarris, J. P., Poe, C.M., Mason, J. M., and Goulias, K. G.,
1996. Predicting Operating Speeds on Low-Speed
Urban Streets: Regression and Panel Analysis
Approaches. Transportation Research Record, 1523,
46–54.
Tignor, S. C. and Warren, D. (1990) Driver Speed
Behavior on U.S. Streets and Highways. Compendium
of Technical Papers, Institute of Transportation
Engineers, Washington, D. C.
Transportation Research Board (TRB), 1998. Managing
Speed: Review of Current Practice for Setting and
Enforcing Speed Limit. Special Report No. 254,
National Research Council, Washington, D.C.
Wang, J., 2006. Operating Speed Models for Low Speed
Urban Environments Based on In-Vehicle Data. Ph. D.
Georgia Institute of Technology.
Zadeh, L., 1965. Fuzzy Sets. Information and Control, 8,
338-353
Zadeh, L. A., 1983. The role of fuzzy logic in the
management of uncertainty in expert systems. Fuzzy
Sets and Systems, 11(1-3), 197-198.
Zimmermann, H. J., 1996. Fuzzy Set Theory and Its
Applications. USA: Kluwer Academic.
ICAART 2012 - International Conference on Agents and Artificial Intelligence
54
