
NANOSTRUCTURED VS. CARBONACEOUS BIOSENSORS
Comparative Studies for Detection of Phenolic Compounds
Constantin Apetrei
1
, Jose Antonio de Saja
2
and Maria Luz Rodriguez-Mendez
3
1
Department of Chemistry, Physics and Environment, Faculty of Sciences and Environment,
“Dunărea de Jos” University of Galaţi, Galaţi, Romania
2
Dptm. Física de la Materia Condensada, Facultad de Ciencias, University of Valladolid, Valladolid, Spain
3
Dptm. Química Física y Química Inorgánica, E. T. S. Ingenieros Industriales, University of Valladolid, Valladolid, Spain
Keywords: Biosensor, Langmuir-Blodgett, Carbon paste electrode, Bisphthalocyanine, Tyrosinase.
Abstract: The biosensing properties of tyrosinase biosensors were investigated for two different immobilization
matrixes: carbon paste and Langmuir-Blodgett thin film. In both cases the electron mediator was the
lutetium (III) bisphthalocyaninate. The electrochemical responses of biosensors towards phenol and
catechol were analyzed and compared. The tyrosinase maintains its bioactivity well within the
immobilization matrices. A clearly defined reduction current proportional to the phenolic compounds
concentration was observed in cyclic voltammetry, which attributed to the reduction of enzymatically
produced quinone at the electrode surface. It was demonstrated that the biosensor based on Langmuir-
Blodgett thin film shows the best performances in terms of kinetics and detection limit for the phenolic
compounds analyzed.
1 INTRODUCTION
A considerable number of phenolic compounds,
extensively distributed throughout the environment,
are important pollutants in medical, food and
environmental matrixes. They are used in numerous
industrial processes such as fabrication of paper,
polymers, drugs, dyes, and pesticides (Hill, 2004).
They are ones of the most important contaminants in
soil and surface water (Manahan, 1991). Almost all
of them are easily absorbed and have been shown to
have negative effects on animal health (Bukowska
and Kowalska, 2004). Taking into consideration
their high toxicity and persistence in the
environment, the determination of phenolic
compounds becomes an important theme. For
quantification of phenolics, several methods were
developed such as colorimetry, gas chromatography,
liquid chromatography, and capillary
electrophoresis, fluorescence, and electrochemical
methods (Moldoveanu and Kiser, 2007; Ma et al,
2005; Kovács et al, 2011). However, these analysis
methods are relatively time-consuming, difficult to
perform requiring complex samples pre-treatment,
and may not be suitable for in situ monitoring. These
inconveniences diminish its practical applications.
Electrochemical sensors and biosensors can be a
possible alternative to these techniques.
Electrochemical analytic technique based on
biosensors is an attractive method due to simplicity,
low expense, high sensitivity and possibility of
miniaturization. Enzymes are complex proteins that
produce a specific chemical reaction in other
substances without themselves being modified
carrying out as biocatalysts by lowering the
activation energy (Palmer, 1991). For the detection
of phenolic compounds, biosensors based on
tyrosinase have been developed (Carralero et al,
2006; Cosnier et al, 2001; Tsai and Chiu, 2007).
Tyrosinase catalyzes the transformation of
monophenols to diphenols and also the reaction of o-
diphenols to o-quinones (Kazandjian and Klibanov,
1985). Several methods have been used for the
immobilization of tyrosinase onto various substrates
including carbon paste immobilization (Kumar
Vashist et al, 2011; Granero et al, 2010), sol–gel
immobilization (Zejli et al, 2008), physical
adsorption (Shiddiky and Torriero, 2011),
Langmuir–Blodgett thin films (Cabaj, 2010; Apetrei,
2011; Pavinatto, 2011), electrochemical entrapment
of enzyme within conducting polymer or composite
matrix (Ameer and Adeloju, 2009). Langmuir–
104
Apetrei C., de Saja J. and Rodriguez-Mendez M..
NANOSTRUCTURED VS. CARBONACEOUS BIOSENSORS - Comparative Studies for Detection of Phenolic Compounds.
DOI: 10.5220/0003716701040109
In Proceedings of the International Conference on Biomedical Electronics and Devices (BIODEVICES-2012), pages 104-109
ISBN: 978-989-8425-91-1
Copyright
c
2012 SCITEPRESS (Science and Technology Publications, Lda.)

Blodgett (LB) technique offers a possibility of
developing an ultra-thin film with well-organized
structure on molecular scale (Roberts, 1990). On the
other hand, this technique is considered as a suitable
immobilization method for biosensor because this
can produce well-ordered thin films and can control
the quantity of biocomponents by the number of
deposited layers.
The immobilization of the enzyme tyrosinase
into carbon paste electrodes has resulted in a number
of biosensor configurations that have been shown to
be relatively sensitive, specific, and durable in the
detection and measurement of phenols (Granero et
al, 2010). Various aspects concerning their
construction and operation have been studied and
optimized including the use of different binders
(Rogers et al, 2001) and the use of redox mediators
(Yin, 2010).
In this paper, carbon paste biosensors and LB
biosensors based on tyrosinase and lutetium (III)
bisphthalocyaninate (as electron mediator) have
been prepared and their capability to detect phenolic
compounds has been compared. For this purpose,
phenol and catechol have been analyzed in aqueous
solutions. The response dependences and
amperometric characteristics including sensitivity,
kinetics, linear range and limits of detection of the
prepared enzyme electrode in the detection of
phenolic compounds have been investigated.
2 EXPERIMENTAL
2.1 Chemicals and Solutions
Carbon paste was made with graphite powder (High
purity Ultracarbon®, Ultra F purity) mixed with
high purity mineral oil (Nujol, Fluka). The sources
of materials and reagents used were as follows:
arachidic acid, phenol, catechol from Sigma;
tyrosinase (EC 1.14.18.1, from mushroom) was
purchased from Sigma. A 67μg·μL
−1
solution of
tyrosinase in buffer phosphate 0.01 M (pH=7) was
used for the enzyme immobilization.
The buffer was prepared from potassium
monobasic and dibasic phosphate salts (pH 7) from
Aldrich. All the aqueous solutions were prepared
using 18 MΩ·cm MilliQ water (Millipore).
The lutetium (III) bisphthalocyaninate (LuPc
2
was synthesized and purified in their neutral radical
state following previously published procedures.
2.2 Biosensor Construction
2.2.1 Carbon Paste based Biosensor
Carbon paste electrodes were prepared as previously
reported by mixing graphite powder and the
bisphthalocyanine (15%, w/w). Nujol was used as
the binder of the composite mixture. Carbon pastes
were packed into the body of a 1mL plastic syringe
and compressed. A metallic copper wire was used as
a contact.
The enzyme, tyrosinase (Tyr), was immobilized
on the above carbon paste electrodes by a casting
technique followed by cross-linking. 5μL of 0.01 M
phosphate buffer (pH 7.0) containing 67μg·μL
−1
of
enzyme, was added onto carbon paste electrode
surface. After drying, the biosensor was exposed to a
2.5% (v/v) glutaraldehyde solution (in phosphate
buffer 0.01M of pH 7) for 20 minutes at room
temperature. The enzyme-immobilized electrode
was dried at 10ºC and rinsed with phosphate buffer
solution thrice to remove any unbound enzyme from
the biosensor surface and was further dried at 10ºC
and stored at 4ºC.
2.2.2 Langmuir-Blodgett based Biosensor
LB films were prepared in a KSV 5000 System 3
Langmuir–Blodgett trough equipped with a
Wilhelmy plate to measure the surface pressure.
Films containing tyrosinase, LuPc
2
and arachidic
acid (Tyr/LuPc
2
-AA) were prepared by spreading a
chloroform solution (10
−5
M) of arachidic acid and
LuPc
2
onto a water subphase (NaCl 0.1M, phosphate
buffer 0.01M of pH 7 in ultrapure water – Millipore
MilliQ; 20ºC). After the evaporation of the solvent,
10μL of a 67μg·μL
−1
solution of tyrosinase in
0.01M phosphate buffer (pH 7) was injected drop by
drop underneath the air/water interface.
Molecules were compressed using a symmetrical
two barrier compression system. At a surface
pressure of 30mN·m
−1
, 20 monolayers were
deposited onto the ITO (indium tin oxide) surface.
The substrate speed used was 2mm·min
−1
. LB films
were prepared by Y-type deposition with a transfer
ratio close to 1. The biosensor was washed using
phosphate buffer, dried at 10ºC and stored at 4ºC.
2.3 Apparatus
Electrochemical experiments and analytical testing
were carried out in a 100 mL electrochemical cell
using a platinum electrode as the counter electrode
and a biosensor as the working electrode. The
NANOSTRUCTURED VS. CARBONACEOUS BIOSENSORS - Comparative Studies for Detection of Phenolic
Compounds
105
potentials were measured and referred to a
Ag/AgCl/KCl 3M electrode. Electrochemical
measurements were carried out with an EG&G
PARC Model 263 potentiostat/galvanostat
(Princeton Applied Research Corp.).
The electrochemical experiments were carried
out in 0.01 M phosphate buffer solution (PBS) of
pH=7 as supporting electrolyte.
3 RESULTS AND DISCUSSIONS
The suitable immobilization of the enzyme in solid
substrates is crucial for the development of the
biosensors. The structure of the matrix used for
immobilize Tyr should contribute to the preservation
of enzyme functionality.
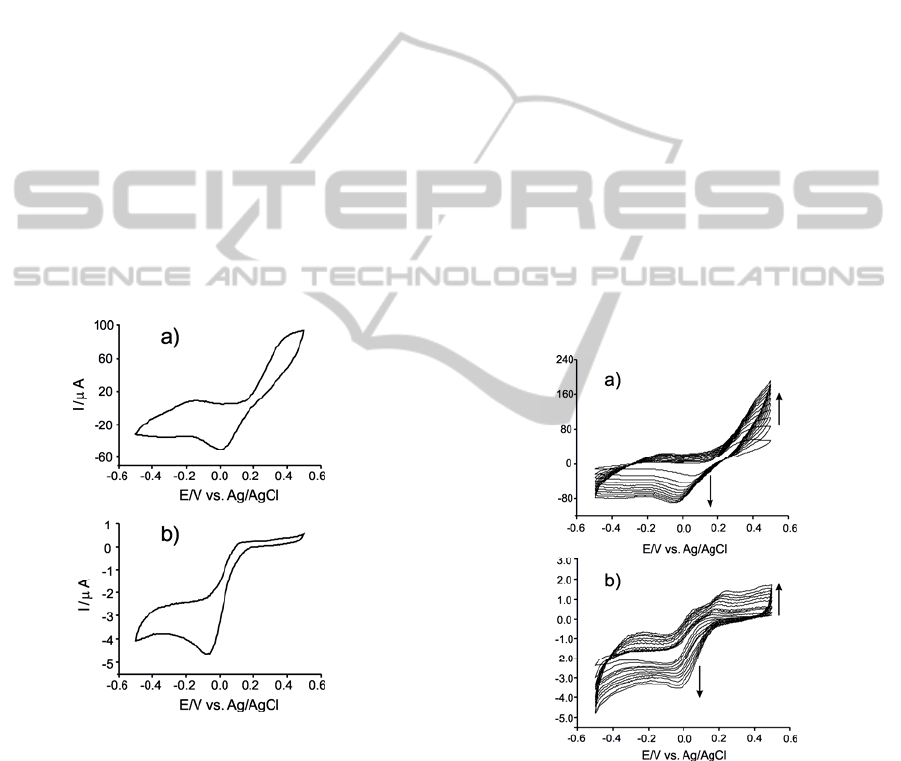
3.1 Cyclic Voltammetry Studies
The response towards phenolic compounds of the
biosensors was registered in the range from -0.5 V to
+0.5V at a scan rate of 0.050 V·s
-1
(Figure 1).
Figure 1: Cyclic voltammograms of biosensors immersed
in 4·10
-4
M catechol (in PBS, pH=7); a) Tyr/LuPc
2
-AA, b)
Tyr/LuPc
2
-CP.
The cyclic voltammogram of the Tyr/LuPc
2
-AA
biosensor in 4·10
-4
M catechol (pH 7.0 phosphate
buffer solution) showed a redox pair at E
1/2
=-0.24V
associated with the one electron reduction of the
phthalocyanine ring (de Saja and Rodriguez-
Mendez, 2005). The peaks related with catechol
appear at +0.01V (cathodic peak associated with the
reduction of the enzymatically formed o-quinone to
catechol) and at +0.40V (anodic peak associated to
the electrochemical oxidation of the catechol),
respectively.
The cyclic voltammogram of the Tyr/LuPc
2
-CP
biosensor in the same solution do not show the peaks
related with phthalocyanine. As is show in the
Figure 1b, only the peak corresponding to enzymatic
reduction of the o-quinone to catechol appearing at
-0.07V is observed.
The results are similar in the case of phenol
analysis. The peak pair corresponding to LuPc
2
is
clear only in the case of Tyr/LuPc
2
-AA biosensor.
Additionally, only the reduction peak of the
enzymatically formed o-quinone at biosensor surface
is observed. In the case of LB biosensor the peak
appear at +0.01V and in the case of CP biosensor at
-0.07V.
The presence of reduction peak indicates that the
immobilization process retains the biological activity
of tyrosinase in both solid substrates.
3.2 Kinetic of the Biosensors
Kinetic studies were performed by registering the
cyclic voltammograms of the biosensors at different
scan rates, from 0.02 to 0.20V·s
-1
(Figure 2).
Figure 2: Cyclic voltammograms of biosensors a)
Tyr/LuPc
2
-AA, b) Tyr/LuPc
2
-CP registered at different
scan rates. Electrolyte solution was 4·10
-4
M catechol (in
PBS 0.01M, pH=7).
In both cases, the cathodic peak currents were
proportional to sweep rates pointing to a charge
transfer limited process due to the catalytic activity
of the enzyme deposited in the surface of the
electrode. The principal parameters of linear
regression equation of the plots I vs. V were
BIODEVICES 2012 - International Conference on Biomedical Electronics and Devices
106
presented in the Table 1.
Table 1: Quantitative data obtained from kinetic studies
for cathodic peak.
Tyr/LuPc
2
-AA
m R
2
Γ
/ mol·cm
−2
Phenol
-0.1124 0.988 2.20·10
-9
Catechol
-0.2812 0.986 1.77·10
-8
Tyr/LuPc
2
-CP
m R
2
Γ
/ mol·cm
−2
Phenol
-0.0036 0.981 7.04·10
-10
Catechol
-0.0068 0.976 4.28·10
-9
m- is the slope of the plots I
c
vs. v
The trends observed when immersing the biosensors
in phenolic compounds solutions were similar. In
both cases, the same o-quinone is enzymatically
formed, which is electrochemically reduced at
biosensor surface.
Tyr/LuPc
2
-AA biosensor showed a
fast electron transfer between the phenolic
compounds and LB thin film. When the carbon
matrix was used as support material, the electron
transfer was difficult and the signals showed a
smaller intensity. The differences are in the range of
two orders of magnitude.
From the slope of this line and using the Laviron
equation:
I
c
= n
2
F
2
v A Γ / 4 R T
(1)
where Γ is the surface coverage of the redox species
(o-quinone) (mol·cm
−2
), A is the electrode area
(cm
2
), ν is the potential sweep rate and n, I
c
, F, R
and T have their usual meanings (Bard and Faulkner,
2001), the total surface coverage could be
calculated.
The values obtained were presented in Table 1.
The highest surface coverage values were obtained
in the case of Tyr/LuPc2-AA biosensor. This result
suggests that in the LB thin film exist a greater
number of active sites comparing with carbonaceous
matrix. Therefore, the enzyme preserve better the
biocatalytic activity when is immobilized in a
biomimetic environment.
The intensity of peaks related to the
electrochemical oxidation of phenolic compounds
increases linearly with the square root of the sweep
rate (Table 2) indicating a diffusion controlled
processes according to the Randles-Sevcik equation.
I
a
=2.687·105 n
3/2
v
1/2
D
1/2
A C (2)
where I
a
is the peak current, A is the electrode
surface area, D is the diffusion coefficient, and C is
the concentration. From the I
a
, in function of v
1/2
plot, the diffusion coefficient D could be calculated.
Table 2: Quantitative data obtained from kinetic studies
for anodic peak.
Tyr/LuPc
2
-AA
m R
2
D / cm
2
·s
-1
Phenol
0.2235 0.967 6.32·10
-6
Catechol
0.6276 0.978 7.87·10
-5
Tyr/LuPc
2
-CP
m R
2
D / cm
2
·s
-1
Phenol
0.0024 0.959 5.40·10
−7
Catechol
0.0063 0.961 5.34·10
-6
m- is the slope of the plots I
a
vs. v
1/2
From the above results, could be concluded that the
Tyr/LuPc
2
-AA presents the fastest diffusion
coefficients pointing that the electrochemical
processes a more rapid in the case of nanostructured
thin film.
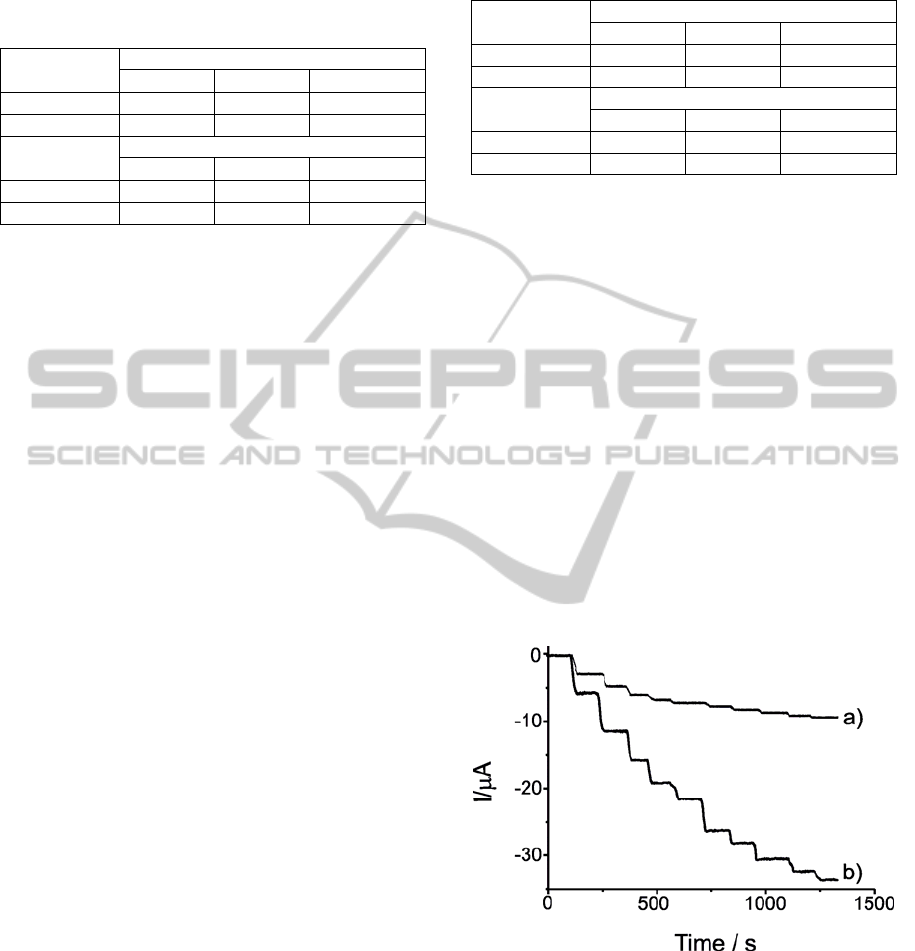
3.3 Amperometric Response of the
Biosensors
Figure 3 illustrates the amperometric response for
the Tyr/LuPc
2
-CP biosensor at -0.07V V (a) and for
the Tyr/LuPc
2
-AA biosensor at +0.01V V (b) after the
addition of successive aliquots of phenol to the 0.01
M PBS (pH 7.0) under constant stirring. Definite
reduction currents proportional to the concentration
of phenol were observed, which results from the
electrochemical reduction of o-quinone species
enzymatically formed.
Figure 3: Amperometric response of a) Tyr/LuPc
2
-CP and
b) Tyr/LuPc
2
-AA biosensors to phenol in 0.01 M PBS
solution (pH=7).
The Tyr/LuPc
2
-AA biosensor achieves 95% of steady-
state current in less than 4 s. The response rate is
much faster than that of 7 s obtained in the case of
Tyr/LuPc
2
-CP biosensor. The faster response could
be attributed to a more rapid electron transfer
between the enzymatically-produced quinone and
NANOSTRUCTURED VS. CARBONACEOUS BIOSENSORS - Comparative Studies for Detection of Phenolic
Compounds
107
the biomimetic LB thin film comparing with carbon
paste biosensor.
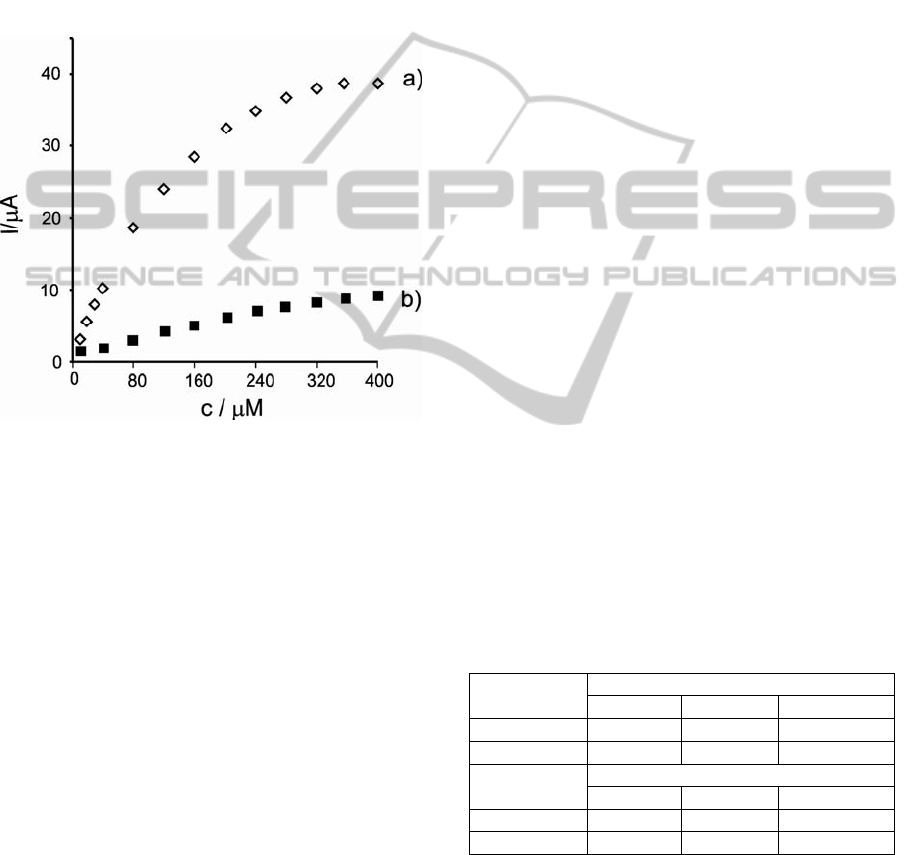
3.4 Effect of Phenolic Compounds
Concentration
Figure 4 showed the relationship between the
response current of the biosensors and the phenol
concentration in PBS (pH 7.0) at +0.01V for
Tyr/LuPc
2
-AA biosensor and -0.07V for Tyr/LuPc
2
-
CP biosensor (calibration curves).
Figure 4: The calibration curve between the reduction
current and the concentration of catechol in PBS (pH 7.0)
of a) Tyr/LuPc
2
-AA and b) Tyr/LuPc
2
-CP biosensors to
phenol in 0.01 M PBS solution (pH=7).
The response current of Tyr/LuPc
2
-AA biosensor is
linear with phenol concentration in the range from
10 to 120μM, indicating that the enzyme catalytic
reaction of Tyr is the first-order reaction. Then, with
further increasing catechol concentration, the current
increases slowly, and the enzyme reaction shows a
transition from first to zero-order. The sensitivity of
the biosensors is 0.053μA·μM
-1
. The corresponding
detection limits were calculated according to the
3s
b
/m criterion, where m is the slope of the
calibration graph, and s
b
was estimated as the
standard deviation (n = 7) of the amperometric
signals from different solutions of the substrate at
the concentration level corresponding to the lowest
concentration of the calibration plot. The detection
limits calculated were 5.4 μM. The values obtained
are lower than that obtained in the case of
Tyr/LuPc
2
-CP biosensor (the sensitivity is
0.0075μA·μM
-1
and the detection limit is 8.57 μM).
Therefore the Tyr/LuPc
2
-AA biosensor has better
quality performances comparing with Tyr/LuPc
2
-CP
biosensor.
From the calibration data, the Hill coefficient (h)
can be calculated by representing the log[I/(I
max
-I)]
vs. log [S] (the logarithm of substrate concentration).
A Hill coefficient of 1.09 was calculated for the
reduction process of o-quinone formed from the
enzymatic reaction on the electrode surface
(R
2
=0.952) for Tyr/LuPc
2
-AA biosensor. In the case
of Tyr/LuPc
2
-CP biosensor a Hill coefficient of 0.94
was obtained. The value obtained for the h
parameter, calculated from the corresponding Hill’s
plot, was close to unity demonstrated that the
kinetics of the enzymatic reaction fitted into a
Michaelis–Menten type kinetics. The value slightly
higher than 1 obtained for Tyr/LuPc
2
-AA biosensor
(h=1.09) demonstrates a positive cooperative effect
between the occupied active sites. A negative
cooperative effect between the occupied active sites
takes place in the case of Tyr/LuPc
2
-CP biosensor
(h=0.94).
The apparent Michaelis–Menten constant (K
M
) is
calculated for the immobilized Tyr by using the
linearization of Lineweaver-Burk expressed by eq.
(3) (Shu and Wilson, 1976).
1/I = 1/I
max
+ K
M
/ (I
max
·[S] ) (3)
where I is the cathodic current, I
max
is the steady-
state current, K
M
is the apparent Michaelis-Menten
constant and [S] is the concentration of substrate.
The maximum current response and apparent
Michaelis–Menten constant were calculated from the
intercept and slope. The values obtained for both
biosensors immersed in phenolic compounds
solutions were presented in Table 3.
Table 3: Response characteristics of the biosensors to
phenolic compounds.
Tyr/LuPc
2
-AA
LD /
μ
MI
max
/
μ
A K
M
/
μ
M
Phenol
5.40 39.11 81.52
Catechol
1.80 45.65
24.56
Tyr/LuPc
2
-CP
LD /
μ
MI
max
/
μ
A K
M
/
μ
M
Phenol
8.57 9.31 241.93
Catechol
8.19 11.61 92.42
In agreement with the inherent characteristic of
Michaelis–Menten constant, the small the value of
K
M
, the stronger will be the affinity between Tyr and
substrate. A highest I
max
indicate a higher sensitivity
of the biosensor (Kiralp and Toppare, 2006).
BIODEVICES 2012 - International Conference on Biomedical Electronics and Devices
108

The values obtained indicate that the Tyr/LuPc
2
-AA
biosensor have highest quality performances.
4 CONCLUSIONS
It is demonstrated that the biomimetic LB thin film
biosensor have the advantages of maintaining
enzyme bioactivity, making the enzyme catalytic
sites close and easily accessible to the substrate
molecules comparing with tyrosinase-based carbon
paste biosensor.
The kinetic studies demonstrate that Tyr/LuPc
2
-
AA biosensor have a fast electron transfer between
the phenolic compounds and LB thin film. In the
case of Tyr/LuPc
2
-CP biosensor, the electron
transfer was difficult and the signals showed a
smaller intensity.
These advantages lead to significant
improvement of the affinity, response sensitivity and
detection limit of Tyr/LuPc
2
-AA to phenol and
catechol in pH 7.0 phosphate buffer.
ACKNOWLEDGEMENTS
The authors are grateful to the Spanish Ministry of
Science-CICYT (Grant AGL2009-12660/ALI) for
the financial support.
REFERENCES
Ameer, Q., Adeloju, S. B., 2009. Sens. Actuators B 140,
5–11.
Apetrei, C., Alessio, P., Constantino, C. J. L., de Saja, J.
A., Rodriguez-Mendez, M. L., Pavinatto, F. J.,
Fernandes, E. G., Zucolotto, V., Oliveira, O. N., 2011.
Biosens. Bioelectronics 26, 2513-2519.
Bard, A. J., Faulkner, L. R., 2001. Electrochemical
Methods, John Wiley and Sons, New York.
Bukowska, B., Kowalska, S., 2004. Toxicol. Lett., 152,
73–84.
Cabaj, J., Sołoducho, J., Nowakowska-Oleksy, A., 2010.
Sens. Actuat. B, 143, 508-515.
Carralero, V., Mena, M. L., Gonzalez-Cortes, A., Yanez-
Sedeno, P., Pingarron, J. M., 2006. Biosens.
Bioelectron., 22, 730–736.
Cosnier, S., Szunerits, S., Marks, R. S., Lellouche, J.,
Perie, K., 2001. J. Biochem. Biophys. Methods, 50,
65–77.
de Saja, J. A., Rodríguez-Méndez, M. L., 2005. Adv.
Colloid Interf. Sci. 116, 1 –11.
Granero, A.M., Fernández, H., Agostini, E., Zón, M. A.,
2010. Talanta 83, 249-255.
Hill, M. K., 2004. Understanding environmental pollution,
Cambridge University Press, UK.
Kazandjian, R., Klibanov, A., 1985. J. Am. Chem. Soc.
107, 5448-5450.
Kiralp, S., Toppare, L., 2006. Process Biochem. 41 236–
239.
Kovács, A., Mörtl, M., Kende, A., 2011. Microchem. J.,
99, 125-131.
Kumar Vashist, S., Zheng, D. Al-Rubeaan, K., Luong,
J.H.T., Sheu, F.S., 2011. Biotechnol. Adv. 29, 169-
188.
Ma, Y., Yang, C., Li, N., Yang, X., 2005. Talanta, 67,
979–983.
Manahan S. E., 1991. Environmental Chemistry, Lewis
Publishers, New York.
Moldoveanu, S.C., Kiser, M., 2007. J. Chromatography A,
1141, 90–97.
Palmer, T., 1991.Understanding Enzymes, Prentice-
Hall/Ellis Horwood, London.
Pavinatto, F. J., Fernandes, E. G. R., Alessio, P.,
Constantino, C. J. L., de Saja, J. A., Zucolotto, V.,
Apetrei, C., Oliveira Jr., O. N., Rodriguez-Mendez M.
L., 2011. J. Mater. Chem. 21, 4995-5003.
Roberts, G. G., 1990. Langmuir Blodgett Films, Plenum,
New York.
Rogers, K. R., Becker, J. Y., Cembrano, J., Chough, S.H.,
2001. Talanta 54, 1059–1065.
Shiddiky, M. J. A., Torriero, A. A. J., 2011. Biosens.
Bioelectronics 26, 1775-1787.
Shu, F. R., Wilson G. S., 1976. Anal. Chem. 48, 1679-
1686.
Tsai, Y., Chiu, C., 2007. Sens. Actuators B, 125, 10–16.
Yin, H., Zhou, Y., Xu, J., Ai, S., Cui, L., Zhu, L., 2010.
Anal. Chim. Acta 659, 144–150.
Zejli, H., Hidalgo-Hidalgo de Cisneros, J. L., Naranjo-
Rodriguez, I., Liu, B., Temsamani, K. R., Marty, J. L.,
2008. Anal. Chim. Acta 612, 198-203.
NANOSTRUCTURED VS. CARBONACEOUS BIOSENSORS - Comparative Studies for Detection of Phenolic
Compounds
109
