
BUSINESS PROCESS ENTERPRISE MODEL
Operations Research for Managing Business Process Communication
and Performance
Yves Caseau
Bouygues Telecom, 82 rue H. Farman, 92447 Issy-les-Moulineaux, France
Keywords: Enterprise modelling, Business process, Simulation, Communication flows, Organization theory.
Abstract: This paper presents a computational model of a generic enterprise (BPEM, which stands for Business
Process Enterprise Model), based upon the core concept of business process. BPEM may be seen as a bridge
between two worlds of “Enterprise Models”, the world of mathematical models, formal and fully
operational for optimization purposes and the world of conceptual models (boxes & arrows type) for
management science, for reasoning and communicating about what a company is. Our model was built as
the minimal and most elegant model that is detailed enough to investigate difficult management science
issues such as the influence of hierarchical organization on performance, the optimal usage of various
communication channels or the benefits of lean-management-style control of processes. BPEM is organized
around four concepts: business processes, capabilities that encapsulate resource management, hierarchical
and transverse management organization, as well as information flows that are required to run business
processes.
1 INTRODUCTION
Operations Research has a long tradition of
successes to improve the performance of enterprises.
The traditional approach is to define a business
problem with a mathematical model and to use
optimization techniques to provide an optimal or an
improved solution that translates into better business
performance. The goal of this paper is different,
since we aim to use mathematical modelling and
optimization techniques to provide insights about the
intrinsic performance of business processes.
The contribution of this paper is to propose a
computational model of a generic enterprise, which
describes its business processes, its organization and
its information flows. Because of its generic nature,
such a model cannot be used to “solve” business
problems, but it is a tool for better understanding,
through analysis or simulation, a number of hard
questions from management science. For instance,
we may assess the benefit of lean management
applied to business processes, evaluate the impact of
organizational architecture or study the impact of the
amount of time spent during meetings, which is
often criticized in today’s large organizations.
The search for a realistic enterprise model is
nothing new. It is at the heart of management
science. Without a model, entreprises are left with
trials and errors, with empiric studies of what works
and what does not, as far as organizations and
reorganizations are concerned. The difficulty is that
simple models that are adequate for paper studies
leave too many aspects of corporate life aside, while
intricate computational models tend to be too
complex to understand, hence the results obtained
though simulation leave most practical managers
skeptical. Our aim, with the model that we propose
in this paper, is to find a balance bewteen the two.
This paper is organized as follows. Section 2
discusses the motivations behind introducing a
computational model for enterprise performance.
We relate our approach with a number of pre-
existing enterprise models, and with classical
theories of the enterprise. We define the objective
assigned to this model, which is to evaluate short-
term performance – the long-term issues of learning
and structure evolution are left aside – with respect
to organization – that is, the way decisions and
communications are handled –, business processes
and capability management. Section 3 provides a
description of BPEM (Business Process Enterprise
11
Caseau Y..
BUSINESS PROCESS ENTERPRISE MODEL - Operations Research for Managing Business Process Communication and Performance.
DOI: 10.5220/0003718200110020
In Proceedings of the 1st International Conference on Operations Research and Enterprise Systems (ICORES-2012), pages 11-20
ISBN: 978-989-8425-97-3
Copyright
c
2012 SCITEPRESS (Science and Technology Publications, Lda.)

Model). This model may be seen as the combination
of business process, value creation, organization and
communication models. This model is the fruit of
many years of simulation, trying to reach the afore-
mentioned compromise between simplicity and the
ability to look at complex aspects of enterprise
efficiency. Section 4 demonstrates this claim with
various examples of applying BPEM to different
sides of management science. We first use this
model for a study of the use of different
communication channels. We have also used this
approach to characterize some of the benefits of lean
management (Womack, Jones and Root, 2004). Last
we explain how this model may be used to evaluate
the impact of organization on performance. Section
5 concludes with some perspectives about new
applications and future work.
2 MOTIVATIONS
2.1 Enterprise Theories
Our goal is to build a computational model –
suitable for simulation and optimization –, but any
model reflects a theory of the enterprise. Our work
is, therefore, rooted in the tradition of describing and
understanding the inner working of a company. The
first pillar of our approach is none other than F.
Taylor’s scientific organization of companies from
(Shafritz and Ott, 2001), based upon business
processes, break-down of activities and
specialization. Although one of our goal is to
challenge the benefits of “breakdown & specialize”,
business processes are still a powerful tool to
describe a company.
A second key concept of “Enterprise Theory” is
“transaction costs”, as defined by Ronald Coase and
further developed by O. Williamson. One of the
main benefits of a company is to reduce transaction
costs. Thus, it is necessary to take transactions and
communication into account in our model. Our work
is equally influenced by the SCP model of E. Mason,
which separates structure, conduct and performance.
The importance of communication is a
cornerstone of our approach, as will be illustrated in
Section 4. We follow in the footsteps of March and
Simon who wrote “The capacity of an organization
to maintain a complex, highly interdependent
pattern of activity is limited in part by its capacity to
handle the communication required for
coordination” in (March and Simon, 1993). Their
book is focused on decision making, and the flow of
information within organizations that instructs,
informs, and support decision making processes.
Performance is defined as valued creation, as
defined by M. Porter in (Porter, 1980). Value
analysis is a common technique that is jointly used
with business process decomposition (for instance
with lean management). Starting with a value chain
that defines the position of a company within its
industrial ecosystem, value creation may be
attributed to business processes, through the
definition of work units (services, products, etc.).
Our work is strongly influenced by Mintzberg
(Mintzberg, 2009), who is famous for proposing
different model of enterprises and organizations.
Mintzberg has characterized different types of
organization (from hierarchical to matrix- or
networked-organization). Our overall model (cf.
Figure 2) is quite close in its structure with
Mintberg’s organizational model in (Gabarro, 2005).
2.2 Enterprise Models
Modelling the enterprise is necessary for the design
of information systems, as well as the formalization
of frameworks for total quality management (TQM).
Therefore, there already exist a number of semi-
formal models that describe what an enterprise is
and (partially) how it operates. Since our goal is to
propose a computational model which may also be
used for explanation and communication, we tried to
inherit as many traits as possible from existing
“enterprise models”. Here is a list of models which
are fully compatible with BPEM:
A traditional view of a company is the
function/ business process matrix (Galbraith
1998). In this model, the company is seen as a
set of functional units, which operate business
processes. Each unit is responsible for a given
activity, the combination of which makes
processes that deliver value to customer.
CEISAR is a research center dedicated to
Enterprise Architecture, which has developed
over the years a complete and elegant
“enterprise model” (CEISAR, 2008). The
cornerstone of this model is the business
process, a sequence of actions that produce
value (to the end customer). Business
Processes are operated by actors, who rely on
resources (managed with their own processes).
The CEISAR model describes the
organization of roles, actors and various
resources including information.
BAPO is a model developed at Philips (Van
der Linden et all, 2004) for an ITEA project
ICORES 2012 - 1st International Conference on Operations Research and Enterprise Systems
12

related to software management. BAPO stands
for Business, Architecture, Processes and
Organization. The BAPO model provides with
ways to characterize the maturity of a
company across those four dimensions (in a
way similar to CMMI (Chrissis, Konrad and
Schum, 2003)).The process characterization
(predictability, repeatability, quantification) is
somehow similar to the model of Section 3.3.
The organizational model, although focused
on software organization, carries the key traits
that we use in BPEM.
IDEA (Ludwig and Farcet, 2010) is a system
engineering methodology which includes an
“Enterprise Architecture model” based on
processes, capabilities, and roles. An
enterprise is a collection of capabilities and
roles that execute processes that rely on
services. The introduction of capabilities in
BPEM (3.2) is directly inspired from IDEA.
IDEA is itself inspired from the NATO
Architecture Framework (NAF).
Similarly, the British Ministry of Defense
produced an Architecture Framework called
MODAF which includes an enterprise model
that is also based on capabilities, roles and
activities (MODAF, 2008).
The French “club of business process owners”
produced in their collective book a rich
“enterprise model” that goes further than the
previously mentioned ones (Club de Pilotes de
Processus, 2008). In an approach that is
similar to CEISAR’s, the core of the model is
built around business processes and
information systems, but this core is itself
placed in a continuous improvement loop.
This loop models the reaction of the enterprise
according to its current performance and its
strategy, using the transformation levers such
as learning, innovation and re-engineering.
These models are conceptual models, which easily
lead, for instance, to UML models. They define
precisely the concepts which are necessary to
describe and understand how an enterprise works.
One of the most thorough efforts to produce an
“Enterprise Architecture Model” that includes an
“Enterprise Model” is the PRAXEME method which
is related in (Bonnet, Detavernier and Vauquier,
2009). A computational model relies on a conceptual
model, but goes further, to fully specify “how things
work”.
2.3 A Computational Model of
Enterprise Efficiency
A computational model allows the simulation of a
company’s internal working. To specify a
computational model, it is necessary to understand
which aspects of the functioning are deemed to be
interesting. BPEM has evolved from a number of
computational studies, aimed at characterizing issues
from management science. BPEM may be defined as
the “simplest common model” that supports these
kinds of studies. Namely, here are some of the issues
that we want to address through computer
simulation:
value creation (especially with respect to SLA
– service level agreements), in the spirit of
(Reinertsen, 2009),
reactivity to events and load distributions,
lean management (pull vs. push, focus on lead
time reduction, WIP – work in progress –
management),
management of communication flows,
shape of the management organization (shape
of the hierarchical pyramid, process-function
matrix).
On the other hand, we tried to make BPEM “just
right”, using “Occam’s razor principle”, in order to
deliver computational experience that as close to
self-explanatory as possible. This requires to avoid
“generic efficiency parameter” (we shall see later
that there remains a few) and to keep away from
parts that are really difficult to model (in an
operational way). This is why BPEM is only
concerned with “short-term efficiency” and why we
leave aside issues such as:
learning (as well as the capitalization of
knowledge, although BPEM shares many
concepts with (Nonaka, Toyama and Hirata,
2008)),
long-term evolution & self-organization,
resource management optimization (we shall
assume later on that resources are used
optimally).
Figure 1: BPEM perimeter from an EFQM perspective.
Leadership
Process
KPI
people
Policy &
Strategy
Partnership &
resources
Leadership
Customer
results
Society
results
Innovation & Learning
enablers
results
Left out
(long term)
Perimeter of
BPEM
BUSINESS PROCESS ENTERPRISE MODEL - Operations Research for Managing Business Process Communication and
Performance
13
To illustrate what is left aside, we use the EFQM
framework in the previous figure (EFQM is the
European Foundation for Quality Management).
The background of Figure 1 is the EFQM model of
enterprise functions. We see that BPEM (dashed
ellipse) is only concerned with the core of the
company’s activities. This approach is similar to
“enterprise simulation” models that are produced for
“serious games” software (Datar, 2000). Indeed, as
we shall see in section 5, a possible outcome of
BPEM is a scenario-exploration tool which helps
understanding the impact of organizational
architecture.
3 THE “BPEM” MODEL
3.1 Enterprise Model
The BPEM model is defined as the combination of
four components:
The core of the enterprise is a set of business
processes that are triggered by external events
which represent customer requests. Business
processes entail a sequence of activities
supported by the enterprise’s capabilities.
Each process run consumes a quantity of
resources and takes a certain amount of time,
both of which are explicitly modelled (cf. 3.3).
The value that is created by a successful
process termination is a function of time.
There exists an explicit SLA (service level
agreement) with an associated time window.
A delivery after the maximum allowed time
brings no value.
The teams that combine human resources
(skills and time) and material resources are
glued together by a management organization
that performs the necessary decision-making.
This organization is the juxtaposition of two
common forms: a hierarchical pyramid that
links the CEO to all team leaders, as well as a
transverse “process” organization which is
dedicated to “horizontal” communication
(Galbraith, 1998).
BPEM associates two kinds of information
flows to business processes, horizontal
(synchronization & transfer) and vertical
(reporting and management). Information
flows are measured with time (the time it
takes to process/understand a given piece of
information) and are generated according to
the business processes. Communication flows
are supported by a central component called
the “communication matrix” which represents
the sum of all communication channels (face-
to-face, phone, email, meetings, etc.).
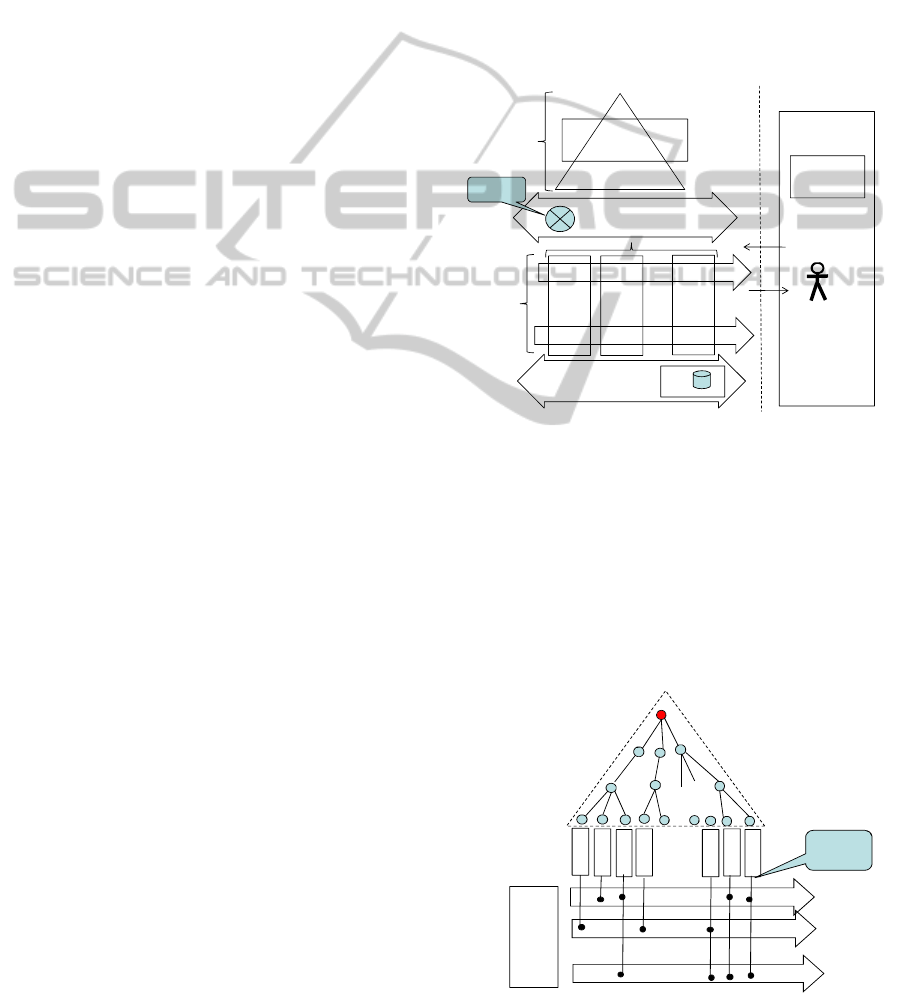
This model is summarized by the figure below.
Notice that we have represented the information
system explicitly, but that it does not play any
specific role in the operational semantic that we
shall develop, where it is seen both as a resource and
part of the communication matrix. Making it visible
on this figure is useful for communication purposes
(cf. the link with Enterprise Architecture models
such as those of Section 2.2).
Figure 2: Overview of the BPEM model.
3.2 Organization Model
The next figure is a close-up on the organizational
model. The hierarchical part is a traditional
management pyramid which is defined by its height
and the average span (the number of subordinates
for each manager). These dimensions have a direct
impact on the propagation of information through
the hierarchical channel.
Figure 3: Organizational Model.
H
T
Communication Matrix
C
1
C
2
C
n
…
Information System
IT
Business Processes
Market
Competitors
Requests
delivery
Management
Capabilities
Functional
mapping
T
U
1
…
Hierarchical
Management
U
2
U
3
…
U
4
U
U
n-1
U
n
Process (Transverse)
Management
Functional
mapping
ICORES 2012 - 1st International Conference on Operations Research and Enterprise Systems
14

The process management component is simply a
set of available man.hour of management to convey
information from one part of the process to the
other. It supports a transmission that is simpler
(hence faster) than going through hierarchical
management. This is a simple yet effective way of
testing the influence of matrix-style management.
There is no assumption about the matching
between processes and teams (units) which are the
leaf nodes of the hierarchical organization. From a
business process perspective, the enterprise is
organized into capabilities, which represent the
combination of resources and skills necessary to
perform a given activity. Figure 4 represents the
concept of capability, which may be seen as the
combination of functional domain (there are n
functional capabilities here) and resources (there are
p resources associated with the first capability). A
resource is an abstraction that covers human as well
as material resources. It is described with
skills/competencies, with an associated level. Hence,
each resource is a tuple (here, there are q skills). The
skills determine which resources may be used for
which activity (cf. next section). If a resource
possesses the right skills at the appropriate level, the
efficiency (the time it takes to perform the activity)
depends on the level difference (a high level
represents a form of “mastery”). This decomposition
of organizational units with skills is very similar to
(Nelson and Winter, 1982).
Figure 4: Capability Model.
The concept of “functional mapping” (the
correspondence matrix between units and
capabilities) is not part of the operational semantics
since we assume that resources may be located and
requested optimally (this is another instance of the
“Occam’s razor” principle: we found that
introducing an extra layer of complexity to represent
this correspondence was of no value since not
enough is known in the “real world of companies” to
calibrate such an extension to the BPEM model).
3.3 Business Process Modelling
Business Processes are one of the most common
concepts of management literature (Burlton, 2001).
We distinguish the concept of process pattern, which
is a model for how the work is executed, and process
instance, which is the actual sequence of activities
that produce value. A process pattern is a sequence
of activity pattern (this is a simplified view of what a
process is, but sufficient to our purpose here). The
activity pattern tells which capability is exercised,
which are the necessary skills and their associated
levels.
A process instance is generated by a customer’s
request. A request has a type (the process pattern),
an expected value V, and a quantitative indication of
how much work is required. It may be generic (the
amount of work is a property of the business pattern)
or specific (each request comes with a set of units
that tell how much work is required for each skill of
each activity – the unit is time, such as man.hour).
BPEM uses a stochastic generator to produce such
requests, with the ability to generate all types of
incoming work distribution, as well as all types of
workload distribution. This is a way to evaluate
companies’ flexibility and reactivity.
The value produced by a process is a simple
linear function (see Figure 5) defined by the time
window that defines the SLA of the customer’s
request. The maximal value V is obtained if the
service is delivered before the minimum date. It is
null if the maximum date has occurred and decreases
linearly between these two values.
Figure 5: Business Process Communication Model.
Another major simplification of BPEM
(Occam’s razor) is to evaluate quality with respect to
C
1
C
2
C
n
…
Capabilities
R
1
(l
1
,l
2
, .. , l
q
)
Set of Ressources
Activity
R
2
(l
1
,l
2
, .. , l
q
)
R
p
(l
1
,l
2
, .. , l
q
)
WBS
Σ(skill, level, units)
Efficiency= duration
= f( skill match)
A
1
:C
1
Σ(skill,level)
A
2
A
n
Process pattern
Stochastic
Request
Model
1
Process Instance
value
time
WBS
Σ (units)
WBS
Σ (units)
WBS
Σ (units)
Variation in rate &
load
request
V
V
BUSINESS PROCESS ENTERPRISE MODEL - Operations Research for Managing Business Process Communication and
Performance
15

one unique dimension: time. It would be quite
logical to introduce a “quality” dimension to the
evaluation of business process execution. Quality
could actually depend on skill match and impact the
value that is being produced. We use a single-
versus-dual dimension approach because we found
that an additional dimension only adds complexity,
arbitrary equations and factors, and does not provide
any additional expressive power. On the other hand,
focusing of COD (Cost of Delay) is justified by
(Reinertsen, 2009) as the most salient metric for
business processes.
3.4 Business Process Communication
Model
Following the insights of March & Simon that were
presented in Section 2.1, a distinctive feature of
BPEM is to represent communication flows, which
come in two flavors: horizontal and vertical (cf.
Figure 5). BPEM does not represent inter-unit
communication flows, since it may be included in
the activity model, as one of the time-consuming
activities. It only focuses on enterprise-wide
information flows which interplay with the
company’s organization. The links between the
communication architecture and the structure of that
the company produces was pointed out a long time
ago by Melvin Conway in a famous article (Conway,
1968).
The importance of information flows vary
according to the enterprise’s domain.
Communications are more important with valued-
added immaterial services, such as software
development, that they are with industrial factory
production. In order to use BPEM as a
production/simulation model, we need to introduce
communication in a quantitative form with explicit
effect on performance and output.
Horizontal flows represent information that
needs to be exchanged between two consecutive
activities of one business process. A major feature of
modern work is that a significant amount of context
information must be exchanged between process
participants. This is precisely one of the trends that
goes against the principles of “break-down and
specialization” from Frederick Taylor. BPEM
associates a “synchronization and transfer flow” to
each pair (A,B) of consecutive activities within a
process, with the constraint that B cannot be
completed until the (A→B) transfer has been
completed.
Vertical flows represent the exchange of
information that is necessary between the teams and
their management, for reporting and decision
making. These “monitoring and management” flows
are associated to each activity from the business
processes.
Flows are generated at the same time business
processes requests are generated. A flow is mostly
characterized by the amount of time it takes to
process the information. This amount is a linear
function of the activity completion time (the
coefficient is a parameter of the model – cf. Section
4.1). We make no assumption about the
communication channel that will be use to support
the flow, but we also qualify the “span”, which is an
abstract indication of how many persons need to
receive the information.
Decision making in BPEM occurs in two forms,
which are related to two kinds of events (represented
with short arrows in the following figure). The first
kind represents a “production event”, when a given
activity requires significantly more resources than
what was initially anticipated. The model assumes
that the reaction (which requires a decision from the
management) occurs with the latency of the
associated vertical flow. The second type of event is
a change to the value of a process instance that is
currently run. The valuation change reflects an
“environmental change” (from the customer/market
or from the competition). The decision is a re-
prioritization of the process instance, which also
occurs after a delay (latency) which is derived from
the associated vertical flow. In other words, BPEM
generates a vertical flow associated to an activity.
The simulation software (cf. Section 4.1) schedules
this flow which produces a latency (the time to
process the associated information) which is taken as
the time it takes to react to events.
Figure 6: Business Process Communication Model.
H
T
Management
Process
Monitoring &
Management
Transfer &
Synchronize
WBS
Σ (units)
WBS
Σ (units)
WBS
Σ (units)
Environment
Event: Value
Variation
Event :
production
variation
ICORES 2012 - 1st International Conference on Operations Research and Enterprise Systems
16

4 APPLICATIONS
4.1 Managing Information Flows
The first application of BPEM is a simulation tool
designed to study the impact of communication
channels. We define four categories of
communication channels:
Synchronous one-to-one communications,
such as face-to-face meetings or telephone
calls.
Meetings, which support many-to-many
communications but require scheduling.
Asynchronous communication methods, such
as email, blogging, micro-blogging, Intranet
document sharing, etc.
Hierarchical scheduled communication, which
uses the manager-employee relationship and
the regularly scheduled face-to-face meetings.
We use a “channel communication model”
which defines how communication flow units may
be scheduled though each type of communication
channel. More precisely, each channel is described
though a number of parameters and equations that
define its latency (information propagation time), the
average number of recipients (when relevant), the
average loss factor (from which we derive the
average number of times that a message needs to be
sent to be understood). Our goal is to study under
which hypothesis which channels should be used
preferably, for a given company context.
The focus of our interest is a matrix which tells
the frequency of use of each communication channel
type (including the typical amount of time spent in
meetings), called the “channel policy”. The
assembly with the BPEM model is described in the
following figure. For a given company model
(processes, organization, context = request profile),
BPEM generates a load of work to be processed,
which comes from activities derived from the stream
of requests and communication flows associated to
these activities. These tasks are fed to a scheduler,
which assigns each task to the best matching
resource. It is possible to play with various
assignment schemes, but we usually simply select
the first available resource, with the better skill
match to separate ties. To schedule a communication
unit, the first step is to look into the “channel policy
matrix” to find which channel is used, and then use
the “communication channel model” to find when
the actual communication may take place. This
model is not an actual scheduler (where each hour of
each agent would be represented), it is a set of
equations that provide an approximate formula for
the latency that is observed for each communication
channel.
Rather than guessing the best channel policy, it
is easy to compute it as a fixed-point of a learning
process, using a simple local-optimization-loop such
as described in (Caseau, Silverstein and Laburthe,
2001). We incrementally modify the “channel
policy” matrix in order to maximize the value
generated by business processes. The result of the
simulation is, therefore, the best communication
channel usage, given the company description (using
BPEM) and the channel characterization.
Figure 7: Simulation of Information Flows.
The BPEM company description is itself the
combination of the company’s BPEM instance (its
processes, its capabilities, its organization) and the
“scenario” that contains the parameters that govern
the stochastic load generation as well as the event
generator. The BPEM instance usually does not
change, while we use different scenarios to evaluate
how the company reacts to changes in its
environment (more about this in the next section).
The following figure shows an example of the
output of such simulation. We used this simulation
tool extensively a few years ago to evaluate the
importance of various communication channels.
Figure 8: Typical result of simulation.
BPEM
Results
(value)
Learning
(optimization)
Activities to be
assigned to
resources
Communication
Channel
Model
Channel
Policies
Communication
Flow units to be
scheduled
Scheduler
=== Experiment E1 ====
done on Mon May 29 03:47:34 2006
scenario = S1 x 10 iterations
context = Telephony
-------------- summary for scenario S1 @ 12463s -------------------
chanel ASYNC : (17% of info) 13% usage [9%] 114839 load -> 134096 used (85%)
chanel SYNC : (28% of info) 19% usage [13%] 110938 load -> 217216 used (51%)
chanel MEET : (44% of info) 46% usage [12%] 245355 load -> 342275 used (71%)
chanel HF2F : (8% of info) 16% usage [13%] 41170 load -> 67112 used (61%)
unit CRM : 40% usage [5%]
unit IT : 44% usage [5%]
unit Mkt : 48% usage [3%]
unit Sales : 45% usage [3%]
unit Network : 46% usage [2%]
unit Com : 45% usage [5%]
process BillUsage : 1750k$ [95%]
process SellService : 565k$ [85%]
process LaunchService : 635k$ [73%]
process PromoteService : 1068k$ [84%]
total value = 2277k$ [dev 19%]
average rate of return = 140%$
average diameter = 28 [10%]
BUSINESS PROCESS ENTERPRISE MODEL - Operations Research for Managing Business Process Communication and
Performance
17

What we have shown (on one practical company
example) is that:
Email is an efficient communication channel
(which does not mean that alternate electronic
tools cannot do an even better job). Removing
email and returning to slower forms of
asynchronous communication (as well as all
the classical synchronous ones) produces a
significant decrease in performance.
Meetings, which are often criticized and/or
abused, play a key role. There seems to exist
an “optimal meeting rate”, too few meetings
represents missed opportunities, while too
many places a burden on the time that is left
open to do actual work. Obviously, but this is
worth repeating, this simulation places no
value on the creative and collaborative
opportunities that a meeting represents. It
simply evaluates meetings as one possible
form of communication.
Since these preliminary findings raise a lot of
questions, it became necessary to transform our
simulation platform into a “white box” (see the
following “perspectives” discussion).
4.2 Lean Management of Business
Processes
Before giving a second example of using BPEM to
investigate the benefits of lean management of
business processes, it is important to state that there
is much more in lean management than control
strategy. The part of lean management (Liker, 2001)
that we are able to address is only a tiny fraction of
what may be described as a work philosophy
(ranging from human resource principles, routines,
learning, to control, visual management, etc.). This
being said, one of the intriguing principles of lean
management is to “reduce the lead time” (the time it
takes to execute a process instance) to its minimal
value. Using the BPEM model, it is easy to contrast
two situations:
A “regular situation”, where most resources
are optimized in such a way that their “usage
ratio” is close to 90%. This is what most
people consider to be a well-run company. In
the world of Information Systems, it is also a
desirable goal to demonstrate a high usage
ratio which shows that critical assets are
delivering as much value as possible.
A “lean situation”, where the SLA are much
tighter (the allowed completion time is closer
to the optimal lead time), which requires more
resources. A “lean organization” is less
intuitive, since it keeps operating critical
resources at lower “usage ratio”. In this
experiment, the level of resource availability
(e.g. staffing level if we consider people) is
determined through simulation so that we
achieve the same level of SLA satisfaction
(say, 98%) in both cases. Obviously, finding
the optimal SLA satisfaction level is business-
dependant (each 1% gained brings incremental
value – cf. our value model in Section 3.3 –
but at a cost since more resources are
required).
We have made a number of computing
experiments, using both the afore-mentioned
simulation platform, as well as the simulation tool
described in (Caseau, 2005). Being able to use one
or the other is the consequence of the fact that
BPEM includes a generic BP evaluation model
(hence it is a useful tool to evaluate BPM – business
process management – strategies).
What we did is what was described earlier in the
paper: we subjected both “companies” (i.e., BPEM
instances) to different types of load: irregular, burst
of different kinds, as well as a “failure” scenario
when one resource is temporarily unavailable. The
following table indicates the results that we have
obtained in both cases (the result is the time
percentage when the SLA are met). The interesting
conclusion is that a BPEM model is able to
demonstrate in a spectacular way the reactivity and
adaptability benefits that have been claimed by
proponents of lean management. Somehow, this is
counter-intuitive since the “lean SLAs” are much
tighter (hence, one could think that they are harder
to keep)
Table 1: SLA satisfaction in lean/non-lean cases.
Scenario Non-lean Lean setting
Default 98% 98%
Irregular 84% 97%
Burst 80% 96%
Failure 78% 87%
4.3 Impact of Organizational
Dimensions onto Performance
A third application of BPEM comes from the ability
to evaluate the impact of organizational features on
performance. A similar warning may be given to the
one about lean management: the impact of
organizational architecture on performance comes
from more than the structural dimension of
management, which is one of four in (Bolman and
ICORES 2012 - 1st International Conference on Operations Research and Enterprise Systems
18

Deal, 1991). However, a BPEM model of a company
makes it easy to play with organizational parameters
and see the effects of the following:
Flattening the hierarchical pyramid. This is
common advice amongst management
consultant, and computer simulation agrees
with them. For a complete discussion of the
impact of the span of control see (Perrow,
1986). Simulation shows that reducing the
depth shortens the communication paths and
increases the reactivity. This actually implies
that the hierarchical management
communication channel plays an important
role.
Increasing or decreasing the number of
managers. Simulation shows that managers
play a key role in passing the necessary
information around, which is precisely what
the quote from March & Simon said. A
consequence is that, when the hierarchy is
flattened, the number of “transverse
managers”, attached to projects or processes,
should be increased.
Specialization, defining many capabilities and
skills. Another interesting factor of the BPEM
model is that we may decide the level of
granularity with which skills are defined. The
same company may be described with the use
of a handful of capabilities, or with a much
more detailed analysis. Depending on the
communication load hypothesis (remember
that the amount of communication flow units
that are generated for each process is governed
by a parameter), we may observe the “cost of
specialization” and see that over-segmenting
creates a communication burden that washes
away the “benefits of specialization”.
These results are not generic (they are dependent on
the BPEM company configuration) but they
illustrate the claim made in Section 2 that BPEM is
capable of supporting management science analyses.
5 PERSPECTIVES
The software platform that was mentioned in Section
4.1 is called SIFOA (Simulation of Information
Flows and Organizational Architecture). The first
generation of the SIFOA simulation software was
able to produce interesting results (cf. previous
section) but its “black box” design made it very
difficult to communicate and explain these results.
Our goal is to build a “white box” version of this
“management simulation toolbox”. Making BPEM a
self-explanatory Enterprise Model is part of this
endeavor. The next step is to release the source code
that implements BPEM. The scheduler which we
mentioned in Section 4.1 is a key component since it
supports the investigation of various queuing
disciplines (Caseau, 2005), different type of flow
priorization and WIP constraints, such as kanban
(Reinertsen, 2009). Because of its stochastic request
model, BPEM is a suitable tool to explore all these
aspects of business process flow performance.
The communication model that we have used a
few years ago is quite simple (a few equations for
each communication channel) and raises many
questions. A follow-up project has been the study of
the influence of social networks (the underlying
structure of the communication channels) on
performance. For instance, we consider the
efficiency of meetings as a communication channel.
Meetings define an affiliation network (Wasserman
and Faust, 1994), the structure of which has a direct
influence on communication characteristics such as
latency, bandwidth, and loss (Nardi, 2005). Our
approach is to generate random graphs that represent
communication needs, and study which patterns of
meeting does a better job of handling these
communications. Our computational model is thus
composed of three parts: a random graph generator
(which is tuned to generate graphs with the
appropriate characteristics, since quite a few
characteristics of social networks are known), a “set-
coverage algorithm” which covers edges with hyper-
edges, and a simulation tool that measures
communication performance. Using this
computational model, we were able to characterize
latency (a useful finding for the simpler model of
4.1) and establish a few rules about the optimal
structure of a “set of meetings” (Caseau, 2011). A
next step is to use BPEM to generate communication
requests that reflect more closely the needs of a
company.
6 CONCLUSIONS
The contribution of this paper is an ongoing
computational model of the enterprise. By
construction, such a model is an open-ended
proposal, but we have found that BPEM is a reliable
and powerful core for many computational projects
that aim at shedding light on management science
issues. The conclusion of this work is threefold:
There is a need for generic enterprise models
to bridge the fields of Operations Research
and Management Science. These models also
BUSINESS PROCESS ENTERPRISE MODEL - Operations Research for Managing Business Process Communication and
Performance
19

play a key role for Information Systems
(Winosky and Vogel, 2004). They provide a
foundation to lay out what Information
Systems are expected to do.
Among those, we need computational models,
with complete operational semantics. Our
claim is that many of management sciences
issues are complex and will benefit from the
kind of analysis that one may perform through
simulation. As it was said in the introduction,
no such problems may be “solved” using a
computer model (each company is different
and too many critical factors are left aside in
such a model), but our experience shows that
insights may be gained about the role of the
structure of organization (Nadler, Gerstein and
Shaw, 1992).
Managing information flows is a key part of
management science. This is an old idea
(March and Simon, 1993), but which strength
has increased in the 21
st
century, with the
increase of information overload and the
advent of the “Enterprise 2.0”.
Such a model may also be used for training
managers, using a “serious game” software
approach, both within the enterprise itself and in a
management school setting.
REFERENCES
Bolman, L. G., Deal, T. E.,1991. Modern Approaches to
Understanding and Managing Organizations. Jossey
Bass.
Bonnet, P., Detavernier J.-M., Vauquier, D., 2009.
Sustainable IT Architecture. ISTE, Wiley.
Burlton, R. T., 2001. Business Process Management.
Sams, Indianapolis.
Caseau, Y., Silverstein, G., Laburthe, F., 2001. Learning
Hybrid Algorithms for Vehicle Routing Problems.
TPLP 1(6): p. 779-806.
Caseau, Y., 2005. Self-adaptive middleware: Supporting
business process priorities and service level
agreements. Advanced Engineering Informatics 19(3):
p. 199-211.
Caseau, Y., 2011. Efficiency of Meetings as a
Communication Channel: A Social Network Analysis.
Submitted to EJOR, Proc. of 2011 ROADEF
Conference (St-Etienne).
CEISAR, 2008. Enterprise Modeling – A White Paper,
www.ceisar.org.
Chrissis M. B., Konrad M., Schrum S., 2003. CMMI –
Guidelines for Process Integration and Product
Improvement. Addison-Wesley, 2003
Club des Pilotes de Processus, 2008. Processus, la voie de
la performance. Hermes, Lavoisier.
Conway. M. E., 1968. How do Committees Invent?
Datamation magazine, n° 14, p. 28-31.
Datar M. M., 2000. Enterprise Simulation: framework for
a strategic application. Proc. of the 2000 Winter
Simulation Conference (WSC’00).
Gabarro, J., ed., 2005. Managing People and
Organizations. Harvard Business Review Press.
Galbraith, J., 1998. Designing Organizations. Jossey-Bass,
Wiley.
Liker, J. K., 2004. The Toyota Way, Mc Graw Hill.
Ludwig, M., Farcet, N., 2010. Evaluating Enterprise
Architecture through Executable Models. In 15
th
ICCRTS – International Command and Control
Research and Technology Symposium.
March, J., Simon, H., 1993. Organizations. Second
edition, Blackwell Business, Cambridge.
Mintzberg, H., 2009. Managing. Berett-Koehler
Publishers, San Franciso.
MODAF, 2008. MODAF Meta-Model, Ministery of
Defense Architecture Framework, http://www.mod.uk/
DefenceInternet/AboutDefence/CorporatePublications/
InformationManagement/MODAF/ModafMetaModel.
htm
Nadler, D., Gerstein, M., Shaw, R., 1992. Organisational
Architecture, Jossey Bass (Wiley).
Nardi, B., 2005. Beyond Bandwidth: Dimensions of
Connection in Interpersonal Communication. Journal
of Computational Supported Cooperative Work, n°14.
Nelson, R. Winter S., 1982. An Evolutionary Theory of
Economic Change. Belknap Harvard.
Perrow, C., 1986. Complex Organizations – A Critical
Essay. Mc Graw-Hill.
Porter, M., 1980. Competitive Strategy – Techniques for
Analyzing Industries and Competitors. The Free Press,
New York.
Nonaka I., Toyama R., Hirata T., 2008. Managing Flow –
A Process Theory of the Knowledge-Based Firm.
Palgrave MacMillan.
Reinertsen, D., 2009. The principles of product
development flow, Celeritas Publishing.
Shafritz, J. M., Ott, J. S., 2001. Classics of Organisation
Theory. Wadsworth.
van der Linden, F., Bosch, J., Kamsties, E., Känsälä, K.,
Obbink., H., 2004. Software Product Family
Evaluation, in On the Development of Software
Product-Family Components, SPLC, Springer-verlag,
p. 110-129.
Wasserman, S., Faust, K., 1994. Social Network Analysis:
Methods and Applications. Cambridge University
Press.
Womack, J., Jones, D., Root, D., 1990. The Machine that
changed the world – The story of lean production,
Free Press.
Wisnosky, D. E., Vogel, J., 2004. Dodaf Wizdom: a
Practical Guide to Planning, Managing and Executing
Projects to Build Enterprise Architectures using the
Department of Defense Architecture Framework,
Wizdom Systems (2004)
ICORES 2012 - 1st International Conference on Operations Research and Enterprise Systems
20
