LEARNING A VISUAL ATTENTION MODEL FOR ADAPTIVE
FAST-FORWARD IN VIDEO SURVEILLANCE
Benjamin H
¨
oferlin
1
, Hermann Pfl
¨
uger
1
, Markus H
¨
oferlin
2
, Gunther Heidemann
3
and Daniel
Weiskopf
2
1
Intelligent Systems Group, University of Stuttgart, Stuttgart, Germany
2
Visualization Research Center, University of Stuttgart, Stuttgart, Germany
3
Computer Vision Group, Institute of Cognitive Science, University of Osnabr
¨
uck, Osnabr
¨
uck, Germany
Keywords:
Visual attention, Adaptive fast-forward, Video surveillance.
Abstract:
The focus of visual attention is guided by salient signals in the peripheral field of view (bottom-up) as well
as by the relevance feedback of a semantic model (top-down). As a result, humans are able to evaluate new
situations very fast, with only a view numbers of fixations. In this paper, we present a learned model for the
fast prediction of visual attention in video. We consider bottom-up and memory-less top-down mechanisms
of visual attention guidance, and apply the model to video playback-speed adaption. The presented visual
attention model is based on rectangle features that are fast to compute and capable of describing the known
mechanisms of bottom-up processing, such as motion, contrast, color, symmetry, and others as well as top-
down cues, such as face and person detectors. We show that the visual attention model outperforms other
recent methods in adaption of video playback-speed.
1 INTRODUCTION
In video surveillance, operators are faced with huge
amounts of surveillance footage. Due to unreliable
automated video analysis, a common strategy to an-
alyze surveillance videos is to watch the entire se-
quence (H
¨
oferlin et al., 2011). To save time, opera-
tors often accelerate the playback speed of the video.
However, a typical property of surveillance footage
is the nonuniform distribution of activity: busy pe-
riods alternate with idle periods. Since regular fast-
forward plays the whole video at constant pace, op-
erators are overburden during busy periods and bored
during periods with no activity. A solution to allevi-
ate this problem is to adapt the video playback speed
according to the relevance of each frame: adaptive
fast-forward. For video surveillance, two relevance
measures are suggested in literature to evaluate the
video content. (Peker and Divakaran, 2004) adapt
the playback speed with respect to the motion and
visual complexity present in a frame. In contrast to
them, (H
¨
oferlin et al., 2011) measure the information
gain (in terms of Shannon’s information theory) be-
tween two successive frames by means of the sym-
metric R
´
enyi divergence. Other adaptive fast-forward
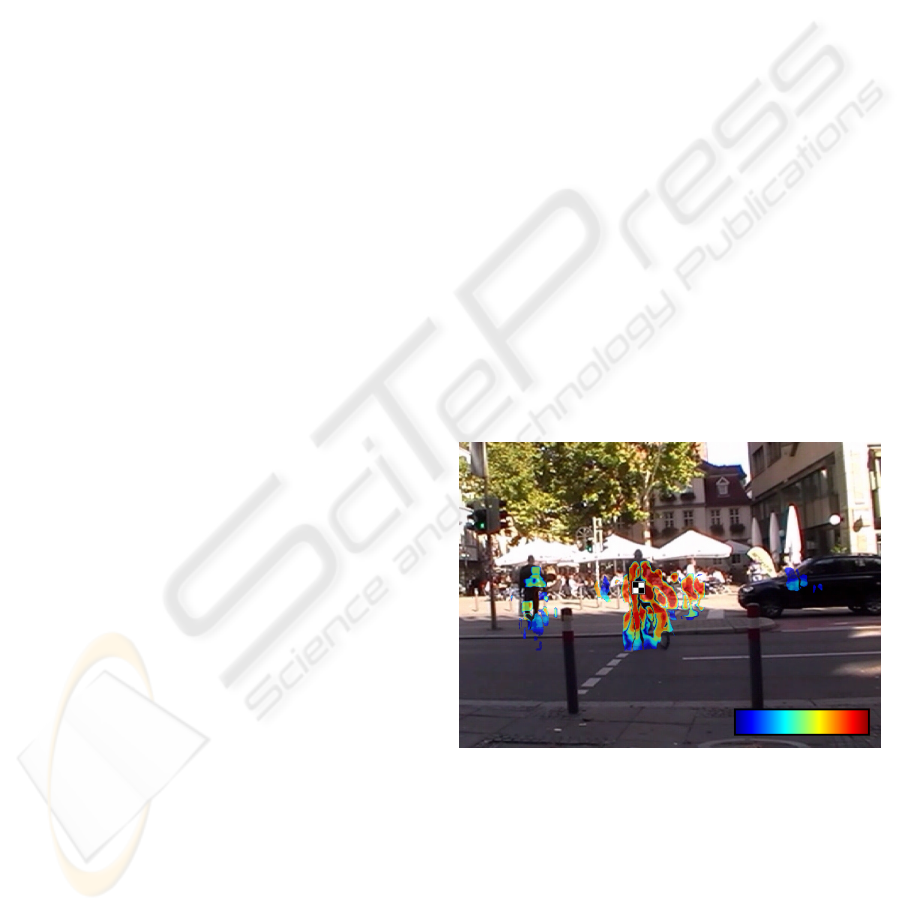
Figure 1: Saliency map calculated by the presented ap-
proach. Salient regions are illustrated by a color-coded
overlay from blue (low saliency) to red (high saliency). The
predicted fixation regions are compared to a real fixation
(black/white box) recorded by an eye-tracker.
approaches (Petrovic et al., 2005; Cheng et al., 2009)
are not adequate to surveillance applications because
they utilize features (similarity to a target clip (Petro-
vic et al., 2005), manually defined semantic rules, and
former playback preferences (Cheng et al., 2009)) that
are not available in this context.
25
Höferlin B., Pflüger H., Höferlin M., Heidemann G. and Weiskopf D. (2012).
LEARNING A VISUAL ATTENTION MODEL FOR ADAPTIVE FAST-FORWARD IN VIDEO SURVEILLANCE.
In Proceedings of the 1st International Conference on Pattern Recognition Applications and Methods, pages 25-32
DOI: 10.5220/0003720000250032
Copyright
c
SciTePress

In this paper, we introduce a novel visual attention
model learned from fixation data captured by an eye-
tracker. Based on this model, we predict the parts of
surveillance videos that are likely to attract visual at-
tention. Example prediction results for a single frame
are depicted in Figure 1. We use these predictions to
adapt the playback velocity of surveillance videos ac-
cording to the visual saliency of the frames. Uninter-
esting parts are accelerated while periods that show
high visual saliency are presented in slow-motion.
Hence, the time required for analyzing a sequence as
well as boredom are reduced while operators can keep
track of relevant activities.
1.1 Visual Attention Models
The guided search model by (Wolfe, 1994) claims that
attention is guided exogenous (i.e., based on the prop-
erties of visual stimuli; bottom-up) as well as endoge-
nous (i.e., based on the demands of the observer; top-
down). (Jasso and Triesch, 2007) explain in more de-
tail that “bottom-up mechanisms are frequently char-
acterized as automatic, reflexive, and fast, requiring
only a comparatively simple analysis of the visual
scene, top-down mechanisms are thought of as more
voluntary and slow, requiring more complex infer-
ences or the use of memory”. According to Wolfe,
early vision stages separate the visual stimuli into dif-
ferent feature maps. Each feature map contains a dif-
ferent feature channel, such as color, orientation, mo-
tion, or size. The feature maps are combined by a
weighted sum into a single activation map, where the
bottom-up activation represents a measure of how un-
usual a feature is compared to its vicinity (for each
feature map). In contrast, the top-down activation
emphasizes the features in which the subject is inter-
ested in (e.g., request for blue objects). The activa-
tion map determines which location receives attention
(winner-take-all mechanism) and in which order: first
the global maximum, then the second maximum, and
so on (inhibition-of-return). The bottom-up activation
does neither depend on the knowledge of the user nor
on the search task.
Different visual attention models were developed
to estimate the areas that attract attention. Most of
these models are based on the bottom-up cues (Itti
and Koch, 2001). One issue concerning such models
is that these “saliency models do not accurately pre-
dict human fixations” (Judd et al., 2009). Therefore,
learned models were proposed. For instance, (Judd
et al., 2009) utilize a linear support vector machine
to train a model of visual saliency including low-level
(e.g., intensity, orientation, color contrast), mid-level
(horizon line detector), and high-level features (face
detector, people detector) to combine bottom-up sig-
nal cues and semantic top-down cues.
(Itti, 2005) presents an approach to calculate
bottom-up saliency of video data. He collects eye-
tracking data of subjects, and creates saliency maps
using a computational model that considers low-level
features. He further identifies that motion and tem-
poral features are more important than color, in-
tensity, and orientation. However, the best predic-
tions are achieved by a combination of all these fea-
tures. (Davis et al., 2007) train a focus-of-attention
model to create pathways for PTZ (pan/tilt/zoom)
cameras. Their model utilizes a single feature, trans-
lating motion, to capture the amount of activity.
(Kienzle et al., 2007) train a feed-forward neural
net with sigmoid basis functions. In their approach,
the video is smoothed spatially and filtered tempo-
rally. Training of the neural net optimizes the tem-
poral filters together with their weights. Another ap-
proach (Nataraju et al., 2009) combines a modified
version of Kienzle’s method with the visual attention
model of (Itti et al., 1998), which is based on saliency
maps. This approach uses a neural net to train the co-
efficients of three low-level descriptors (color inten-
sity, orientation, and motion).
In contrast to the above mentioned methods, the
model we introduce in this paper is not restricted
to a single feature/channel (Kienzle et al., 2007), a
saliency map from a single feature/channel (Davis
et al., 2007), or a set of predefined channels (Nataraju
et al., 2009). Our learning approach is based on tem-
poral and spatial rectangle features and can thus rep-
resent rather arbitrary channels, such as lightness con-
trast, color contrast, motion, orientation, and symme-
try. This means, we do not require manually modeled
channels, we learn the bottom-up cues from train-
ing data. Further, the contribution of each feature to
the final saliency map is determined by the training
process. Hence, two important issues with channel-
based saliency maps are addressed: the selection of
features as well as their weights. Note that our ap-
proach also covers top-down mechanisms, such as the
cues learned by (Judd et al., 2009): face and peo-
ple detectors. Such high-level features are implic-
itly learned by our method. However, our approach
does not consider the top-down mechanisms originat-
ing from memory effects.
The main contribution of this paper is the indica-
tion that visual attention (modeled by a classifier that
is trained on eye-tracking data) is an excellent mea-
sure of relevance for adaptive video fast-forward. Fur-
ther, we introduce a novel method to learn a visual at-
tention model and show that this model is able to pro-
vide proper relevance feedback for surveillance video
ICPRAM 2012 - International Conference on Pattern Recognition Applications and Methods
26

Video
Data
Eye-tracker
Fixations
Rectangle
Feature
Responses
Training
Examples
Trained Visual
Attention Model
(a)
Video
Data
Attention
Model
Potential
Fixations
Rectangle
Feature
Responses
(b)
Figure 2: Schematic workflow of the training (a) and appli-
cation (b) of our visual attention model. Arrows with solid
lines show the workflow; the dashed line depicts the depen-
dency between video and eye-tracking data.
data. Our experiments point out that the method in-
troduced in this paper outperforms all other methods
for playback-speed adaption in surveillance context.
We show that our approach is robust to noise and that
it is the only method that can cope with a combination
of noise and low contrast (Section 3).
2 VISUAL ATTENTION MODEL
Our visual attention model mainly covers the bottom-
up guidance of fixations, since we train it on the signal
characteristics of real fixation points. We therefore
call it memory-less, since it does only depend on the
actual signal, but not on its history. This contrasts the
memory-driven top-down guidance of visual attention
of the human visual system. Hence, neither com-
plex actions nor recall of objects could be explained
by the presented model. However, this model is not
completely free from top-down mechanisms, since
the training data may also contain fixations guided
by semantic meaningful objects. We do not distin-
guish between the original mechanisms (bottom-up
or top-down) of the fixation data and are only con-
cerned about their signal characteristics. Hence, fix-
ations stemming from top-down guidance will affect
our attention model. Examples of this issue are the
facial regions included in the video data. Since faces
are important in the context of video surveillance, the
participants in our eye-tracker study sometimes fo-
cus on these regions during the collection of fixation
data. These fixations do probably not stem from sig-
nal characteristics that attract attention, but from top-
down mechanisms that suggest the semantic relevance
of those regions. Thus, the attention model we train
is to some extent also an object (or face) detector and
responds to signal patterns of typical top-down mech-
anisms.
Figure 3: Cascade of three classifiers. Each classifier con-
sists of multiple weak classifiers selected by Adaboost. The
arrows depict the processing path of tested search windows.
Based on the video footage and the recorded fix-
ation data, we create a discriminative visual attention
model that consists of a cascade of classifiers. Fig-
ure 2 depicts the basic workflow of training and ap-
plication of our visual attention model. Each classifier
consists of a set of rectangle features (cf. Figure 4) se-
lected by Adaboost (Viola and Jones, 2001). The cas-
cade of boosted rectangle features became very pop-
ular for object detection, after it was successfully ap-
plied to face detection by (Viola and Jones, 2001). In
particular, this approach is known for its fast compu-
tation utilizing an acceleration structure called inte-
gral image as well as cascaded classifiers with gradu-
ally increasing complexity. Classifiers at the begin-
ning of the cascade are kept simple. Their goal is
to inexpensively reduce the large amount of sliding
windows that do not contain the searched object cate-
gory, while preserving all windows with potential de-
tections for the subsequent, more complex classifiers.
Figure 3 displays such a cascade of classifiers. The
decision H on the membership of a windowed video
signal I
w
to a particular class (fixation point or not) is
calculated by each classifier using the sign-function
of a weighted linear combination of N (thresholded)
rectangle feature responses r
n
and a bias b:
H(I
w
) = sign
N
∑
n=1
α
n
r
n
(I
w
) + b
!
(1)
Training of a single classifier includes the selec-
tion of the appropriate rectangle features and their ac-
cording weights α. These features are selected by
Adaboost from a set of potential weak classifiers,
i.e., rectangle features with a threshold. The types
of available rectangle features were chosen carefully
with respect to the causal mechanisms that are known
to attract the visual attention of humans. By com-
bining these features (main types are depicted in Fig-
ure 4), our model is able to represent more complex
signal characteristics, such as lightness contrast, color
LEARNING A VISUAL ATTENTION MODEL FOR ADAPTIVE FAST-FORWARD IN VIDEO SURVEILLANCE
27

t t
t
Figure 4: Basic types of rectangle features used to train the
visual attention model. First row: spatial edge detectors.
Second row: spatial ridge detectors. Third row: Tempo-
ral difference operator and spatio-temporal edge detectors.
For visualization purposes, temporal rectangle features are
depicted semi-transparent. Diagonal variants of the spatio-
temporal edge detectors are not depicted, but used. Weak
classifiers are created by thresholding nonuniformly scaled
and translated instances (in all two/three dimensions) of
these features. Features are calculated on the three dimen-
sions of the CIE L*a*b* color space to incorporate color
and lightness contrast.
contrast, motion, orientation, and symmetry. These
signal characteristics represent the major cues for at-
tention guidance according to (Itti, 2005) and (Wolfe,
1994). This means, our approach includes the typi-
cal categorical channels of bottom-up attention mod-
els based on saliency maps. However, it further solves
the problem of selecting the individual weights of
each channel by learning their contribution with re-
spect to a particular class of stimuli (e.g., surveillance
footage). Other approaches often require manual as-
signment of those weights. Further, our approach is
capable of learning particular “channels” that have
not been defined beforehand. While manually defined
saliency operators need an exact definition of such
channels, our method only requires a set of features
that is able to cover these bottom-up cues. In this way,
additional channels that are not explicitly mentioned
here are learned from the data.
2.1 Fixation Data
To obtain examples required to train the visual at-
tention model, we rely on fixation data from eye-
tracking. We uses a Tobii T60 XL eye-tracker to
record overt visual attention when free-viewing dif-
ferent stimuli. The training and test videos show out-
door environments at daytime and with continuous
activity of pedestrians and/or cars, which are typical
for video surveillance. Details of these video stimuli
are listed in Table 1. We recorded eye-gaze data of 9
subjects for these videos. Fixations were filtered with
the ClearView fixation filter using a velocity thresh-
old of 20 px/ms and a duration threshold of 30 ms.
Figure 5: Performance of the visual attention model with
respect to different threshold adaption values. In this ex-
periment, the maximum shows a fixation prediction perfor-
mance that is about 27 times above chance.
Outliers beyond the media borders were removed.
Further, we excluded top-down-triggered fixations at
points in the image that provide a good overview over
the scene. These points (anchors) were frequently
focused although no salient objects or actions were
present. After further inquiry of the participants of
the eye-tracker study, such anchor points could be
identified to be mainly affected by top-down mecha-
nisms employing knowledge, learned by watching the
scene: at these strategic points, changes in the video
were easily observed by peripheral vision. After fil-
tering, in total 36717 fixations were left.
For the experiments, we use 70% of the fixa-
tion data for the training of the model, and the re-
maining 30% for analysis. The data is segmented
in blocks of about 50 successive fixation points and
the blocks selected for training/analysis are chosen
equally distributed from the video. Positive examples
are created using squared patches of 20 px, 40 px,
80 px, and 160 px side-length around the recorded
fixation points. Negative training examples are gen-
erated with the same patch sizes at randomly (equally
distributed) sampled positions in the video, but not
within a spatio-temporal suppression radius around
the fixations. All points within a weighted Euclidean
distance of
d(P, N) =
q
dx
2
+ dy
2
+ (α dt)
2
of less than 50 from a positive training example P are
ignored in the selection of the negative training exam-
ple N. Here, dx, dy, dt are the distances of the respec-
tive space and time dimensions (dx, dy measured in
integer number of pixels, dt measured in integer num-
ber of time frames). A suitable value for the weight α
was determined experimentally. For all evaluation re-
sults, we use α = 10. The rationale behind the spatio-
temporal suppression radius is to minimize the con-
fusion between positive and negative examples by ac-
counting for similar signal characteristics in the vicin-
ity of fixations and for inaccuracy in the eye-tracking
process.
ICPRAM 2012 - International Conference on Pattern Recognition Applications and Methods
28
Table 1: Different stimuli (progressive video footage) used to record fixation data.
Stimulus
Duration
[frames/fps]
Resolution
[pixels]
Compression Example frame
S1 15825/25 1024×576
Microsoft
Video 1
(CRAM)
S2 15105/25 1024×576
Microsoft
Video 1
(CRAM)
S3 15105/25 1024×576
Microsoft
Video 1
(CRAM)
Intersection
1
1355/25
640×480
(up-scaled)
Packed
YUV4:2:2
(YUY2)
However, there is no guarantee that a selected neg-
ative training example shows other signal characteris-
tics than a positive example. It is also possible that a
negative training example is a potential fixation point,
but that it was not captured as such during the record-
ing process, since too few samples were drawn from
the distribution of fixations. This leads to bad lin-
ear separability of the training set. Hence, predefined
classification goals as usually used for boosting (e.g.,
detection rate: 99% ; false positive rate: 30% as in
(Viola and Jones, 2001)) and cascade construction are
often not met. Therefore, we use a predefined number
of classifiers with a predefined number of features per
classifier for the training of the visual attention model,
similar to (Zhao and Koch, 2011). All constants were
determined empirically.
Finally, we adapt the thresholds b (cf. Eq. 1) of all
classifiers. This step has direct influence on the area
marked as potential fixation area by the learned visual
attention model. Relaxation of the threshold leads to a
generalization of the model and to more potential fix-
ations, whereas increasing the threshold will reduce
their amount. The adaption of the classifiers’ thresh-
olds is similar to the definition of a threshold for bi-
narization of a saliency or activation map. Indeed, the
trained focus-of-attention classifier can be regarded to
maintain an intrinsic saliency map binarized accord-
ing to the classifiers’ thresholds. The saliency map
depicted in Figure 1 is computed this way, by stacking
several detection results with decreasing thresholds.
Threshold adaption is further used in Section 3 to
steer the playback-speed acceleration of adaptive fast-
forward. We determine the optimal threshold adap-
tion by applying gradient search on the NSS (normal-
ized scanpath saliency) target function. Experiments
suggest that this function shows almost concave be-
havior (see Figure 5) and, thus, can be optimized by
gradient ascent with simulated annealing.
According to (Peters and Itti, 2007), NSS is de-
fined as
NSS =
1
σ
M
(M(x, y) − µ
M
) (2)
where (x, y) denotes the location of a recorded fixa-
tion and M represents the fixation map calculated by
our visual attention model with the standard deviation
σ
M
and the mean µ
M
.
2.2 Importance of Bottom-up Channels
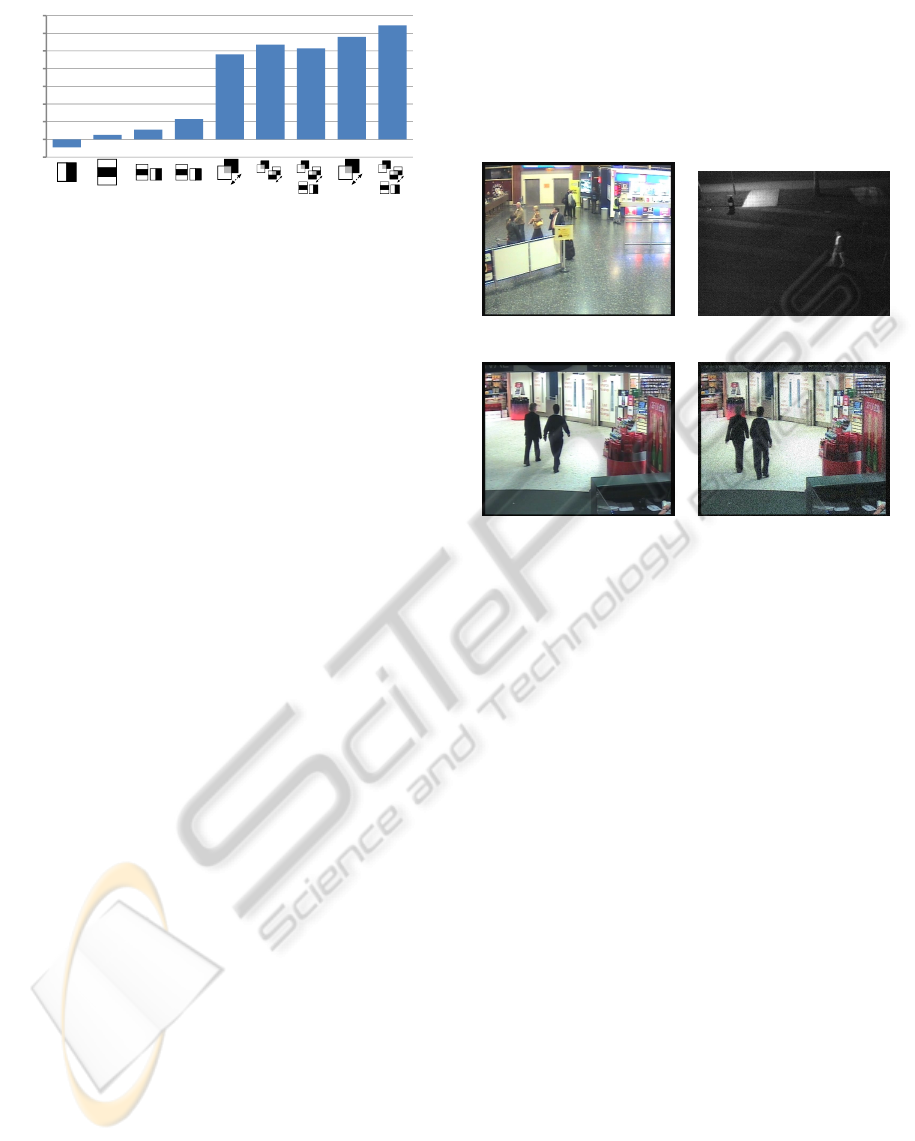
The experiment shown in Figure 6 indicates a clear
dependence between the performance of the learned
visual attention model and the set of features used for
selection by Adaboost. The chart illustrates the im-
portance of the particular feature types. For instance,
1
Concatenated videos from the CANDELA project:
www.multitel.be/∼va/candela/intersection.html.
LEARNING A VISUAL ATTENTION MODEL FOR ADAPTIVE FAST-FORWARD IN VIDEO SURVEILLANCE
29
L*a*b*
t
t
t
L*a*b*
t t
L*a*b*
Figure 6: Performance of visual attention models trained
with different sets of features. The principal type of features
used in each experiment is depicted as surrogate beyond the
particular bar. Rotational variants of the principal types are
included in the training set. If features are calculated on all
three color channels, the bar is labeled by L*a*b*, other-
wise features are only calculated for the lightness channel.
a model that includes only simple edge/contrast de-
tectors is not useful for the prediction of fixations
in video. In the experiment, such a model is even
worse than chance. Temporal features that describe
the change of the lightness channel are most effi-
cient. However, a combination of all features includ-
ing color information shows best performance. These
observations are consistent with the results of (Itti,
2005). Further, we find that the fraction of spatial
features (56%) selected by Adaboost is slightly higher
than the fraction of (spatio-)temporal features (44%).
Feature selection by Adaboost further indicates that
lightness (47%) and red/green opponent (35%) chan-
nels provide stronger cues than the yellow/blue chan-
nels (18%).
3 ADAPTIVE FAST-FORWARD
We apply the learned visual attention model to adap-
tive video fast-forward by calculating the area cov-
ered by potential fixation points as measure of a
frame’s relevance. The visual attention model we use
in this experiment was trained on a heterogeneous
video dataset different from the test dataset. The train-
ing dataset consists of 4 videos with different resolu-
tion, duration, and encoding (cf. Table 1). Addition-
ally, perspective and captured objects vary from video
to video. Hence, this experiment also indicates that
the playback speed adaption using the presented vi-
sual attention model is to some extent insensitive to a
specific training dataset. To improve robustness, we
use fixations recorded from multiple subjects. The ra-
tio of positive to negative examples was chosen 3:4,
since experiments indicated slightly improved perfor-
mance when more negative examples are used than
positive examples.
We compare the performance of our method with
the results of other relevance measures, such as mo-
tion activity (Peker and Divakaran, 2004) and R
´
enyi
divergence (H
¨
oferlin et al., 2011). The relevance
feedback of these three methods calculated on the 4
video clips used in the user study of (H
¨
oferlin et al.,
2011) is depicted in Figures 8 and 9.
Crowded Airport. Night.
Airport. Noisy Airport.
Figure 7: Example frames of the video sequences used for
adaptive fast-forward experiments.
Three of the videos, termed Crowded Airport, Air-
port, and Noisy Airport, originate from the i-LIDS
multi-camera tracking scenario. They are encoded
with the Motion JPEG Video (MJPA) codec at a res-
olution of 720×576 px, and 25 fps. The Noisy Air-
port sequence is a version of the Airport sequence
with added Gaussian noise. The Night sequence is an
uncompressed monochrome video that was captured
at night with a resolution of 656×494 px and 15 fps.
The sequence includes regions with low contrast and
dominant noise from high gain settings. Example
frames of the videos are depicted in Figure 7. The
results of the motion activity and R
´
enyi divergence
can be roughly summarized as follows (H
¨
oferlin et al.,
2011):
• Motion activity and R
´
enyi divergence perform
well on Crowded Airport and Airport sequences.
• Motion activity fails to adapt the playback veloc-
ity of the Noisy Airport sequence, whereas R
´
enyi
divergence can cope with noise.
• Both methods are unable to adapt the playback
speed of the Night sequence due to noise (motion
activity) and low contrast (R
´
enyi divergence).
Our method performs well for all four scenarios
(cf. Figure 8 and 9). Especially, its performance in
periods of no activity is remarkable. In these peri-
ods, the baseline of our method is consistently located
ICPRAM 2012 - International Conference on Pattern Recognition Applications and Methods
30

Figure 8: Relevance feedback of the compared methods
(normalized to an expectation value of 1, i.e., the playback
time of an accelerated sequence is the same for all meth-
ods, only acceleration of particular periods varies) for the
sequences: Crowded Airport (top), Airport (center), and
Noisy Airport (bottom).
close to zero relevance, as it is expected. In contrast
to that, the other methods assign some amount of im-
portance to these periods and especially the R
´
enyi di-
vergence jitters strongly around its baseline. Our vi-
sual attention model is also more robust to noise than
the other methods. In fact, the R
´
enyi divergence is
robust to a certain degree, but a comparison of the
relevance feedback of Airport (Figure 8 (center)) and
Noisy Airport (Figure 8 (bottom)) indicates that our
visual attention model better preserves the relevance
signal under the influence of noise. Further, our ap-
proach is the only method that can cope with the
high noise and low contrast scenario posed by the
Night sequence. Figure 9 points out that only the
visual attention model provides the expected result:
high relevance at periods where people are present in
the scene. Supplementary material that shows direct
comparison of the different methods is available at our
homepage
2
.
4 CONCLUSIONS
We presented a novel method to learn a visual atten-
tion model that covers the main aspects of bottom-up
processing, as well as some memory-less top-down
2
www.vis.uni-stuttgart.de/index.php?id=1351
Figure 9: Relevance feedback of the compared methods
(normalized to an expectation value of 1) for the Night se-
quence. Our visual attention model is the only approach
that identifies relevant movement in this sequence with high
noise and low contrast.
mechanisms. We were able to show that Adaboost is
capable of training an effective model based on a rich
set of rectangle features. In this way, the most impor-
tant bottom-up channels for the attraction of visual
attention were trained and represented by a weighted
set of rectangle features. This model exhibits typical
channel selection known from literature. Further, we
applied our visual attention model to adaptive video
fast-forward. In the evaluation using a dataset known
from other approaches, our method outperforms the
state-of-the-art and shows higher robustness to noise
and low contrast. Future work includes a comprehen-
sive evaluation of our visual attention model with re-
spect to other visual attention models, and the gen-
eralization of the learned model to different stimuli,
tasks, and subjects. Further fields of application of the
visual attention model, such as video compression,
video summarization, and adaptive camera switching
could be considered in future work, too.
ACKNOWLEDGEMENTS
This work was funded by German Research Founda-
tion (DFG) as part of the Priority Program “Scalable
Visual Analytics” (SPP 1335).
REFERENCES
Cheng, K., Luo, S., Chen, B., and Chu, H. (2009). Smart-
player: user-centric video fast-forwarding. In Pro-
ceedings of the International Conference on Human
Factors in Computing Systems (CHI), pages 789–798.
ACM New York.
Davis, J., Morison, A., and Woods, D. (2007). An adaptive
focus-of-attention model for video surveillance and
LEARNING A VISUAL ATTENTION MODEL FOR ADAPTIVE FAST-FORWARD IN VIDEO SURVEILLANCE
31

monitoring. Machine Vision and Applications, 18:41–
64.
H
¨
oferlin, B., H
¨
oferlin, M., Weiskopf, D., and Heidemann,
G. (2011). Information-based adaptive fast-forward
for visual surveillance. Multimedia Tools and Appli-
cations, 55(1):127–150.
Itti, L. (2005). Quantifying the contribution of low-level
saliency to human eye movements in dynamic scenes.
Visual Cognition, 12(6):1093–1123.
Itti, L. and Koch, C. (2001). Computational modelling
of visual attention. Nature Reviews Neuroscience,
2(3):194–203.
Itti, L., Koch, C., and Niebur, E. (1998). A model of
saliency-based visual attention for rapid scene anal-
ysis. IEEE Transactions on Pattern Analysis and Ma-
chine Intelligence, 20(11):1254–1259.
Jasso, H. and Triesch, J. (2007). Learning to attend – from
bottom-up to top-down. In Paletta, L. and Rome, E.,
editors, Attention in Cognitive Systems. Theories and
Systems from an Interdisciplinary Viewpoint, volume
4840 of Lecture Notes in Computer Science, pages
106–122. Springer Berlin / Heidelberg.
Judd, T., Ehinger, K., Durand, F., and Torralba, A. (2009).
Learning to predict where humans look. In Interna-
tional Conference on Computer Vision, pages 2106–
2113. IEEE.
Kienzle, W., Sch
¨
olkopf, B., Wichmann, F., and Franz, M.
(2007). How to find interesting locations in video:
a spatiotemporal interest point detector learned from
human eye movements. In Proceedings of the DAGM
Conference on Pattern Recognition, pages 405–414.
Springer.
Nataraju, S., Balasubramanian, V., and Panchanathan, S.
(2009). Learning attention based saliency in videos
from human eye movements. In Workshop on Motion
and Video Computing (WMVC), pages 1–6. IEEE.
Peker, K. and Divakaran, A. (2004). Adaptive fast
playback-based video skimming using a compressed-
domain visual complexity measure. In International
Conference on Multimedia and Expo, volume 3, pages
2055–2058.
Peters, R. and Itti, L. (2007). Beyond bottom-up: Incorpo-
rating task-dependent influences into a computational
model of spatial attention. In In Proceedings of Com-
puter Vision and Pattern Recognition (CVPR), pages
1–8. IEEE.
Petrovic, N., Jojic, N., and Huang, T. (2005). Adaptive
video fast forward. Multimedia Tools and Applica-
tions, 26(3):327–344.
Viola, P. and Jones, M. J. (2001). Robust real-time object
detection. Technical Report CRL 2001/01, Cambridge
Research Laboratory.
Wolfe, J. (1994). Guided search 2.0 a revised model
of visual search. Psychonomic Bulletin & Review,
1(2):202–238.
Zhao, Q. and Koch, C. (2011). Learning visual saliency. In
In Proceedings of the Annual Conference on Informa-
tion Sciences and Systems (CISS), pages 1–6.
ICPRAM 2012 - International Conference on Pattern Recognition Applications and Methods
32
