
ARTIFICIAL NEURAL NETWORKS APPLIED TO AN AGENT
ACTING IN CDA AUCTIONS IN TAC
Robson G. F. Feitosa
1
, Dalmo D. J. Andrade
2
, Enyo J. T. Gonçalves
3
, Yuri A. Lacerda
1
,
Gustavo A. L. de Campos
2
and Jerffeson T. de Souza
2
1
Instituto Federal de Educação Ciência e Tecnologia do Ceará, Campus Crato (IFCE) – Crato, CE, Brazil
2
Centro de Ciências e Tecnologia, Universidade Estadual do Ceara (UECE), Fortaleza, CE, Brazil
3
Universidade Federal do Ceará (UFC), Campus Quixadá, Quixadá, CE, Brazil
Keywords: Artificial Neural Networks, Continuos Double Auction, Intelligent Agents.
Abstract: This paper describes an approach based on Artificial Neural Networks to estimate the trading price of bids
in CDA auctions in the TAC Classic scenario. To validate the approach, we used some methods to validate
the performances of both the ANN and an agent which uses the approach. By analyzing the results of the
experiments we could prove that such estimation helps improving the agent's performance.
1 INTRODUCTION
E-commerce, or electronic commerce, is an object of
study in the most various communities around the
world. According to (Vytelingum, 2006), the
auctions of Continuous Double Auction (CDA) type
are, presently, the commonest trading mechanisms
adopted in e-commerce. They are widely used by
institutions specialized in buying and selling titles
and goods, e.g., international exchange market and
stock exchange, such as New York Stock Exchange
(NYSE).
Markets such as NYSE trade several goods in
parallel, through simultaneous and independent
auctions. This way, besides the classical problems
found in the CDA trading, such as determining the
amount and values of the goods, the participants of
this market must analyze simultaneously the
evolution of several prices, in detriment of their
preferences, to choose which auctions they must
participate in. However, solving these problems is
not a trivial task.
The forecast of stock prices, options, electric
energy selling price, and other goods negotiated in
CDA markets can be modeled with use of statistical
techniques, intelligent systems or hybrid ones,
involving both of the previous (Melo et al., 2009).
Fuzzy systems (Petridis and Kehagias, 1997) and
ANNs (Ko et al., 2008) (Soares, 2008) are some of
the techniques employed in intelligent and hybrid
systems to support the forecast process in CDA
markets.
The study carried out by (Das et al., 2001)
proved that intelligent agents can overcome the
performance of humans at trading. These agents can
be employed in the simultaneous monitoring of
several markets, in the processing of a large amount
of information and in the execution of complex
calculations almost instantly.
Aiming at the development of high-level
research in trading agents, researchers from
Michigan University developed the TAC (Trading
Agent Competition) environment (Wellman and
Wurman, 1999). TAC is composed by a forum about
the subject of trading agents and a series of annual
tournaments. In addition, it is offered a complete
software infrastructure to the development and
simulation of trading agents, which eases the
generation of knowledge in the area.
TAC Classic is one of the tournaments created
and made available by the TAC forum. On it, agents
play the role of travel agencies whose objective is to
form travel packages according to the costumers'
portfolio. For that, the agents must buy travel goods
(air tickets, hotel rates and entertainment tickets).
Each good is traded in auctions of a certain type,
which occur simultaneously and separately. For
example, entertainment tickets are traded in separate
and simultaneous auctions of the CDA type.
271
G. F. Feitosa R., D. J. Andrade D., J. T. Gonçalves E., A. Lacerda Y., A. L. de Campos G. and T. de Souza J..
ARTIFICIAL NEURAL NETWORKS APPLIED TO AN AGENT ACTING IN CDA AUCTIONS IN TAC.
DOI: 10.5220/0003726302710276
In Proceedings of the 4th International Conference on Agents and Artificial Intelligence (ICAART-2012), pages 271-276
ISBN: 978-989-8425-95-9
Copyright
c
2012 SCITEPRESS (Science and Technology Publications, Lda.)

This paper describes an approach based in
Artificial Neural Networks (ANN) to estimate the
transaction price of CDA auction bids in the TAC
Classic scenario. For that, the work is organized as
follows. Section 2 describes the proposed approach.
Section 3 discusses the analysis of results obtained
through the use of the approach. Finally, Section 4
presents some conclusions and future works.
2 THE APPROACH BASED ON
ARTIFICIAL NEURAL
The approach described herein was conceived
through the implementation of an agent called
LaconiBot, a software agent developed to act in the
TAC Classic environment. In this section we
present: the architecture of the agent; the logic
employed on its forecast component; details on the
implementation of the ANN, as well as its training
and testing methodologies.
Figure 1 shows the main subsystems and
components of the LaconiBot agent (information
processing modules), as well as the information
processed by each subsystem. Among the modules
we have a Shared Knowledge Base, or SKB, which
works as a blackboard memory, where all the
modules can have access to it. So, it is possible to
share in the same data structure, both the
environment status and the agent's internal status, as,
for example: the updated values of the assessments
and other parameters used in the trade strategies, the
return of the solution presented by the Allocator
component and the price estimation calculated by
Predictor.
More specifically, this paper analyzes the
performance of the auction subsystem focused on
buying and selling tickets for entertainment, because
only in this auction type the CDA trading
mechanism is used. Leaving aside such information,
the agent can be described as follows.
By means of the Sensors the agent receives
information from the Environment - buy and sell
prices, besides the number of items which it traded.
The updates occur at each 30 seconds for all the 12
auctions. Right after that, the internal status of the
agent is updated, and the values received from the
Sensors are stored in the SKB. The actions of the
Predictor and the Allocator are executed. The
Predictor checks the pricing data and the elapsed
time of the SBK game. Next, it estimates the
transaction values for the information by means of
its ANN. The allocator, in turn, checks the SBK data
and updates the allocation of the items to be traded
by the Entertainment Strategy. The result of
allocations is stored in the SBK. (Feitosa et al.,
2010) describe the logic behind the Allocator
component in detail. According to the updated status
of the allocations in the SKB, the actions of the
Entertainment Strategy are executed. By means of
the Actuators the agent sends the actions selected by
the Entertainment Strategy for the environment.
Figure 1: LaconiBot architectural model.
The entertainment strategy uses a series of
parameters to determine a new bid. They are: the
buy price of an item in the auction, the sell price for
the same item and a reference price. The reference
prices is intended to give support to the trader's
decision making, supplying a reference to calculate
the deviation of the quoted price with respect to the
transaction value of the item. This way, the more
accurate the estimative of the value of the
transaction, the more accurate will be the decision
made by the controller, meaning a better
performance of the agent.
In this works we used an ANN to estimate the
transaction prices in CDA auctions, taking into
consideration the historical data of the auctions in
which the agent is participating or of auctions which
occurred in previous competitions. Among the
known ANN architectures, we opted for the
Multilayer Perceptron (MLP) Neural Network with
the Backpropagation learning algorithm. More
information about this in (Haykin, 2001).
In order to implement the ANN, we used the
Joone (Java Object Oriented Neural Engine)
framework (Marrone, 2007) (Heaton, 2005). It was
chosen by many reasons. Some of them are: it is
written in Java language and distributed over the
ICAART 2012 - International Conference on Agents and Artificial Intelligence
272

LGPL License, is well documented, has a well-
defined interface for the development of the ANN,
supplies several implemented classes which ease the
training and execution of the Neural Network and,
besides, is approved by the academic community
(Malcangi and Frontini, 2009) (Zhu et al., 2006).
There are several ANN architectures. However,
we opted for using a multilayer architecture. Some
works like (Melo et al., 2009) report the gain in the
performance of the ANN from a more refined choice
of its architecture. For the present work, we chose a
three-layer MLP. The first layer was composed by
three neurons, the internal layer by four neurons and
the output layer with just one neuron to represent the
output value of the network.
We opted for the supervised learning of the
ANN, which needed a training set capable of
representing both the information given as input to
the neural network and the information expected at
the output. Another necessary aspect was a dataset to
test and validate the trained ANN.
According to (Feitosa et al., 2010), TAC supplies
a complete software infrastructure for the
development, execution and analysis of the
performance of agents. This way, we used the TAC
server, some agents made available in the TAC
website, and the methodology, also described in the
same work, to generate the data that will form the
training dataset.
After analyzing the problem, it was possible to
distinguish the most important information to
compose the attributes of the training database of the
ANN. This way, we selected the buy price of the
good; the game time elapsed; the transaction value,
more formally described by the following tuple
=<
,
,,
>.
Where,
= sell price of an item at auction in the
time interval t;
= buy price of an item at auction
in the time interval t; t = elapsed game time;
=
transaction price at a given moment t.
After the execution of 70 games and the
preprocessing of data, it was generated a set with the
total of 1450 examples in the format of 4-tuples. No
separation concerning the types of ticket was made,
that is, new lines were added to a text file to form
the training set. After selecting the attributes and
generating data to form the training set, another
important step in the mining of this data is the
preprocessing. If significant amounts of data
containing noises, faulty, inconsistent or non-
normalized are presented, the ANN will possibly
have a unsatisfactory performance. So, the data
preprocessing occurs with the preparation of the
example values that will be presented to the network
in such a way that it can generalize the training set.
We carried out the following procedures.
As the number of bids that end up in a
transaction is quite smaller than the number of bids
that do not end up in a transaction, we selected only
examples where C
v
>0, C
c
>0 and P
t
>0; for values
concerning the buy and sell prices of some good, as
well as the transaction price, we noticed that: the
prices cannot be smaller than zero, because negative
prices do not exist; and the maximum prices offered
to the entertainment events do not go above 200
monetary units. So, all prices were divided by 200;
and, the calculation of the time unit was made with
basis on total time of the match. Since each match
takes 90 minutes or 540 seconds long, the time
values were divided by 540 to obtain the normalized
data.
For example, analyzing the auction for
amusement park tickets for the third day, if in the
time of 308 seconds of the auction the buy price is
$66 and the sell price is $98 and a transaction was
made by $79, the training set would generate the
following tuple T = <98.0, 66.0, 307, 79.0>. After
preprocessing, the values change to T = <0.49, 0.33,
0.57, 0.39>.
In the present work, the separation of the
examples set was made in 10 parts or instances.
After separation, 90% of data or 9/10 of the parts
were used for training and the remaining 10% for
tests. This set of techniques used for training and test
of the neural network is similar to the n-fold
stratified cross-validation technique, in this case, 10-
fold (Witten and Frank. 2005).
The training of the network by using the
described technique was performed according to the
following stages: with the training set (input and
desired response) already constructed, we separated
it in 10 parts, having in mind the equal
representation of the classes of data in each of the
parts; the parts were regrouped in 10 different
subsets, each one with 90% of the total number of
examples. Notice that for each subset created, one
part does not participate in the training set, making
sure that all the instances remain separated at least
once. The remaining part corresponds to the 10% not
used which were separated for tests; after the
separation, 10 batteries of trainings were performed.
At the end of each training session, the remaining set
will have been tested; the network training occurs
through the repetitive presentation of an example set
called epoch. The number of epochs must be chosen
so that the network result converges to a desired
minimal error. During the training of the ANN, at
each 1000 epochs the order of the values contained
ARTIFICIAL NEURAL NETWORKS APPLIED TO AN AGENT ACTING IN CDA AUCTIONS IN TAC
273
in the training set is randomly altered to minimize
any eventual tendency in the learning process;
finally, we evaluated the efficiency of the forecasts
obtained in the network using the metrics of Root
Average Squared Error (RMSE), Confusion Matrix
and Error Average, as will be described later.
3 ANALYSIS OF RESULTS
This section illustrates the process of analyzing the
results for the training, test and ANN validation
processes, as well as the results related to the gain
obtained by the agent after using the network.
With the objective of validating the training, two
forms of validation were applied. First, we evaluated
the Root Mean Square Error (RMSE) at the output
of the network. Next, we perform the analysis with
confusion matrix and, finally, we calculate the
average error obtained in the network training,
The network implemented in this project was
trained according to the 10-fold method. Hence, 10
error values were generated for each fold. So, for
each stage of network training it is generated an
error estimation, or global RMSE, and it is necessary
to calculate the average of the RMSE values. The
RMSE for each stage is calculated according to the
following equation:
=
∑
(
−
)
(1)
Where N is the number of patterns, a
k
represents
the real value and y
k
represents the expected value.
The generated values, as well as the global average
of the RMSE are shown in Table 1.
Table 1: Values of the RMSE obtained in the training of
the neural network.
Training/Test Stage RMSE RMSE * 100
1
0.03790378821188909 3.790
2
0.03792054262127483 3.792
3
0.03741238428226856 3.741
4
0.03837015819945445 3.837
5
0.0375940506948018 3.759
6
0.03772424081175014 3.772
7
0.037880241856337225 3.788
8
0.03692442292505494 3.692
9
0.037551458993737144 3.755
10
0.036275948189295366 3.627
Global Error 0.03755572367858635 3.755
As we can see in Table 1, the error generated by
the trained stayed around 4%. It is important to
highlight that just the obtainment of the RMSE is not
enough to correctly validate the training of an ANN.
So, we used another metric, illustrated in the next
section.
A confusion matrix has the objective of showing
the number of correctly classified samples for each
class of data, thus it measures the efficiency of the
process under analysis. The confusion matrix used in
this work was adapted to compare values obtained in
test of network with the expected values.
At the construction of the confusion matrix, we
adopted the percentile intervals of 0.26 to 0.30, 0.31
to 0.35 and so on until 0.56 to 0.60. Such intervals
correspond to the normalized transaction values. The
choice of these values is due to the fact that these are
the intervals in which the transaction occurs more
frequently.
The matrix was calculated for the test sets. The
confusion matrix generated for these stages
correspond to the values obtained by the test
network compared with the expected values, shown
in Table 2. We can see the rate of success of the
network in the intervals close to what should be
estimated by the matrix in Table 3.
Table 2: Confusion matrix of the network test with the
percentile of success.
[0.26-
0.30]
[0.31-
0.35]
[0.36-
0.40]
[0.41-
0.45]
[0.46-
0.50]
[0.51-
0.55]
[0.56-
0.60]
[0.26-
0.30]
64.15%
5.71% 0.00% 0.26% 0.00% 2.33% 0.00%
[0.31-
0.35]
29.25%
43.33%
14.35% 2.07% 1.76% 2.33% 0.00%
[0.36-
0.40]
3.77% 43.81%
63.43%
19.69% 12.78% 18.60% 13.64%
[0.41-
0.45]
1.89% 7.14% 22.22%
77.72%
24.23% 25.58% 31.82%
[0.46-
0.50]
0.94% 0.00% 0.00% 0.26%
61.23%
13.95% 9.09%
[0.51-
0.55]
0.08% 0.00% 0.00% 0.00% 0.00%
34.88%
22.73%
[0.56-
0.60]
0.00% 0.00% 0.00% 0.00% 0.00% 2.33%
22.73%
In the presented matrix, the vertical values represent
the real expected data and the horizontal values
represent the data estimated by the network. For
example, analyzing Table 2 in the interval of 0.36 to
0.40, the network was successful in 1241 forecasts,
or 53.03 of the total of forecasts for that interval. To
obtain real price data, just multiply the value by 200
(the inverse path of normalization).
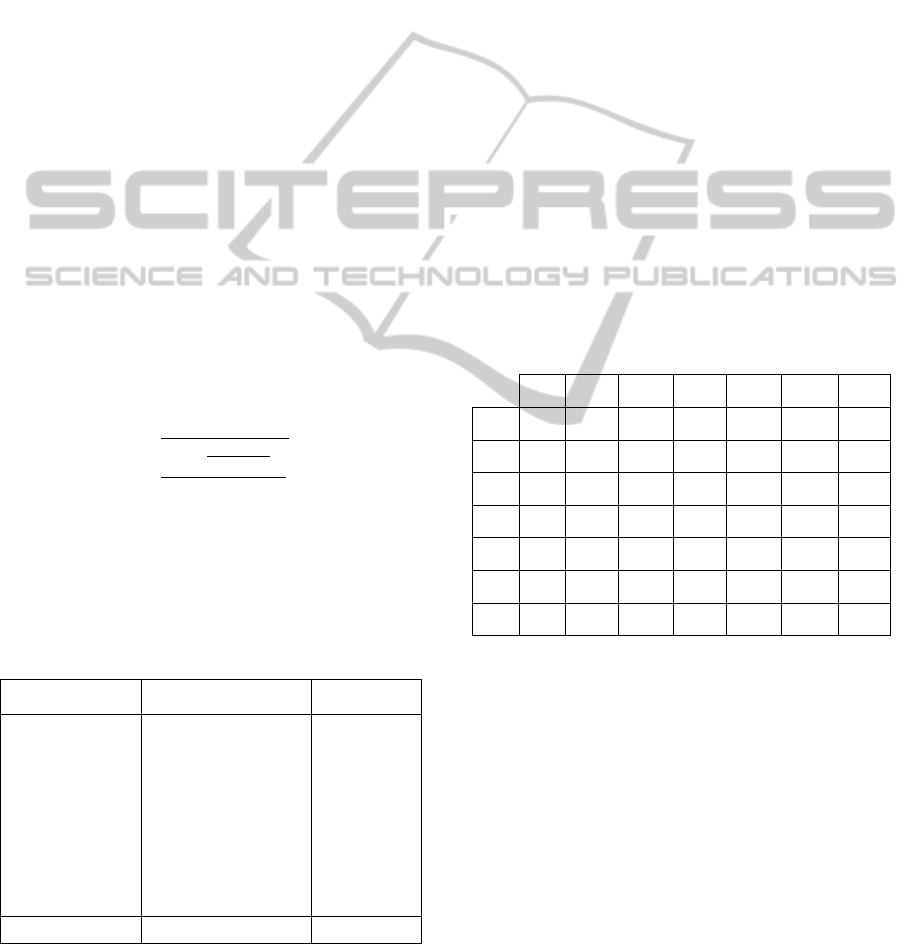
The graph of Figure 2 illustrates the distribution
of buy, sell and transaction prices data retrieved
from the training set. In this graph are represented
the buy prices (Bo) and sell prices (Ao) right before
the materialization of a transaction, whose value
corresponds to the abscissas axis (horizontal). The
rectangle with dashed edges illustrates the limits of
data analyzed in the confusion matrix (between $52
ICAART 2012 - International Conference on Agents and Artificial Intelligence
274
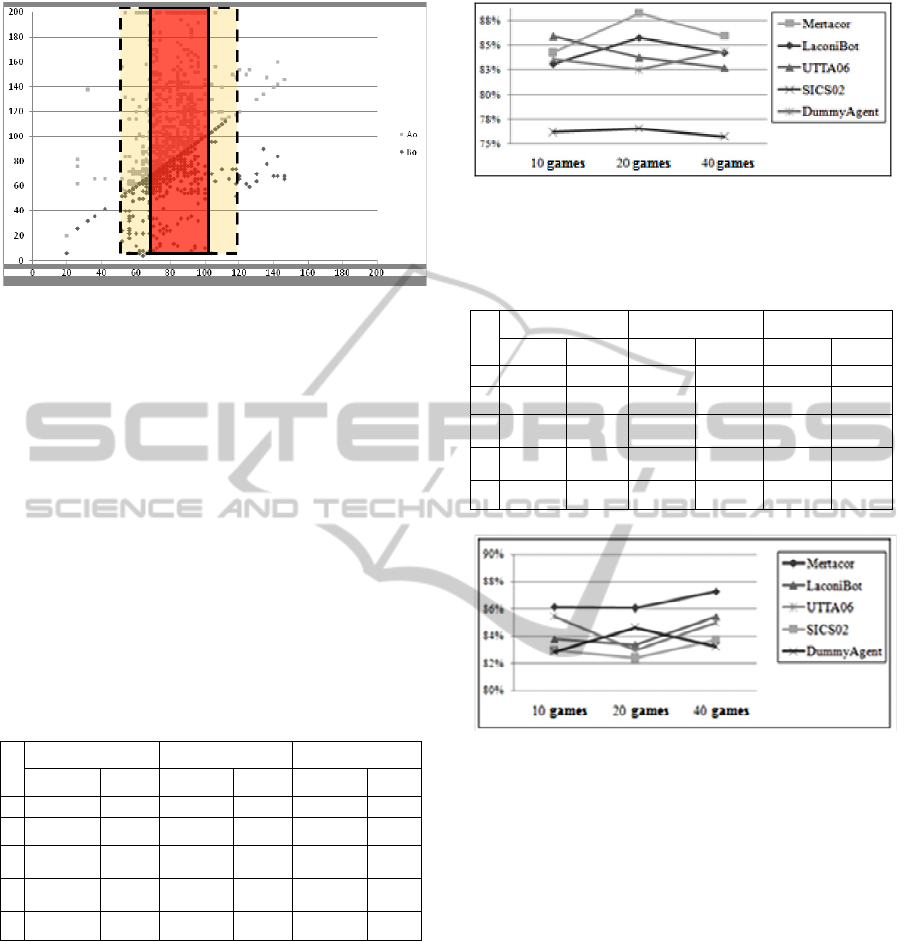
Figure 2: Graph of Buy Prices (Bo) and Sell Prices (Ao) X
Transaction price.
and $120) and the rectangle with flat edges
illustrates the limits of data with the highest number
of instances and, also, where occurred the best
performance of the ANN, presented in the confusion
matrix (between $72 and $100).
Table 3 and the graph of Figure 3 illustrate the
performance of the LaconiBot agent without the
Predictor component. Analyzing them, we notice
that the agent a average of 9316.22 and average of
84.37% of the optimal percentage. The average
points of the first placed was of 9497.47, that is, the
difference between the agent and the first placed was
of 181.25 points, or 1.90%.
Table 3: Points and classification of the LaconiBot agent
without the Predictor.
10 games 20 games 40 games
Agent Points Agent Points Agent Points
1º Mertacor
9460.43
Mertacor
9562.20
Mertacor
9469.79
2º LaconiBot
9372.86
LaconiBot
9321.54
LaconiBot
9254.27
3º UTTA06
9249.43
UTTA06
9298.85
Dummy
Agent
9222.63
4º
Dummy
Agent
9230.95
Dummy
Agent
9233.11
UTTA06
9180.90
5º SICS02
8234.58
SICS02
8337.40
SICS02
8356.34
The graph of Figure 3 shows that the presented
strategy (with the LaconiBot agent without the
Predictor component) achieved a curve which is
closer to that of Mertacor, for the optimal
percentage, when compared to other agents.
Table 4 and the graph of Figure 4 illustrate the
performance of the LaconiBot with the presence of
all components. Analyzing them, we notice that the
agent had a average of 9389.69 points and the
average of 84.19 for the optimal percentage. The
average points of the first placed was of 9489.56,
with difference of 99.87 points between the agent
and the first placed, or 1.05%.
Figure 3: Optimal percentage for the LaconiBot agent
without Predictor.
Table 4: Points and classification for the complete
LaconiBot agent.
10 games 20 games 40 games
Agent Points Agent Points Agent Points
1º
M
ertacor
9445.03
M
ertacor
9539.59
M
ertacor
9484.06
2º
L
aconiBot
9417.63
L
aconiBot
9371.73
L
aconiBot
9379.72
3º
U
TTA06
9324.26
U
TTA06
9235.29
D
ummy
A
gent
9274.00
4º
D
ummy
A
gent
9260.46
D
ummy
A
gent
9198.99
U
TTA06
9230.51
5º SICS02
9245.65
SICS02
9191.72
SICS02
9198.55
Figure 4: Optimal percentage for the complete LaconiBot
agent.
Analyzing the graph of Figure 4 again, we notice
the resemblance in the optimal percentage curve,
when comparing the agents LaconiBot and
Mertacor. The performance of points of LaconiBot
was superior to what was analyzed in the previous
battery. This situation can be explained, since the
bids sent caused a slightly more aggressive strategy,
because the return of the ANN is more precise than
the calculation done without using the ANN (median
of historical values).
Table 5 summarizes the main data needed to
evaluate the overall performance of the LaconiBot,
as well as its evolution during the incorporation of
its Predictor component, when compared to the
agent without ANN.
As observed in the summary of the table above,
the complete LaconiBot achieved a performance
superior in the average of points. Besides, it
managed to lower the difference between its points,
ARTIFICIAL NEURAL NETWORKS APPLIED TO AN AGENT ACTING IN CDA AUCTIONS IN TAC
275

Table 5: Summary of all results.
Agent
Average
of places
Optimal
Average
%
Final
Points
Average
%
Difference
for 1
st
LaconiBot
sem RNA
2 84,37 9316,22 1,90
LaconiBot
Completo
2 84,19 9389,69 1,05
when compared to the winner agent (the Mertacor
agent). Despite the average of the optimal
percentage had no improvements, we notice an
improvement in the real performance of the agent
(average of points).
4 CONCLUSIONS AND FUTURE
WORKS
Research in electronic commerce, trading agents and
negotiation strategies in CDA environments have
been pushed by researchers all over the world by the
use of statistical and artificial intelligence
techniques. As a contribution, this work proved in an
empirical fashion that the approach herein described
to calculate the estimation of prices of goods
negotiated in CDA auctions, applied to the TAC
scenario, is viable, bringing real benefits to the
performance of a negotiation agent. In the future, we
intend to analyze the impact in the modification of
the topology of the ANN as illustrated in (Melo et
al., 2009), the implementation of other ANN models
besides the MLP model, and the use of an ANN
trained for each type of ticket.
Other future works include: compare the
performance of other ANN implementations, applied
to the same scenario; we also intend to generalize
the approach described to support the selection of
auctions in any CDA scenario and support the
selection of auctions in markets that use other
negotiation mechanisms; still, we intend to supply a
complete framework to support the development of
strategies for selection of auctions in the most
various electronic commerce scenarios.
REFERENCES
Das, R.; Hanson, J. E.; Kephart, J. O.; Tesauro, G., 2001.
Agent-Human Interactions in the Continuous Double
Auction. Proceedings of the Seventeenth International
Joint Conference on Artificial Intelligence.
Washington: B. Nebel, Vol.17, No.1, pp. 1169-1178.
Feitosa, Robson G. Fechine; Carmo, R.; Gonçalves, E. J.
T; Campos, G. A. L ; Souza, J. T.; Oliveira, P., 2010.
Algoritmo Genético Aplicado a um Agente para a
Seleção de Leilões do Tipo CDA do TAC. In:
AutoSoft, 2010, Salvador. CBSOFT 2010.
Haykin, S. Neural networks: a comprehensive foundation.
Prentice hall, 2001
Heaton, J., 2005. Introduction to Neural Networks with
Java. Heaton Research Inc.
Ko, Po-Chang and Lin, Ping-Chen, 2008. Resource
allocation neural network in portfolio selection.
Expert Systems with Applications, Vol.35, pp.330-
337.
Malcangi, M. and Frontini, D., 2009. Language-
independent, neural network-based, text-to-phones
conversion Neurocomputing, Elsevier, 73, 87-96.
Marrone, Paolo., 2007. Joone (Java Object Oriented
Neural Engine). Available at: www.jooneworld.com.
br.
Melo, G. S.; Campos, G. A. L.; Silva, J.; Sousa, J., 2009.
Projeto Automático De Redes Neurais Artificiais Para
O Problema De Previsão Em Séries Temporais. In:
Simpósio Brasileiro de Pesquisa Operacional, Porto
Seguro - BA. 41º Simpósio Brasileiro de Pesquisa
Operacional.
Petridis, V.; Kehagias, A., 1997. Predictive modular fuzzy
systems for time-series classification. IEEE
Transactions on Fuzzy Systems 5: 381-397.
Soares, A. S., 2008. Predição de séries temporais
econômicas por meio de redes neurais artificiais e
transformada wavelet: combinando modelo técnico e
fundamentalista. Universidade de São Paulo.
Vytelingum, P., 2006. The Structure and Behaviour of the
Continuous Double Auction. PhD, School of
Electronics and Computer Science, University of
Southampton.
Wellman, M. and Wurman, P., 1999. A trading agent
competition for the research community, IJCAI-99
Workshop on Agent-Mediated Electronic Commerce,
Stockholm.
Witten, I. H. and Frank, E, 2005. Data mining: practical
machine learning tools and techniques. Elsevier.
Zhu, J.; Liu, C.; Gong, J.; Wang, D.; Song, T., 2006. A
Distributed Computing Service for Neural Networks
and Its Application to Flood Peak Forecasting Neural
Information Processing, 890-896.
ICAART 2012 - International Conference on Agents and Artificial Intelligence
276
