
PREDICTING NEW HUMAN DRUG TARGETS BY USING
FEATURE SELECTION TECHNIQUES
Eduardo Campos dos Santos
1
, Braulio Roberto Gonçalves Marinho Couto
2
,
Marcos A. dos Santos
3
and Julio Cesar Dias Lopes
4
1
Instituto de Ciências Biológicas, Universidade Federal de Minas Gerais / UFMG
Av. Antônio Carlos 6627, 31270-901, Belo Horizonte, Brazil
2
Centro Universitário de Belo Horizonte / UNI-BH, Av. Professor Mário Werneck 1685, 30455-610, Belo Horizonte, Brazil
3
Departamento de Ciência da Computação, UFMG, Av. Antônio Carlos 6627, 31270-901, Belo Horizonte, Brazil
4
Departamento de Química, UFMG, Av. Antônio Carlos 6627, 31270-901, Belo Horizonte, Brazil
Keywords: Human drug target, Logistic regression, Case-control study, Prediction models.
Abstract: Drug target identification and validation are critical steps in the drug discovery pipeline. Hence, predicting
potential “druggable targets”, or targets that can be modulated by some drug, is very relevant to drug
discovery. Approaches using structural bioinformatics to predict “druggable domains” have been proposed,
but they have only been applied to proteins that have solved structures or that have a reliable model
predicted by homology. We show that available protein annotation terms may be used to explore semantic-
based measures to provide target similarity searching and develop a tool for potential drug target prediction.
We analysed 1,541 human protein drug targets and 29,580 human proteins not validated as drug targets but
which share some InterPro annotations with a known drug target. We developed a semantic-based similarity
measure by using singular value decomposition over InterPro terms associated with drug targets, performed
statistical analyses and built logistic regression models. We present a probabilistic model summarised in a
closed mathematical formula that allows human protein drug targets to be predicted with a sensitivity of
89% and a specificity of 67%.
1 INTRODUCTION
The identification and validation of drug targets are
critical steps in the drug discovery pipeline. Thus, it
is important to improve the discovery of hidden
target similarities or off-target similarities that can
help select “druggable targets”. Here, we consider
“druggable targets” to be those human or pathogen
proteins that may be modulated by some orally
bioavailable compound. Conversely, “undruggable
targets” are those proteins that are considered too
difficult to be modulated by some drug. Even
“undruggable targets” have been addressed, in
particular in oncology studies (Verdine and
Walensky, 2007); (Schreiber, 2009), but it is
valuable to distinguish the “more-druggable” and the
“less-druggable” targets before incurring substantial
expenditure and effort (Cheng et al., 2007). To
identify “druggable” and “undruggable” proteins,
some researchers have been developing structure-
based approaches to identify “druggable” and
“undruggable” binding sites and cavities (Haupt and
Schroeder, 2011; Moriaud et al., 2011; Gao et al.,
2008). However, as the majority of drug targets for
small molecule therapeutics are formed by proteins
with unsolved three-dimensional structures,
structure-based design is not possible. Therefore,
sequence similarity performs an important role in
finding novel “druggable” targets. Indeed, current
public resources containing drug target information
like the Therapeutic Target Database – TTD (Zhu et
al., 2010) and DrugBank (Wishart et al., 2008)
provide target similarity searching based only on the
BLAST algorithm.
Although high sequence similarity is a good
initial guide, it is known that there are also important
structural similarities and other correlations even for
proteins with low sequence similarity (Vidovic and
Schürer, 2009); (Krissinel, 2007); (Gan et al., 2002);
(Betts et al., 2001). Knowledge-based approaches
may help develop a classification program. Indeed,
in an influential paper, Hopkins and Groom (2002)
137
Campos dos Santos E., Gonçalves Marinho Couto B., A. dos Santos M. and Dias Lopes J..
PREDICTING NEW HUMAN DRUG TARGETS BY USING FEATURE SELECTION TECHNIQUES.
DOI: 10.5220/0003734501370142
In Proceedings of the International Conference on Bioinformatics Models, Methods and Algorithms (BIOINFORMATICS-2012), pages 137-142
ISBN: 978-989-8425-90-4
Copyright
c
2012 SCITEPRESS (Science and Technology Publications, Lda.)

proposed 130 InterPro entries as sufficient to predict
all the druggable human proteins. This proposal,
together with studies that evaluate semantic
similarity measures based on Gene Ontology
annotations (Lord et al., 2003); (Chagoyen et al.,
2006), suggest an approach based on investigating
semantic similarity measures of protein targets based
on their InterPro annotations.
In this paper, we explore semantic similarity
across InterPro entries annotated to known drug
targets as an alternative to sequence similarity for
target similarity prediction. The validated targets
were collected from TTD (Zhu et al., 2010);
DrugBank (Wishart et al., 2008) and KEGG-Drug
(Kanehisa et al., 2010).We represented the targets in
a vector space model (VSM) in which targets were
recoded as column vectors and the descriptors
(rows) were, initially, all the InterPro terms that
occur in the target set. The next step was to reduce
the dimensionality of the problem. The goal is to
select those descriptors that result in the “best”
model. The rationale for minimising the number of
descriptors in the model is that the resultant model
tends to be more efficient when redundant and
irrelevant attributes are eliminated (Hosmer and
Lemeshow, 2000; Chen et al., 2008). We applied the
cosine similarity measure as described by Chagoyen
et al. (2006) to compute the pairwise similarity
among the targets represented in a transformed
feature space reduced by using Singular Value
Decomposition (SVD). We showed that our
annotation-based similarity metric is consistent with
BLAST and results in better discrimination of the
target clusters. Afterwards, we projected other
human proteins in the reduced space, calculated the
similarity coefficient between each new protein to
each validated target and then constructed a control
set approximately five times the size of the original
validated group. This control set was used in a case-
control study. It was constructed by selecting a
subset of the proteins that resulted in lower
maximum similarity coefficients against the drug
target set. Then, we applied regression models to
minimise the number of the descriptors from the
original full data set.
2 MATERIAL AND METHODS
We constructed a matrix with 1,541 binary vectors
that represents known protein drug targets retrieved
from public databases (TTD (Zhu et al., 2010),
Drug-Bank (Wishart et al., 2008) and KEGG-Drug
(Kanehisa et al., 2010). Each protein-representing
vector is a set of 2,700 binary descriptors, each of
them representing an InterPro annotation. Therefore,
protein drug targets were recoded as vectors in
m
,
where m is the number of InterPro descriptors
analysed (2,700). In this way, the target database is a
sparse matrix M, with dimension m x n, where n is
the number of proteins in the data set and each row
of the binary vectors indicates the presence or
absence of an InterPro annotation:
mnmm
n
n
xxx
xxx
x
x
x
M
21
22221
11211
....
....
....
where x
ij
is the presence (1) or absence (0) of the
InterPro descriptor i on the protein drug target vector
j. The matrix M was decomposed by using SVD
(Golub and Kahan, 1965) and factorised as M =
USV
T
. The singular values placed in decreasing
order along the main diagonal of S are directly
related to the independent characteristics within the
dataset (Deerwester et al., 1990; Berry et al., 1995;
Eldén, 2006). To transform the matrix M
2700x1541
in
an information retrieval system, it was necessary to
determine the best low-rank approximation M
k
in
reduced space:
k
e
T
eeee
T
kkkk
vsuVSUMM
1
(1)
where u
e
and v
e
are, respectively, the column vectors
of U and the row vectors of V both related to the e-
th singular value in decreasing order and k is the
rank of the matrix M
k
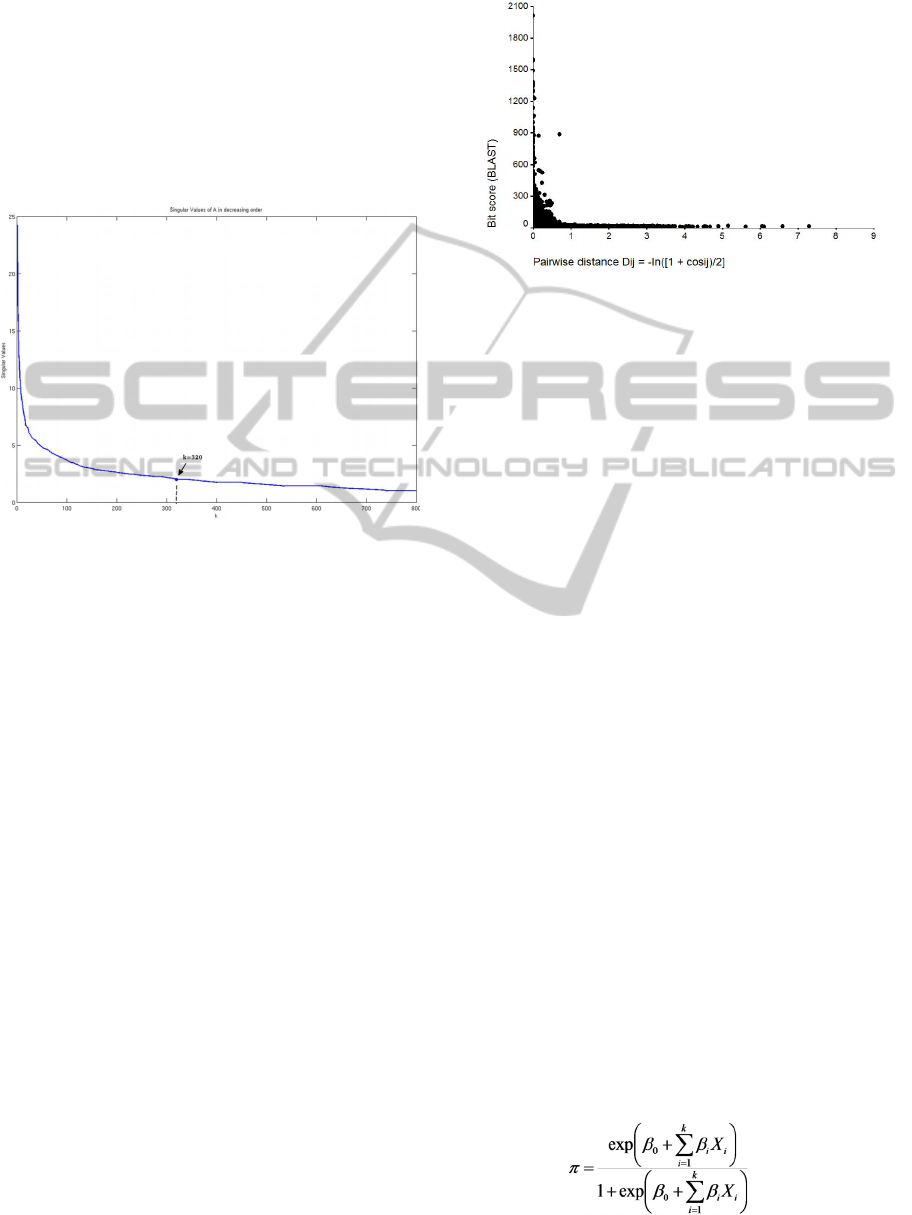
. We selected k = 320 factors
by applying the scree test (Cattell, 1966) to
determine the low-rank approximation M
k
(Figure
1). The factorisation provided a reduced
dimensionality space in which relationships among
the drug targets could be established. The similarity
between any pair of drug targets was calculated as
the cosine of the angle between the respective target
representing vectors on the reduced space.
Therefore, the similarity measure of a pair of targets
is equivalent to the dot product between the
respective rows of the matrix V
k
S
k
.
To validate our semantic-based similarity metric,
we compared our results with those given by the
BLAST algorithm. Figure 2 shows the scatter plot of
a distance-like coefficient given by our methodology
BIOINFORMATICS 2012 - International Conference on Bioinformatics Models, Methods and Algorithms
138
versus the bit score given by BLAST. To convert the
pairwise cosine coefficients into pairwise distance
coefficients, we applied the transformation formula
proposed by Stuart et al. (Stuart et al., 2002) d
ij
= -
ln((1 + cos
ij
)/2). The exponential rate of the
correlation scatter plot illustrates the known
characteristic of SVD as distances become more
discriminated – similar entities become more similar
and dissimilar entities become more dissimilar in the
reduced space vector.
Figure 1: Singular values of M (as obtained by SVD
factorisation) plotted in decreasing order. The X axis
corresponds to the singular value index. The first k = 320
largest were selected by the scree test.
The second step was to select the control group,
i.e., protein sequences classified as undruggable
targets. To do so, we collected from the UniProt
(The UniProt Consortium, 2010) 29,580 human
proteins that are not validated as drug targets but do
share InterPro annotation with any of 1,541 drug
targets. Each one of the 29,580 non-target candidate
sequences was recoded as a vector in
2700
, where
the space dimensionality (2,700) is given by the
number of InterPro descriptors considered to
generate the query vectors (q). Thus, each query
vector was projected into reduced space obtained by
SVD; formally, q*=q
T
U
k
. Afterwards, we computed
the pairwise distance coefficient similarity among
the reduced vector queries (q*) and all drug target
vectors in the reduced space (M
k
), which generated
1,541 pairwise distances for each of the 29,580 non-
target candidate sequences. The maximum pairwise
distance of each candidate sequence was selected,
and the percentile 75 (p
75
) of these maximum
distances was chosen as the cut-off value to classify
a candidate sequence as a non-target protein. All
sequences with vector query (q*) with maximum
pairwise distance less than 1.2821 (p
75
) were
classified as non-target sequences, becoming the
control group, totalling 7,830 proteins.
Figure 2: Correlation scatter plot of the pairwise distance
dij between protein vectors (d
ij
=-ln((1 + cos
ij
)/2)) and
BLAST bit score. The exponential rate may be explained
by the known characteristic of SVD as distances becoming
more discriminate – similar entities become more similar
and dissimilar entities become more dissimilar in the
reduced space vector. A negative correlation was expected
because the higher the similarity between two proteins,
smaller the related distance and the higher the bit score.
The third step of this study was to build a model
to predict new human druggable target proteins. This
was done by performing a case-control study
(Schlesselman, 1982). Approximately 20% of the
1,541 targets (384 sequences) were extracted
randomly for validation, and the remaining 1,157
were used as the case set. For the control group,
7,830 non-target sequences were randomly assigned
as either the case set (5,821 sequences) or for model
validation (2,009 sequences). Thus, the final sample
size was 6978 (5821 + 1157). All InterPro
annotations were considered as variable candidates
for the model. During the SVD analysis, we used
2,700 InterPro annotations of five types: Family (F),
Domain (D), Region (R), Active Site (A) and
Binding Site (B). However, to avoid redundancies,
we considered only InterPro annotations of F, D or
G types during the predictive model construction.
Thus, only 2,390 Interpro annotations were
considered in the model analysis.
A logistic regression model was developed for
the case-control study, allowing feature selection. In
addition to feature selection, the logistic model can
also be used to predict the probability () that a
sequence is a druggable target based on a
combination of the k InterPro annotations selected in
the model:
(2)
PREDICTING NEW HUMAN DRUG TARGETS BY USING FEATURE SELECTION TECHNIQUES
139

In Equation (2), is the probability of a
sequence belonging to the drug target group, k is the
number of explanatory features (InterPro
annotations) significantly selected for the model and
i
is the regression coefficient for each InterPro (i =
1, 2, 3 …k). The model-building strategy for the
feature selection was an automatic forward stepwise
logistic regression performed by SPSS - Statistical
Package for the Social Sciences (SPSS Inc., 2008).
Before performing the logistic regression, a
univariate analysis was performed using Fisher’s
exact test on a pre-selected subset of the 2,390
InterPro used in the stepwise logistic regression
(Altman, 1991). Only InterPro annotations with a p-
value less than or equal to 0.05, by Fisher’s exact
test (univariate analysis), were used in the
multivariate analysis. This stringent cut-off was
chosen because of the excessive number of
candidate features (2,390).
After model building,, definition of the best cut-
off for the probabilities calculated by the logistic
model in order to classify a new sequence as a
potential drug target was made by ROC – ‘receiver
operating characteristic’ curve analysis (Altman,
1991).
3 RESULTS
The sample size used in the case-control study was
composed of 1,157 targets (cases) and 5,821 non-
target sequences (controls), totaling 6,978 proteins.
Univariate analysis performed by Fisher’s exact test
selected 587 InterPro entries from 2,390 annotations
initially involved in the study. Some InterPro
annotations were selected because their presence
increases the chance of a sequence to be a druggable
target (as is the case of IPR001828,Table 1). Other
InterPro annotations were selected because their
presence reduced the chance that a sequence would
be a druggable target (for example
IPR001828,Table
2).
From the 587 InterPro entries selected from the
univariate analysis that were automatically
forwarded to stepwise logistic regression, 66 were
identified as independently associated with the drug
target status. Table 3 presents the InterPro
annotations identified and the parameters from
Equation (2) estimated for the logistic regression
model to predict drug target sequences. If the beta
value is negative, the presence of the InterPro
annotations reduces the chance that a sequence is a
druggable target. On the other hand, if the beta value
is positive, the presence of the InterPro annotation
increases the chance that a sequence is a druggable
target.
Table 1: Univariate analysis for InterPro IPR001828 – its
presence increases the chance that a sequence is a
druggable target.
InterPro
IPR001828
Sample
size
Number of
target
sequences
Percent
of target
sequence
p-value
Presence 21 19 90% < 0.001
Absence 6,957 1,138 16%
Total
6,978
1,157
17%
Table 2: Univariate analysis for InterPro IPR016175 – its
presence reduces the chance that a sequence is a druggable
target.
InterPro
IPR016175
Sample
size
Number of
target
sequences
Percent
of target
sequence
p-value
Presence 230 0 0% < 0.001
Absence 6,748 1,157 17%
Total
6,978
1,157
17%
Because the results of logistic model in Equation
(2) provide a probability value ranging from 0.0 to
1.0, we need to choose a cut-off value to define if a
sequence is in the drug target group. Actually,
logistic regression allows us to distinguish those
sequences likely or unlikely to be a druggable target,
providing a probability value. Usually the cut-off is
0.50, meaning that if the probability that the
sequence is in the drug target group is higher than
0.50, then the sequence is classified as a potential
druggable target. However, other cut-offs can be
used according to the ROC analysis (Figure 3). The
best cut-off in probability is 0.25, which maximises
both sensitivity and specificity, being nearest the top
left-hand corner of ROC curves.
To validate the model, we reserved 384 known
targets and 2,009 control sequences, totalling 2,393
proteins. Classification quality of these sample
queries is summarised in Table 4. The sensitivity of
classifying unknown sequences was 89%, and the
specificity was 67%. Because we used 0.25 as a cut-
off, if the probability model for a query is higher
than 0.25, the sequence is classified as a potential
druggable target.
BIOINFORMATICS 2012 - International Conference on Bioinformatics Models, Methods and Algorithms
140
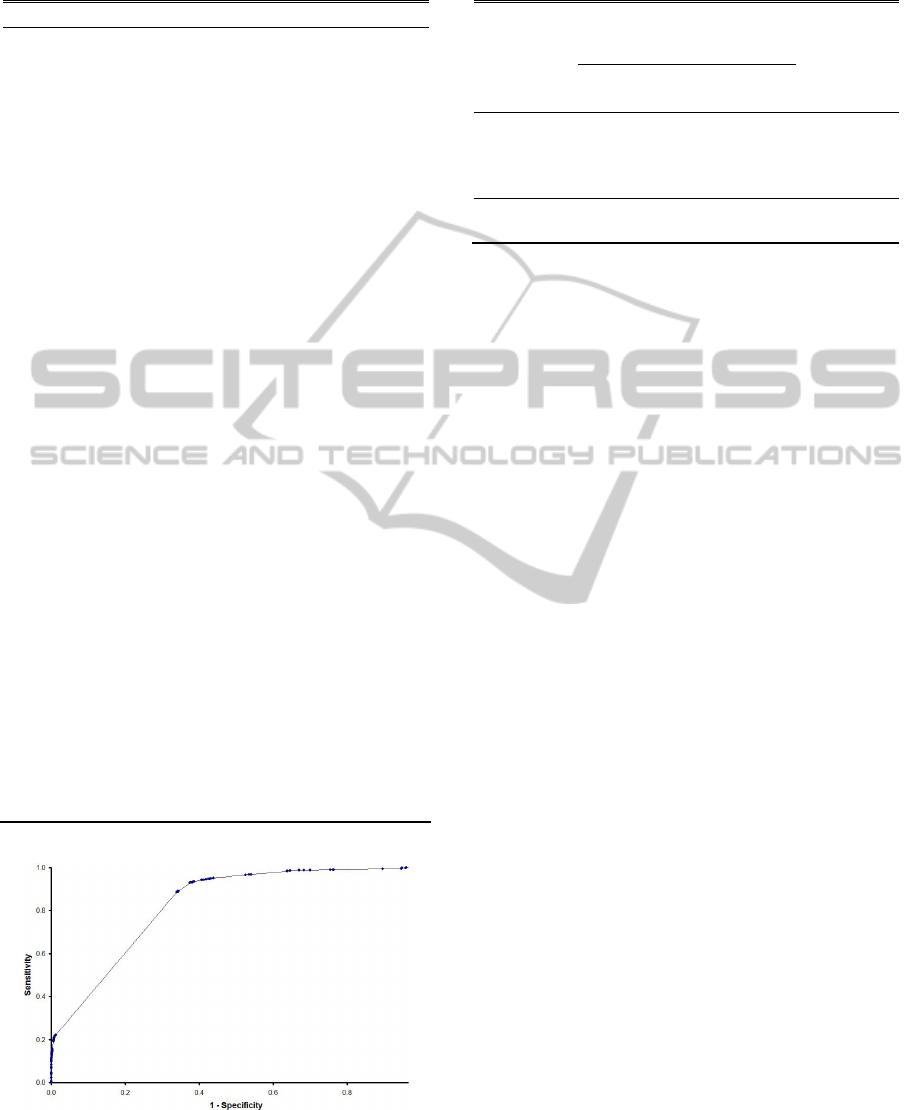
Table 3: Logistic regression model built for predicting if a
sequence is a druggable target.
InterPro
p-value InterPro
p-value
IPR016175 -7.3 0.067 IPR001023 -1.9 0.009
IPR012677 -4.8 0.000 IPR020685 -1.9 0.000
IPR010993 -4.5 0.004 IPR003593 -1.6 0.000
IPR004000 -3.7 0.000 IPR003596 -1.4 0.034
IPR000883 -3.4 0.001 IPR016040 -0.6 0.001
IPR008973 -3.3 0.000 IPR001452 1.3 0.032
IPR001173 -2.8 0.006 IPR020683 1.3 0.045
IPR016137 -2.6 0.011 IPR013099 1.4 0.065
IPR013783 -2.6 0.000 IPR000980 1.5 0.016
IPR013766 -2.5 0.012 IPR015421 1.6 0.000
IPR002213 -2.4 0.001 IPR011029 1.6 0.006
IPR011009 -2.4 0.000 IPR000472 1.8 0.030
IPR000873 -2.1 0.003 IPR013816 1.8 0.041
IPR000010 -2.1 0.040 IPR000889 1.8 0.031
IPR003597 -2.1 0.001 IPR011348 2.2 0.080
IPR008753 -2.0 0.052 IPR007698 2.2 0.080
IPR001353 -1.9 0.008 IPR014756 2.2 0.004
IPR011497 2.2 0.074 IPR015741 3.3 0.001
IPR005225 2.3 0.013 IPR017193 3.3 0.023
IPR001251 2.3 0.028 IPR000626 3.3 0.023
IPR002035 2.4 0.000 IPR020663 3.3 0.000
IPR001841 2.5 0.028 IPR008979 3.3 0.002
IPR011304 2.6 0.028 IPR009130 3.6 0.018
IPR000157 2.6 0.012 IPR014729 3.8 0.000
IPR013027 2.7 0.014 IPR001828 3.8 0.000
IPR002314 2.8 0.034 IPR003116 3.9 0.002
IPR008957 2.9 0.000 IPR020722 4.0 0.039
IPR015015 2.9 0.020 IPR020727 4.0 0.023
IPR011992 3.0 0.000 IPR009134 5.0 0.007
IPR005834 3.1 0.010 IPR002126 5.2 0.001
IPR009030 3.2 0.001 IPR008424 5.2 0.000
IPR005821 3.2 0.000 IPR000353 5.6 0.000
IPR000001 3.2 0.030 IPR016243 7.7 0.000
Obs.:
0
= -0.9
Figure 3: ROC curve analysis for predicting a druggable
target. The best cut-off for maximum sensitivity and
specificity is a probability higher than 0.25 (area under the
curve = 0.828).
Table 4: Classification quality of sample queries with the
logistic regression model for predicting drug targets.
Group
Classification using a cut-off
= 0.25 in logistic probability
Total
(+) (-)
Drug target 340 44 384
Non-target 661 1,348 2,009
Total 1,001 1,392 2,393
4 CONCLUSIONS
We identified 66 features (InterPro entries) that
allow retrieval of protein drug targets with a
sensitivity of 89% and a specificity of 67%.
The model provided a statistical evaluation over
the current protein annotation to predict potential
drug targets or, at least, potential “druggable
targets”, meaning proteins that potentially can be
modulated by an orally bioavailable drug. The
model gives us a closed formula to calculate the
probability that a given sequence, described by their
biological annotations, is druggable.
Though “druggable targets” are different from
“therapeutic drug targets”, their prediction is a good
contribution to drug development focusing on drug
target research.
Our model differs from the approach of Hopkins
and Groom (2002) by including not only InterPro
annotations that contribute positively to classifying a
protein as druggable, but also by including those
annotations that contribute negatively. Our model is
more restrictive and gives results closer to the
proteins that actually are therapeutic drug targets.
REFERENCES
Altman, D. G. (1991). Practical Statistics for Medical
Research. Chapman & Hall.
Betts, M. J., Guigó, R., Agarwal, P., Russell, R. B. (2001).
Exon structure conservation despite low sequence
similarity: a relic of dramatic events in evolution? The
EMBO journal, 20(19), 5354–5360.
Cattel, R. B. (1966). The scree test for the number of
factors. Multivariate Behavioural Research, 1, 245-76.
Chagoyen, M., Carmona-Saez, P., Gil, C., Carazo, J. M.,
Pascual-Montano, A. (2006). A literature-based
similarity metric for biological processes. BMC
Bioinformatics, 7, 363–375.
PREDICTING NEW HUMAN DRUG TARGETS BY USING FEATURE SELECTION TECHNIQUES
141

Chen, M.-c., sheng Chen, L., chin Hsu, C., Rong Zeng, W.
(2008). An information granulation based data mining
approach for classifying imbalanced data. Information
Sciences, 178, 3214–3227.
Cheng, A. C., Coleman, R. G., Smyth, K. T., Cao, Q.,
Soulard, P., Caffrey, D. R., Salzberg, A. C., Huang, E.
S. (2007). Structure-based maximal affinity model
predicts small-molecule druggability. Nature
Biotechnology, 25(1), 71–75.
Berry, M. W. et al., 1995. Using linear algebra for
intelligent information retrieval. SIAM Review, 37,
573-595.
Deerwester, S. et al., 1990. Indexing by Latent Semantic
Analysis. Journal of the American Society for
Information Science, 41(6), 1-13.
Eldén, L., 2006. Numerical linear algebra in data mining.
Acta Numerica, 327-384.
Gan, H. H., Perlow, R. A., Roy, S., Ko, J., Wu, M.,
Huang, J., Yan, S., Nicoletta, A., Vafai, J., Sun, D.,
Wang, L., Noah, J. E., Pasquali, S., Schlick, T. (2002).
Analysis of protein sequence/structure similarity
relationships. Biophysical Journal, 83, 2781–2791.
Gao, Z., Li, H., Zhang, H., Liu, X., Kang, L., Luo, X.,
Zhu, W., Chen, K., Wang, X., and Jiang, H. (2008).
Pdtd: a web-accessible protein database for drug target
identification. BMC Bioinformatics, 9(1), 104.
Golub, G and Kahan, W. (1965). Calculating the singular
values and pseudo-inverse of a matrix. SIAM J.
Numer. Anal. Ser. B, Vol.2, No.2, p. 205-224, 1965.
Haupt, V. J. and Schroeder, M. (2011). Old friends in new
guise: repositioning of known drugs with structural
bioinformatics. Briefings in Bioinformatics.
Hopkins, A. L., Groom, C. R. (2002). The druggable
genome. Nature reviews. Drug discovery, 1(9), 727–
730.
Hosmer, D. W. and Lemeshow, S. (2000). Applied logistic
regression (Wiley Series in probability and statistics).
Wiley-Interscience Publication.
Kanehisa, M., Goto, S., Furumichi, M., Tanabe, M.,
Hirakawa, M. (2010). Kegg for representation and
analysis of molecular networks involving diseases and
drugs. Nucleic Acids Research, 38, D355–D360.
Krissinel, E. (2007). On the relationship between sequence
and structure similarities in proteomics.
Bioinformatics, 23(6), 717–723.
Liu, T., Chen, Z., Zhang, B., Ma, W.-y., Wu, G. (2004).
Improving text classification using local latent
semantic indexing. In Proceedings of the Fourth IEEE
International Conference on Data Mining, ICDM ’04,
pages 162–169, Washington, DC, USA. IEEE
Computer Society.
Lord, P., Stevens, R., Brass, A., Goble, C. (2003).
Investigating semantic similarity measures across the
gene ontology: the relationship between sequence and
annotation. Bioinformatics, 19, 1275–1283.
Moriaud, F., Richard, S. B., Adcock, S. A., Chanas-
Martin, L., Surgand, J.-S., Ben Jelloul, M., and
Delfaud, F. (2011). Identify drug repurposing
candidates by mining the protein data bank. Briefings
in Bioinformatics.
Schlesselman, J. J. (1982). Case-Control Studies. Oxford
U. Press.
The UniProt Consortium. (2010). The Universal Protein
Resource (UniProt) in 2010. Nucleic Ac-ids Res,
38(suppl 1):D142-D148.
Schreiber, S. L. (2009). Organic chemistry: Molecular
diversity by design. Nature, 457, 153–154.
SPSS Inc. (2008). Statistic Package for Social Science
(SPSS) for Windows.
Stuart, G. W., Moffett, K., Leader, J. J. (2002). A
comprehensive vertebrate phylogeny using vector
representations of protein sequences from whole
genomes. Mol Biol Evol, 19(4), 554–562.
Verdine, G. L., Walensky, L. D. (2007). The challenge of
drugging undruggable targets in cancer: Lessons
learned from targeting bcl-2 family members. Clinical
Cancer Research, 13(24), 7264–7270.
Vidovic, D., Schürer, S. C. (2009). Knowledge-based
characterization of similarity relationships in the
human protein – tyrosine phosphatase family for
rational inhibitor design. Journal of Medicinal
Chemistry, 52(21), 6649–6659.
Wishart, D. S., Knox, C., Guo, A. C., Cheng, D.,
Shrivastava, S., Tzur, D., Gautam, B., Hassanali, M.
(2008). Drugbank: a knowledge base for drugs, drug
actions and drug targets. Nucleic Acids Research –
Database issue, 36, D901–D906.
Zhu, F., Han, B., Kumar, P., Liu, X., Ma, X., Wei, X.,
Huang, L., Guo, Y., Han, L., Zheng, C., and Chen, Y.
(2010). Update of TTD: Therapeutic target database.
Nucleic Acids Research – Database issue, 38, D787–
D791.
BIOINFORMATICS 2012 - International Conference on Bioinformatics Models, Methods and Algorithms
142
