
BIOFUNCTIONAL INTERFACES FOR BIOSENSING
APPLICATIONS
Saroja Mantha
1
, Virginia Davis
2
, Bryan Chin
1
and Aleksandr Simonian
1
1
Departments of Materials Research and Education Center, Auburn University, Auburn, AL 36849, U.S.A.
2
Department of Chemical Engineering, Auburn University, Auburn, AL 36849, U.S.A.
Keywords: Layer-by-layer assembly, CNTs, Multifunctional nanointerfaces, Biosensing, Detection, Glucose, Paraoxon.
Abstract: Layer-by-layer assembled CNTs customized with biopolymers has recently attracted a great attention as a
simple, robust and inexpensive method for creating nanocomposite thin films with a high degree of control
that may provide potentially powerful interfaces for multiple applications, including but not limited to
biomedicine and biosensing. Intercalation of oppositely charged polymers and catalytically active proteins
on the CNT surface allow assembling of unique nanointerfaces with the ability to detect single or multiple
analytes (Hitzky et al., 2005; Kumar and Swetha, 2010; Dujardin and Mann, 2002; Palin et al., 2005; Geetha
et al., 2006; Yan et al., 2010; Riccardi et al., 2006; Darder et al., 2005; Liu et al., 2004; Raravikar et al.,
2005; Du et al., 2004; Katz and Willner, 2004; Wang, 2005; Allen et al., 2007; Ghindilis et al., 1997; Joshi
et al., 2005; Chikkaveeraiah et al., 2009; Wang et al., 2006). The aim of this study is to design of
multifunctional systems for the detection of numerous compounds, such as glucose and OP neurotoxins, in
one platform using nanocomposite interface. A redox enzyme glucose oxidase (GOX) and organophosphate
hydrolase (OPH), a phosphotriesterase catalyzing degradation of phosphorus-containing toxins and
pesticides, were covalently immobilized on the multiwalled carbon nanotube (MWNT) surface using
EDC/NHS chemistry. Layer-by-layer assembly (LBL) of oppositely charged CNTs customized with
different biopolymers were examined on several substrates including glass or silicon slides and glassy
carbon electrode. The interface assembly were characterized using Thermogravimetric analysis, Raman
spectroscopy, Fourier Transform Infrared Spectroscopy, and scanning electron microscopy (SEM). The
catalytic activity of the biopolymer layers were characterized using absorption spectroscopy and
electrochemical analysis. Experimental results show that this approach yields an easily fabricated catalytic
multilayer with well-defined structures and properties for biosensing applications whose interface can be
reactivated via a simple procedure.
1 EXPERIMENTAL
1.1 Enzyme Immobilization
Enzyme immobilization on carboxylated MWNTs
was performed using carbodiimide chemistry. A
dispersed solution that was optically homogeneous
to the naked eye was obtained by mixing 2 mg of
MWNT in 5 ml of de-ionized water and sonicating
the mixture for 1 hr. Under fast stirring condition
EDC (20 mM) was then added to initiate the
coupling of NHS to the carboxylic groups on the
oxidized nanotubes and the mixture was stirred at
400 rpm for 30 min. The activated nanotube solution
was then filtered through a 200 nm polycarbonate
membrane and rinsed thoroughly with MES buffer
to remove excess EDC and NHS and re-dispersed in
protein solution (Pedrosa et al., 2010). After
incubating the mixture on a platform shaker at 4°C
for 9.5 h, the nanotube suspension was centrifuged
at 13200 rpm and rinsed with MES buffer solution
three times to remove unbound protein. The protein–
nanotube conjugate was finally suspended in CHES
buffer solution. Oxidized MWNT were separately
dispersed in PEI (1 mg/ml) by sonicating for 1 hr in
ultra sonication; excess polymer was then removed
by centrifugation at 13200 rpm for about 30 min.
Similarly 0.1 wt% of MWNT was dispersed in 0.1
wt% of DNA by sonication for 1 hr in ultra sonicator
bath followed by centrifugation at 13200 rpm for
about 30 min to remove unbound DNA.
1.2 Instruments
The samples of raw MWNT and oxidized MWNT
were analyzed by thermogravimetric analysis (TGA)
127
Mantha S., Davis V., Chin B. and Simonian A..
BIOFUNCTIONAL INTERFACES FOR BIOSENSING APPLICATIONS.
DOI: 10.5220/0003734901270131
In Proceedings of the International Conference on Biomedical Electronics and Devices (BIODEVICES-2012), pages 127-131
ISBN: 978-989-8425-91-1
Copyright
c
2012 SCITEPRESS (Science and Technology Publications, Lda.)
using TGA Q500 (TA Instrument, USA) instrument
in air atmosphere over a temperature range from 30
to 800 °C at a heating rate of 10 °C/min. Raman
spectroscopy was performed using 785 nm laser
excitation (model SDL-8530, SDL Inc.) on
Reinshaw inVia Raman microcope system. FT-IR
measurements were taken for raw, oxidized MWNT
and MWNT-OPH. The samples were ground with
potassium bromide (KBr) to form a very fine
powder using a mortar and pestle. This powder was
then compressed into a thin and transparent pellet
and was placed into the sample holder for analysis.
Analysis was performed using a Shimadzu (Thermo-
Electron Corp., Waltham, MA) bench machine with
32 scans. A drop of MWNT-OPH solution was
placed on the glass slide, allowed to spread
uniformly, and dried over night. The slide was
examined by field emission scanning electron
microscopy equipped with an energy dispersive X-
ray analyzer (JEOL USA, Inc., Peabody, MA).
Cyclic voltammetric and amperometric
measurements were performed using a CV-50
potentiostat (BAS USA) connected to a personal
computer. A three-electrode configuration was
employed, consisting of modified/glassy carbon
(GC) electrode (3-mm diameter) serving as a
working electrode, whereas Ag/AgCl (3 M KCl) and
platinum wire served as the reference and counter
electrodes respectively. Batch electrochemical
experiments were carried out in a 2 ml voltammetric
cell at room temperature (25 °C).
2 LAYER-BY-LAYER ASSEMBLY
OF MWNT THIN FILMS
2.1 Slides
Glass or silicon slides were cleaned in concentrated
H
2
SO
4
/30% H
2
O
2
(3:1). The negatively charged
slides were alternately immersed in aqueous
dispersion of MWNT-PEI and MWNT-DNA. The
adsorption time of 15 min was considered sufficient
for the formation of MWNT monolayer. After each
layer deposition, the substrate was rapidly dried
using 50 psi air from a nozzle for 30 seconds. On top
of these cushioning layers, alternate layers of
MWNT-OPH and MWNT-DNA were deposited by
immersing the slide in aqueous solutions of MWNT-
OPH and MWNT-DNA for 15 min. The surface was
renewed by immersing the slides in MWNT-OPH
solution for 15 minutes. These solutions appear
stable even after a year.
2.2 Glassy Carbon Electrode
The glassy carbon electrode (GCE) was polished
with 0.10 and 0.05 μm alumina slurries and then
ultrasonically cleaned in water for 15 min. The GC
electrode was put into 1 M NaOH solution for 5 min
and potential of 1.2 V was applied to introduce
negative charges on the surface; this was followed
by two washings steps with distilled water. The
positively charged MWNT-PEI was adsorbed by
dipping the negatively charged GC electrode in an
aqueous solution of MWNT-PEI for 15 minutes, and
the MWNT-PEI/GC electrode was dried in nitrogen.
Using the same procedure, a layer of negatively
charged MWNT-DNA was adsorbed. Following
that, MWNT-OPH layer was adsorbed on the
(MWNT-DNA/MWNT-PEI)
4
/GC electrode by
dipping in MWNT-OPH solution, and further
bilayers were formed in the same way. The
modified electrode was stored at refrigerated
conditions until use. All the electrochemical
measurements were performed at room temperature.
A three electrode system containing platinum as
auxiliary electrode, an LbL modified glassy carbon
working electrode and a saturated Ag/AgCl
reference electrode was used. The buffer solution
was 50 mM PBS (pH 7.54). The regeneration of the
biosensor interface was realized by immersing the
sensor in a fresh solution of MWNT-OPH for 15
min.
3 RESULTS AND DISCUSSION
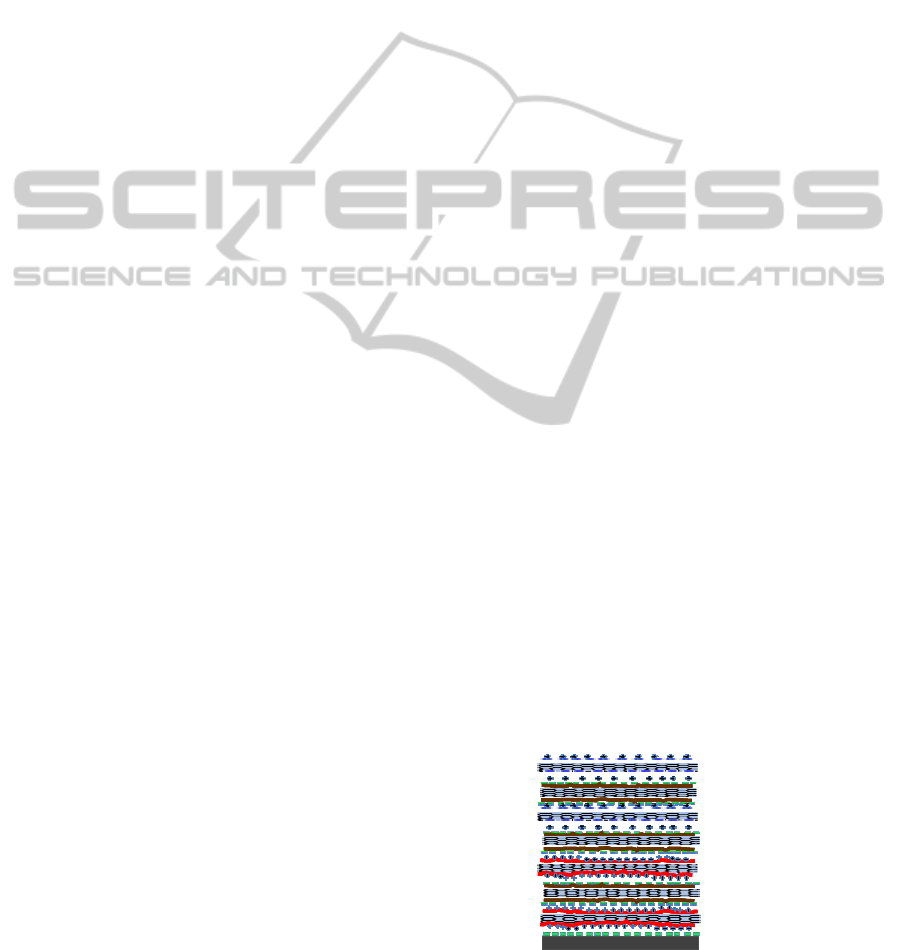
The objective of this work was to design the hybrid
catalytic interfaces based on the interaction of
anionic/cationic biomolecular layers structured with
MWNTs (Figure 1). The initial step requires
assembling of supporting bilayer of oppositely
charged MWNT- polyethyleneimine (PEI) and
MWNT-DNA. This allows for further adsorption of
positively charged complex of MWNT-protein
which adsorbs better on this cushioning support
rather than adsorbing directly on a solid support.
MWNT-PEI (+)
MWNT-DNA (-)
MWNT-DNA (-)
MWNT-PEI (+)
MWNT-DNA (-)
MWNT-OPH (+)
MWNT-OPH (+)
MWNT-PEI (+)
MWNT-DNA (-)
MWNT-DNA (-)
MWNT-PEI (+)
MWNT-DNA (-)
MWNT-OPH (+)
MWNT-OPH (+)
Figure 1: LbL interface design (not in scale): the initial
layers of MWNT-PEI and MWNT-DNA provide support
for subsequent layers of MWNT-OPH and MWNT-DNA.
BIODEVICES 2012 - International Conference on Biomedical Electronics and Devices
128
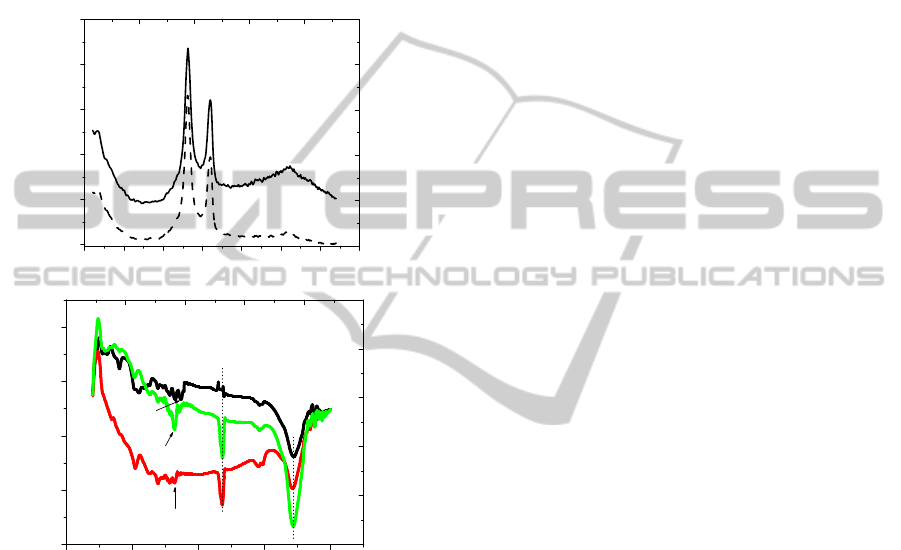
Confirmation of nanotube functionalization was
provided by Raman spectroscopy and FTIR analysis.
It is obvious from Figure 2a that the intensity of
characteristic peaks of MWNTs, namely, the D band
at 1305 cm
-1
and the G band at 1580 cm
-1
have
changed after functionalization. The D/G ratios of as
received MWNTs and oxidizes MWNTs were found
around 1.36 and 1.7 respectively, and the increased
D/G ratio corresponds to the increased degree of
functionalization.
0 500 1000 1500 2000 2500 3000 3500
0
500
1000
1500
2000
2500
Intensity (a.u.)
Raman shift (cm
-1
)
0 1000 2000 3000 4000
80
84
88
92
96
3450, OH
% Transmittance (a.u.)
Wave Number (cm
-1
)
1647, C=C
1737, C=O
2370, CH
2
1634, N-H
C
B
A
a
b
Figure 2: (a) Raman spectra of intact MWNT (––) and
oxidized MWMT (---) at 785 nm; (b) FT-IR spectra of (A)
intact MWNT, (B) MWNT-OPH and (C) oxidized
MWNT.
In order to get direct affirmation for the added
functional groups on the nanotube surfaces and
immobilization of OPH on oxidized MWNT, FT-IR
analysis was performed on as received MWNTs,
oxidized MWNT and MWNT-OPH samples. Figure
2b shows spectra of as received MWNT (A),
oxidized MWNT (B) and MWNT-OPH (C)
respectively. The oxidation of CNT by the
combination of H
2
SO
4
and HNO
3
results in the
formation of hydrophilic groups at defect sides and
ends,
−COOH, −C=O and −OH. All spectra for the
oxidized CNT displayed a peak at 1734 cm
-1
corresponding to –COOH and 1650 cm
-1
which
corresponds to –COO
-
. These results are consistent
with previous work on CNT oxidation; the exact
peak positions are the result of the extent of
oxidation. In addition, the increased in intensity of
3434 cm
-1
peak clearly confirms introduction of
more –OH groups after acid treatment. The
introduction of OPH results in the peaks at
3434 cm
-1
and 2857 cm
-1
are respectively attributed
to symmetric and asymmetric –CH
2
stretching.
However, after the enzyme immobilization on
oxidized MWNT, the 1734 cm
− 1
peak disappeared
and a new peak at ~1634 cm
− 1
was observed. This
can be attributed to the in-plane N–H molecular
vibrations of the amine group. It is believed that a
substitution reaction occurs and a –NH group
replaces the –OH group of the carboxylated
MWNTs after amide functionalization to form the –
CO–NH functional group.
The aim of this study is to design of
multifunctional systems for the detection of umerous
compounds in one platform. To demonstrate
catalytic properties of nanocomposite interface for
single analyte, organophosphate hydrolase (OPH)
enzyme was used in multilayer assembly. It is well
known that OPH hydrolyzes the phosphotriester
bond of the model OP paraoxon (λ
max
= 274 nm),
releasing the hydrolysis products p-nitrophenol
(PNP) (λ
max
= 405 nm) (Wang, 2005). Absorption
spectra show two peaks, one corresponding to
paraoxon at 274 nm and the peak at 405 nm
corresponds to PNP, the hydrolysis product formed
after exposure of the paraoxon solution to the slide
with MWNT-OPH interface. Presumably, the
activity of layers with catalytically active
biopolymer should be different from that for non-
catalytic layer. Slides with different number of
layers ending with MWNT-OPH or MWNT-DNA
were exposed to 0.1 μM paraoxon for 10 min and
the absorption spectrum was recorded. As shown in
Figure 3 the absorption at 405 nm increased with the
number of layers with an MWNT-OPH ending,
indicating a raise in the enzymatic activity
proportional to the number of enzyme layers.
Contrary to that, absorbance was much lower for
layers ending with MWNT-DNA. These results
indicate that assembled multilayers are relatively
permeable for paraoxon, which penetrate into the
deeper layers and react with OPH. More detailed
investigation of layers density and deepness of
substrate penetration and permeability in such
interfaces are following.
Electrochemical studies of LBL on glassy carbon
electrode showed increase in response with the
subsequent addition of paraoxon and glucose.
BIOFUNCTIONAL INTERFACES FOR BIOSENSING APPLICATIONS
129
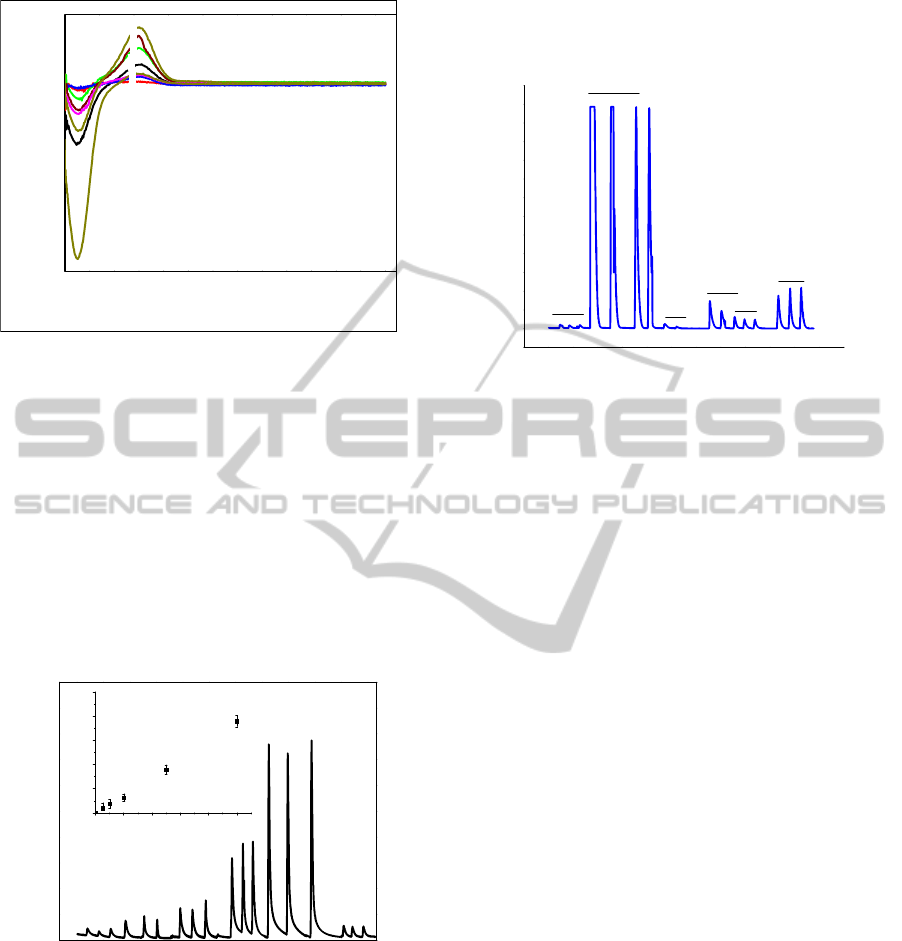
Figure 3: UV-Vis absorption spectra of LbL assembly for
different number of layers by exposing the surface to 0.1
mM Paraoxon for 10 minutes.
Figure 4, a shows flow-injection calibration data for
paraoxon over the concentration ranges of 0.5-10
μM, and the inset shows that current linearly
increased with the concentration in the range from 0
to 10 μM. The system showed excellent sensitivities
(y = -8x10
-10
+ 0.074 A/µM cm
-2
calculated from the
slopes of the linear part of the calibration curve). In
addition, based on an estimated signal-to-noise (S/N)
ratio of 3, the sensor has a detection limit of 77 nM
paraoxon.
0 300 600 900 1200 1500
0.0
0.2
0.4
0.6
0.8
1.0
0246810
0.0
0.2
0.4
0.6
0.8
1.0
I / μA
[Paraoxon] x μM
F
E
D
C
B
A
I / μA
Time (s)
Figure 4: Amperometry for LBL on GCE injecting
paraoxon only in sequence at 850 mV using 10 mM PBS
buffer.
To demonstrate catalytic properties of
nanocomposite interface for multiple analytes, two
enzymes, glucose oxidase (GOX) and
organophosphate hydrolase (OPH) were used in
multilayer assembly. Since OPH and GOX are
oppositely charged, it was possible to use them in
alternating layers for LbL assembly. As shown in
Figure 5, the biosensor generating an adequate
responses on the sequential injection of glucose and
paraoxon.
0 200 400 600 800 1000 1200
0
2
4
6
8
10
12
0.5 μM(P)
1
μM(P)
1 mM(G)
0.1
μM(P)
10 mM(G)
Current, μA
Time, Sec
0.1 μM(P)
Figure 5: Amperometry for LBL on GCE injecting
paraoxon and glucose in sequence at 850 mV using 10
mM PBS buffer. For glucose detection a redox mediator
Ferrocene methanol was added.
Since the catalytic activity of the interface is
decreasing in time, it is desirable to regenerate it
after significant reduction of the activity (Dumas et
al., 1989). In experiments with OPH the electrode
surface was renewed after 6 months of usage, when
the electrode response dropped to 45% of its original
value. We found a very easy way to restore up to
95% of the original response level by immersing the
electrode in the MWNT-OPH solution for 15
minutes. The most probable reason for gradually
reducing activity of the electrode might be that the
upper MWNT-OPH layer is depleting. Taking into
account that the activity of the surface ending with
MWNT-DNA is about 50% less than for MWNT-
OPH ending layer, we may conclude that after 6
months of use the electrode surface is losing
completely its MWNT-OPH upper layer, and the
negatively charged MWNT-DNA layer is exposing
to the solution. Then, immersing the electrode in the
MWNT-OPH solution allows restoration of active
MWNT-OPH layer and restoration of initial activity.
Thus, this simple procedure of interface re-activation
brings a significant advantage of the LbL assembly
over other technologies and allows using the
biosensor for very long time.
In conclusion, this approach to the generation of
multifunctional LbL biopolymer nanocomposite
interfaces is relatively simple, does not require
complex synthesis, and yields excellent catalytically
active interfaces appropriate for biosensing and
other applications.
300 400 500 600 700 800 90
0
-0.5
-0.4
-0.3
-0.2
-0.1
0.0
0.1
0.2
2
4
1
3
5
7
Absorbance (a.u.)
Wave length (nm)
6
BIODEVICES 2012 - International Conference on Biomedical Electronics and Devices
130

REFERENCES
Hitzky, E. R.; Darder, M.; Aranda, P. J. Mater.Chem.
2005, 15, 3650-3662.
Kumar, A. S.; Swetha, P. Langmuir 2010, 26, 6874-6877.
Dujardin, E.; Mann, S. Adv. Mater. 2002, 14, 775-788.
Palin, E.; Liu, H.; Webster, T. J. Nanotechnology 2005,
16, 1828-1836.
Geetha, S.; Rao, C. R. K.; Vijayan, M.; Trivedi, D. C.
Anal. Chim. Acta 2006, 568, 119-125.
Yan, J.; Pedrosa, V.A.; Simonian, A. L.; Revzin, A. ACS
Appl. Mater. Interfaces, 2010, 2, 748-755.
C. D. Riccardi, H. Yamanaka, M. Josowicz, J. Kowalik, B.
Mizaikoff, C. Kranz, Anal. Chem. 2006, 78, 1139-
1145.
Darder, M.; Blanco, M. L.; Aranda, P.; Leroux, F.; Hitzky,
E. R. Chem. Mater. 2005, 17, 1969-1977.
Liu, T. X.; Phang, I. Y.; Shen, L.; Chow, S. Y.; Zhang, W.
D. Macromolecules 2004, 37, 7214-7222.
Raravikar, N. R.; Schadler, L. S.; Zhao, Y. P.; Wei, B. Q.;
Ajayan, P. M. Chem. Mater. 2005, 17, 974-983.
Du, F. M.; Scogna, R. C.; Zhou, W.; Brand, S.; Fischer, J.
E.; Winey, K. I. Macromolecules 2004, 37, 9048-
9055.
Katz, E.; Willner, I. ChemPhysChem 2004, 5, 1084-1104.
Wang, J. Electroanalysis 2005, 17, 7-14.
Allen, B.; Kichambare, P.; Star, A. Adv. Mater. 2007, 19,
1439-1451.
Ghindilis, A. L.; Atanasov, P.; Wilkins, E. Electroanalysis
1997, 9, 661-674.
Joshi, P. P.; Merchant, S. A.; Wang, Y.; Schmidtke, D. W.
Anal. Chem. 2005, 77, 3183-3188.
Chikkaveeraiah, B. V.; Bhirde, A.; Malhotra, R.; Vyomesh
P.; Silvio Gutkind, J.; Rusling, J. F. Anal. Chem. 2009,
81, 9129-9134.
Wang, Y. D.; Joshi, P. P.; Hobbs, K. L.; Johnson, M. B.;
Schmidtke, D. W. Langmuir 2006, 22, 9776–9783.
Pedrosa, V. A.; Paliwal, S.; Balasubramanian, S.; Nepal,
D.; Davis, V. A.; Wild, J.; Ramanculov, E.; Simonian,
A. L. Colloids and Surf., B 2010, 77, 69-74.
Dumas, D. P.; Wild, J. R.; Raushel, F. M. J. Biol. Chem.
1989, 264, 19659-19665.
BIOFUNCTIONAL INTERFACES FOR BIOSENSING APPLICATIONS
131
