
HEART RATE VARIABILITY IN SIESTA POLYSOMNOGRAMS
A Preliminary Study
Xos
´
e A. Vila
1
, Arturo J. M
´
endez
1
, Abraham Otero
2
, Leandro Rodr
´
ıguez-Li
˜
nares
1
and Mar
´
ıa J. Lado
1
1
Department of Computer Science, ESEI, University of Vigo, Campus As Lagoas s/n, 32004 Ourense, Spain
2
Department of Information and Communications Systems Engineering, University San Pablo CEU, 28668 Madrid, Spain
Keywords:
Sleep apnea, Heart rate variability, HRV, ECG.
Abstract:
Nowadays, sleep apnea is a disease with a high prevalence. Its diagnosis requires to admit the patient in
a hospital sleep unit and to conduct a polysomnography during the night. For this reason, many efforts have
been devoted to alternative techniques to diagnose apnea from other signals, such as ECG or oxygen saturation,
easier to obtain outside a hospital. The aim of this work is to investigate if these recordings behave similar
to overnight ECGs.This paper presents the results of a small study (only 7 patients) conducted on short naps
using heart rate variability (HRV) parameters. The results indicate that the spectral parameters are different
for obstructive sleep apnea (OSA) and healthy patients. Relationship with the apnea/hypoapnea index (AHI)
was also different. This is a promising starting point for more extensive studies in the future.
1 INTRODUCTION
One of the fields where computerized techniques are
becoming increasingly popular is the automated
analysis of physiological signals, such as
electrocardiograms (ECG) (Roche et al., 2003).
Analysis of ECG may provide information related to
different respiratory events, such as obstructive sleep
apnea (OSA), that is characterized by a cessation of
breathing during sleep.
Although precise OSA diagnosis needs a
nocturnal polysomnography, there are evidences that
heart rate variability (HRV) could offer valuable
information in relation with OSA (Penzel et al.,
2003). Spectral analysis of HRV can be a suitable
tool for the detection of OSA, since it may provide
a quantitative analysis and evaluation of the
neurovegetative nervous system. Sympathovagal
balance can be evaluated with the low frequency
(LF) components (ranging from 0.04 to 0.15 Hz) and
the parasympathetic tone can be estimated using the
high frequency (HF) components (greater than 0.15
Hz). Other indexes can be used, such as LF/HF ratio,
which can be used as an indicator of the status of the
neurovegetative control system (Gula et al., 2003;
G
¨
unes et al., 2010). The very low frequency (VLF)
band (0.003-0.04 Hz) has also been used by other
authors (Park et al., 2008).
Over the last decades, an increasing number
of researchers have devoted their efforts to the
automatic detection of OSA. In 2000, the Computers
in Cardiology conference proposed a competition for
classifying potential apneic patients using only the
ECG (Moody et al., 2000). Among the proposed
systems, one was based on the ratio of the content
of two spectral regions between 0.01 to 0.05 Hz, and
between 0.005 and 0.01 Hz (Drinnan et al., 2000),
while another one used an algorithm based on QRS
changes.
Most of the papers cited so far deal with the
diagnosis of nocturnal sleep apnea, usually performed
by means of polysomnography. However, up to now,
no attention has been paid to the apneic events that
can occur during the siesta period, a short nap in the
early afternoon.
Siesta is a Spanish habit that has been proved
to contribute to increase productivity, to improve
alertness and to reduce risk of accidents (Korman
et al., 2007). Furthermore, daytime sleep can lower
blood pressure and provide better cardiovascular
recovery from psychological stress (Brindle and
Conklin, 2011). We think that it can be interesting
to study HRV in this type of recordings in order to
identify apneic events, and to confirm if they behave
in a similar way than overnight polysomnograms.
In this work, we present a preliminary study
of HRV indexes on several siesta ECG recordings
obtained both from apneic and normal subjects.
Spectral parameters LF, HF, LF/HF ratio and VLF
were calculated and analyzed to determine possible
variations during siesta time.
334
A. Vila X., J. Méndez A., Otero A., Rodríguez-Liñares L. and J. Lado M..
HEART RATE VARIABILITY IN SIESTA POLYSOMNOGRAMS - A Preliminary Study.
DOI: 10.5220/0003735703340337
In Proceedings of the International Conference on Bio-inspired Systems and Signal Processing (BIOSIGNALS-2012), pages 334-337
ISBN: 978-989-8425-89-8
Copyright
c
2012 SCITEPRESS (Science and Technology Publications, Lda.)
2 MATERIALS AND METHODS
2.1 Database
Seven ECG recordings selected from the
polysomnographic database of the Sleep Unit of
the University Hospital Complex of Santiago de
Compostela (CHUS) were used. This database was
obtained using a SOMNOscreen
TM
polysomnograph,
built by SOMNOmedics GmbH.
The selected recordings correspond to siestas
taken by patients suffering different levels of apnea,
and by normal, healthy subjects. Average duration
of ECG recordings is 158±52 minutes. Subjects’
mean age is 61.85±5.78 years, average weight is
96.71±18.08 kg, average body mass index (BMI)
is 32.6±4.3 kg/m
2
, and mean apnea/hypopnea index
(AHI) is 35.6±38.3.
2.2 Methods
Apneic and hypoapneic episodes were detected
employing a previously developed algorithm (Otero
et al., 2011). Each recording was divided into
5-minute intervals, being each of them labeled as
normal (NOR) (suffering from respiratory airflow
limitation less than 10% of the interval), borderline
(BDL) (suffering from respiratory airflow limitation
between 10%-20% of the interval), or apneic (APN)
(suffering from respiratory airflow limitation more
than 20% of the interval). A total of 69 5-minute
episodes were labeled as NOR, 60 were considered
to be BDL, and 93 were classified as APN.
Afterwards, beat positions were estimated (Otero
et al., 2009) and instantaneous heart rate was
calculated. Heart rate signal was automatically
filtered and manually checked to remove artifacts
or incorrect values. Then, an interpolation using a
cubic spline algorithm at 4 Hz. was applied and
HRV analysis was performed, employing the RHRV
software (Rodr
´
ıguez-Li
˜
nares et al., 2011). This
software can be freely downloaded from the R-CRAN
repository (http://cran.r-project.org).
From this signal, spectral power was estimated
applying Short-Time Fourier Transform (STFT) using
a Hamming window with mean substraction. Two
different frequency analysis were performed: (1)
using window length and shifting values of 60 and
2 seconds, which provided values for LF and HF
peaks, LF/HF ratio and total power spectrum and (2)
using window length and shifting values of 300 and
10 seconds which yielded the very low frequency
components (VLF peaks). This data were processed
with two different analyses: global and 5-minute
interval analysis.
3 RESULTS
3.1 Global Analysis
For each ECG recording, the previously calculated
spectral parameters were analyzed. Table 1 shows the
results obtained for each recording.
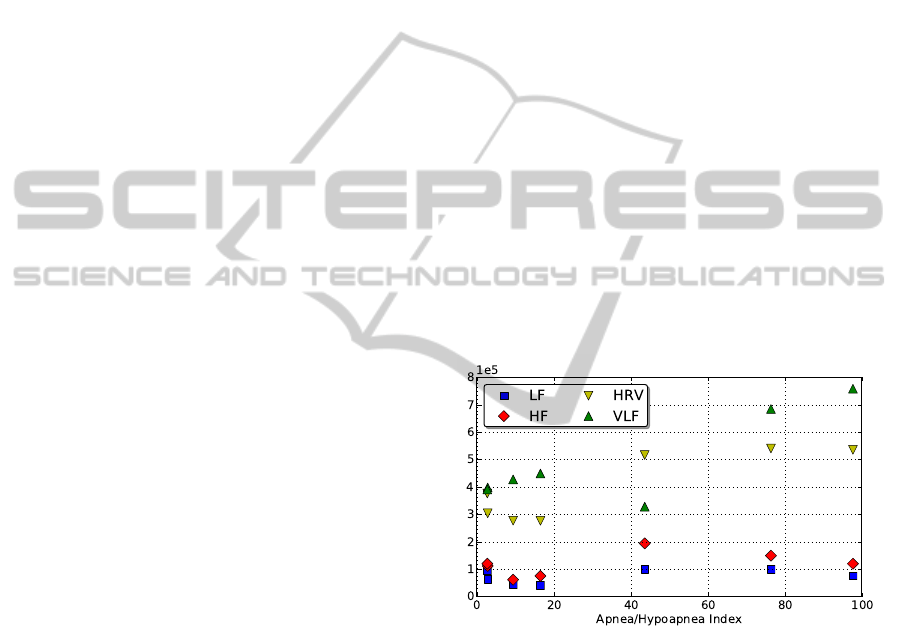
Relationship between spectral parameters and
AHI index were also obtained and represented
in Figure 1. Besides, both correlation and R
2
coefficients and corresponding p-values were also
calculated for the the spectral parameters vs. AHI (see
Table 2). It can be observed that HRV and VLF values
increase with AHI index. However, this effect cannot
be observed for LF and HF parameters, which present
approximately constant values with independence of
the AHI index. This is consistent with the fact
that episode duration for apneic events is around 30
seconds, and this affects heart rate signal in spectral
bands corresponding to VLF values.
Figure 1: Spectral parameters versus AHI.
One conclusion that can be drawn from Table 2,
is that, for VLF and HRV values, the association with
the AHI index is stronger than in the rest of spectral
parameters. In fact, a percentage of 85% for VLF and
87% for HRV are directly related to the AHI index.
Moreover, according to the determination coefficient
R
2
, 67% of VLF values and 70% of HRV values can
be explained in terms of AHI values.
One of the main goals of this work was to test
if OSA patients and healthy subjects show different
spectral parameters in short nap ECG recordings.
To assess this point, polysomnograms were divided
into two groups attending to the AHI value: ECGs
with AHI≤20 (P20, P89, P91 and P94), and with
AHI>20 (P17, P24, and P28). Average values of the
HEART RATE VARIABILITY IN SIESTA POLYSOMNOGRAMS - A Preliminary Study
335
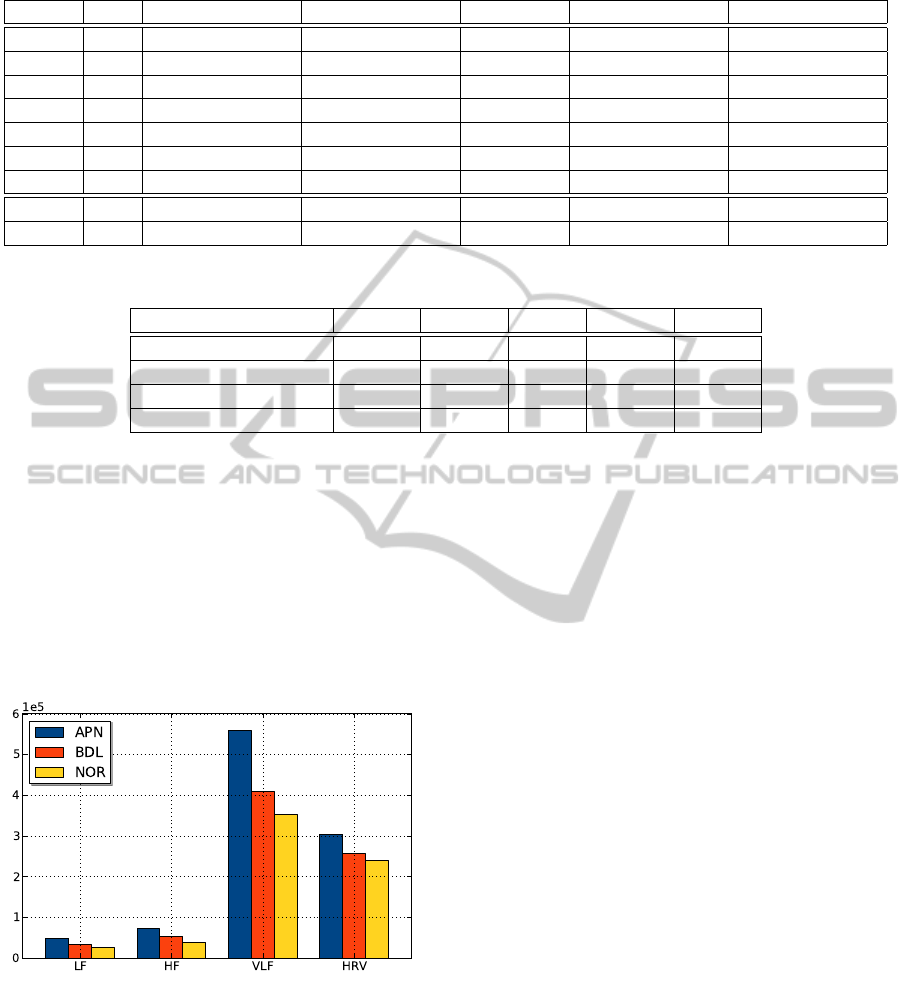
Table 1: Spectral parameters for the ECG recordings and mean values for each patient.
Patient AHI LF HF LF/HF VLF HRV
P17 76.4 100596±40781 149277±52534 0.77±0.44 684936±194697 540531±125789
P20 16.5 41386±26277 75209±26898 0.57±0.32 449147±263491 276512±155409
P24 43.6 101119±116014 194149±199706 0.49±0.22 328105±248998 516604±446838
P28 97.7 75712±34125 119715±62307 0.72±0.32 758674±154819 535527±162262
P89 2.8 62620±37349 111660±28171 0.57±0.34 398049±187583 303736±108416
P91 2.7 94788±52122 119965±35293 0.80±0.54 391216±209751 376232±102424
P94 9.4 45262±24613 61541±20971 0.76±0.39 427871±155148 276887±427871
≤20 58857±41096 88592±36979 0.68±0.42 419218±208201 304463±126673
>20 92743±88118 162923±153428 0.61±0.32 521760±296559 526474±338824
Table 2: Correlation and R
2
coefficients for the spectral parameters vs. AHI.
LF HF LF/HF VLF HRV
Estimate 6.4E-04 3.8E-04 47.24 2.0E-04 2.6E-04
R
2
coefficient 0.02 0.03 -0.17 0.67 0.70
p-value 0.34 0.33 0.75 0.02 0.01
Correlation coefficient 0.42 0.44 0.15 0.85 0.87
spectral parameters were calculated for both groups,
and results are presented in the lower part of Table 1.
These results were also evaluated employing
a t-test that estimates 95% confidence intervals
(95%CIs) and the p-value. Statistically significant
differences were found for all spectral values, being
the p-value<2.2e-16 in all cases. This indicates the
capability of spectral analysis to discriminate between
both types of ECG recordings.
Figure 2: Comparison of episode parameters.
3.2 Five-minute Interval Analysis
As our database contains a low number of ECG
recordings, to increase the number of samples,
recordings were divided into 5-minute intervals. This
allowed to verify if HRV indexes show distinct
behaviour in apneic intervals comparing to the
baseline. Then, statistical analysis was performed,
and the results can be observed in Figure 2 and in
Table 3 for each type of episode.
Statistical analysis was performed to assess
if there were significant differences between
NOR, BDL and APN episodes. Results yielded
p-values<0.001 for LF and HF, while VLF only
discriminates between normal and apneic episodes,
and HRV allows to distinguish between normal
intervals and the two other types. No significant
differences were found when comparing LF/HF ratio
for the three categories of episodes.
4 DISCUSSION
Results suggest a positive correlation between VLF
and HRV indexes and AHI, while other indexes show
low correlation with AHI. Other works also show
correlation between VLF and AHI. Usual duration
of apneic episodes is about 20-40 seconds, which
corresponds to a range of 0.025-0.05 Hz. Then, a
sequence of apneic episodes modulates the heart rate
signal, affecting its spectrum, mainly in the VLF
band, since frequency range of this band matches the
range of typical apneic episodes. As the VLF band
usually carries more power than LF and HF bands,
global HRV power presents a similar correlation with
AHI. Although all HRV indexes show higher values
in apneic patients than in healthy subjects (only the
LF/HF ratio decreases), conclusions must be drawn
with caution due to the scarcity of data. Nevertheless,
our experiments gave results similar to other authors’
(Park et al., 2008; Roche et al., 2003).
BIOSIGNALS 2012 - International Conference on Bio-inspired Systems and Signal Processing
336

Table 3: Results of the 5-minute interval analysis.
EPISODE LABEL LF HF LF/HF VLF HRV
APN 48234±25319 72448±34804 0.69±0.29 558386±342620 303962±71490
BDL 34327±22208 53066±26431 0.65±0.41 409091±319387 256597±97733
NOR 25319±14824 38920±15508 0.63±0.19 352645±177317 239728±82953
We compared HRV indexes in segments with
and without apneic episodes using a 5-minutes
interval analysis. Results show an increase in all
indexes in apneic segments. Borderline segments,
corresponding to intervals with few apneic events,
give intermediate HRV indexes (bigger than normal
intervals and lower than apneic ones). We have
not found a similar analysis in the literature, but,
if we identify borderline intervals as “mild” apnea
intervals, our results could be compared with the
ones from (Gula et al., 2003; Park et al., 2008) that
show increments in HRV indexes in “severe” apneic
patients, compared to “mild” ones.
5 CONCLUSIONS
In this paper we present a preliminary study of apneic
patients by means of HRV using polysomnograms
acquired during siesta time. Results indicate
variations in some spectral indexes when apneic
events are present, as observed in other overnight
studies. This is an interesting result because it could
allow to significantly increase the number of patients
under observation in a sleep unit.
Although results related to the ECG siesta
recordings are promising, we must be cautious since
a more exhaustive analysis should be performed.
However, results presented in this paper suggest the
possibility of identifying apneic events in daytime
sleep, thus allowing the clinicians to use automated
systems to detect apnea in short naps.
ACKNOWLEDGEMENTS
This work has been supported by Xunta de Galicia
(PGIDIT06SIN30501PR) and the Spanish MEC and
European FEDER (TIN2009-14372-C03-03).
REFERENCES
Brindle, R. and Conklin, S. (2011). Daytime
sleep accelerates cardiovascular recovery after
psychological stress. Int J Behav Med (published
online).
Drinnan, M., Allen, J., Langley, P., and Murray, A. (2000).
Detection of sleep apnoea from frequency analysis of
heart rate variability. In Computers in Cardiology
2000, pages 259–262.
Gula, L. J., Krahn, A. D., Skanes, A., Ferguson, K. A.,
George, C., Yee, R., and Klein, G. J. (2003). Heart rate
variability in obstructive sleep apnea: a prospective
study and frequency domain analysis. Ann Noninvas
Electro, 8(2):144–149.
G
¨
unes, S., Polat, K., and Yosunkaya, S. (2010). Multi-class
f-score feature selection approach to classification of
obstructive sleep apnea syndrome. Expert Syst Appl,
37(2):998 – 1004.
Korman, M., Doyon, J., Doljansky, J., Carrier, J., Dagan,
Y., and Karni, A. (2007). Daytime sleep condenses
the time course of motor memory consolidation. Nat
Neurosci, 10(9):1206–1213.
Moody, G., Mark, R., Goldberger, A., and Penzel, T.
(2000). Stimulating rapid research advances via
focused competition: the computers in cardiology
challenge 2000. In Computers in Cardiology 2000,
volume 27, pages 207–210. Ieee.
Otero, A., Dapena, S. F., F
´
elix, P., Presedo, J., and Tarasco,
M. (2009). A low cost screening test for obstructive
sleep apnea that can be performed at the patient’s
home. In Proceedings IEEE ISP, pages 199–204.
Otero, A., F
´
elix, P., and
´
Alvarez, M. (2011). Algorithms
for the analysis of polysomnographic recordings with
customizable criteria. Expert Syst Appl, 38(8):10133
– 10146.
Park, D.-H., Shin, C.-J., Hong, S.-C., Yu, J., Ryu, S.-H.,
Kim, E.-J., Shin, H.-B., and Shin, B.-H. (2008).
Correlation between the severity of obstructive sleep
apnea and heart rate variability indices. J Korean Med
Sci, 23(2):226–231.
Penzel, T., Kantelhardt, J. W., Grote, L., Peter, J.-H.,
and Bunde, A. (2003). Comparison of detrended
fluctuation analysis and spectral analysis for heart rate
variability in sleep and sleep apnea. In IEEE Trans
Biomed Eng, volume 50, pages 1143–1151.
Roche, F., Pichot, V., Sforza, E., Court-Fortune, I.,
Duverney, D., Costes, F., Garet, M., and Barth
´
el
´
emy,
J. C. (2003). Predicting sleep apnoea syndrome from
heart period: a time-frequency wavelet analysis. Eur
Respir J, 22(6):937–942.
Rodr
´
ıguez-Li
˜
nares, L., M
´
endez, A., Lado, M., Olivieri,
D., Vila, X., and G
´
omez-Conde, I. (2011). An open
source tool for heart rate variability spectral analysis.
Comput Meth Prog Bio, 103(1):39 – 50.
HEART RATE VARIABILITY IN SIESTA POLYSOMNOGRAMS - A Preliminary Study
337
