
THE DESIGN OF AN AUTONOMIC CONTROLLER FOR
SELF-MANAGED EMERGENCY DEPARTMENTS
Serene Almomen
1
and Daniel A. Menasc´e
2
1
Volgenau School of Engineering, George Mason University, 4400 University Drive, Fairfax,VA 22030, U.S.A.
2
Department of Computer Science, George Mason University, 4400 University Drive, Fairfax,VA 22030, U.S.A.
Keywords:
Autonomic computing, Healthcare, Emergency department, Quality of service, Length of stay, Self-managed
system, Simulation, Combinatorial search.
Abstract:
Improving the operational efficiency of an Emergency Department (ED) is a complex task due the very large
number of ED configurations that involve human and physical resources and due to the unpredictable nature
of the ED’s workload. Thus, managing the performance of EDs becomes difficult and expensive when carried
out by human beings alone. A new approach, called self-managed EDs, consists of building into the ED the
mechanisms required to self-adjust the ED’s configuration parameters so that its Quality of Service (QoS) is
constantly met. This paper presents the design of an autonomic controller for a self-managed Emergency De-
partment and evaluates its effectiveness in maximizing a utility function of the ED subject to cost-constraints.
The controller uses a combination of combinatorial search techniques with simulation models. Experimental
results illustrate the operation of the controller and how it reacts to variations of patient interarrival times.
1 INTRODUCTION
In hospitals all over the country, healthcare Emer-
gency Departments are known to be dynamic in na-
ture making them complex environments to manage.
The complexity stems from the sudden changes to the
workload of an ED due to emergencies such as fire,
natural disasters, and terrorist attacks that are hard to
predict. An ED consists of both human (e.g., doctors,
nurses, and technicians) and physical (e.g., X-ray ma-
chines and CT-scan) resources and is one of the most
critical units in any healthcare organization. Therfore,
it is vital to improve its efficiency to increase patient
satisfaction and reduce operational cost.
Quality improvement principles and benchmark-
ing for EDs are increasingly becoming important for
the success of hospitals. Emergency physicians and
nurses are now being asked to provide safe, timely,
efficient, and cost-effective care. Many QoS metrics
are currently being collected at EDs to proactively as-
sess performance and identify opportunities for qual-
ity improvement. These QoS metrics, also known as
Core Measures, can be time measures or proportion
measures (Welch et al., 2006). Time measures in-
clude arrival time to first seen by a doctor, disposi-
tion to discharge, and overall patient length of stay
(LOS). Proportion measures include things like num-
ber of patients who left before they were supposed to,
hospital diversion, and ED patient flow (ACEP,2010).
It is widely known that EDs suffer from crowding
problems that impact the performance and QoS pro-
vided to patients. Many studies have been conducted
to find the cause of crowding in EDs and some solu-
tions have been suggested. For example, calculus and
chaos theory have been used to model ED crowding
and to identify variables and formulas that can pre-
dict when orderly patient flow succumbs to crowd-
ing (Fields, 2003). In a related attempt, Asplin et.
al. (Asplin et al., 2003) present a conceptual model
that partitions ED crowding into three interdependent
components(input, throughput, and output) which ex-
ist within an acute care system that delivers unsched-
uled care. The goal of this model is to provide a prac-
tical framework to faciliate ED crowding solutions.
Another study used both log-rank tests and time-to-
wait (survival) proportional-hazard regression mod-
els to determine variables affecting ED QoS metrics
such as door-to-doctor and dwell times (Arkun et al.,
2009). Results showed that factors such as triage cat-
egory, ED occupancy, and day of the week contribute
to decreased patient flow through the ED. Roberts
et. al. suggest the use of simulation modeling com-
bined with Six Sigma techniques to address issues of
length of stay (LOS) and patient satisfaction in the
174
Almomen S. and A. Menascé D..
THE DESIGN OF AN AUTONOMIC CONTROLLER FOR SELF-MANAGED EMERGENCY DEPARTMENTS.
DOI: 10.5220/0003737201740182
In Proceedings of the International Conference on Health Informatics (HEALTHINF-2012), pages 174-182
ISBN: 978-989-8425-88-1
Copyright
c
2012 SCITEPRESS (Science and Technology Publications, Lda.)

ED (Roberts et al., 2006).
Managing the performance of complex environ-
ments, such as an ED, is difficult and expensive when
carried out by human beings alone. A new approach,
called self-managed ED, is discussed here. The pa-
per discusses the mechanisms required to self-adjust
the configuration parameters of an ED so that its QoS
goals are constantly met. In (Almomen and Menasc´e,
2011) we discussed the potential benefits of apply-
ing autonomic computing (Huescher and McCann,
2008) techniques to design self-managed EDs. In
this paper we provide a detailed design of an au-
tonomic controller for a self-managed ED. Our ap-
proach combines an ED simulator with combinatorial
search techniques (Rayward-Smith et al., 1996) to de-
sign controllers that run periodically (e.g., every few
hours) to determine the best possible configuration
for an ED given its current and predicted workload.
The paper also demonstrates the operation of the au-
tonomic controller as it maximizes a utility function
of the ED subject to cost-constraints.
The rest of the paper is organized as follows. Sec-
tion 2 presents the architecture and the algorithm used
by the ED controller of the self-managed ED. Section
3 presents the experimental setting and the next sec-
tion describes the results under various circumstances
to illustrate the operation of the method. Finally, Sec-
tion 5 presents some concluding remarks.
2 CONTROLLER APPROACH
Our framework, discussed initially in (Almomen and
Menasc´e, 2011), consists in developing an autonomic
controller for a self-managed ED system that can reg-
ulate and maintain itself with minimal human inter-
vention. This is ideal in an ED environment since the
goal is to create a system that is able to adapt to a con-
stantly changing environment (such as patient flow,
workload, and resource availability) in a way that pre-
serves given operational goals (such as performance
goals or QoS goals).
2.1 The Control Loop
This framework, implements the MAPE-K (Monitor/
Analyze/ Plan/ Execute - Knowledge)model (Kephart
and Chess, 2003) in an ED environment as shown
in Fig. 1. Within the ED context, autonomic man-
agers define a control loop (the MAPE-K loop) that
continuously monitor the environment and handles
events that need action to be taken. Changes are
made through action operations. Sensors determine
the state of the managed ED resources and action
operations may change the current state. The entire
ED environment is a set of managed resources (e.g.,
doctors, nurses, lab technicians, X-ray machines, CT-
scan machines, beds). Autonomic managers contin-
uously monitor the system and record the values of
various performance metrics (e.g., Length of Stay,
throughput, and utilization of various resources). A
group of stakeholders (e.g., managers and executives)
define a utility function to be maximized. This func-
tion measures how well the ED is meeting its goals
and is a function of its various performance metrics.
For example, the utility of the ED decreases as the
Length of Stay (LOS) increases and increases as its
throughput increases. Based on the defined utility
function, the autonomic manager then plans and ex-
ecutes any specific actions needed to maximize the
utility function and optimize pertinent QoS metrics.
The steps of monitoring, analyzing, planning, and ex-
ecuting may be executed concurrently.
It is worth noting that our model takes into account
the Human-in-the-loop(HITL) element (Parasuraman
et al., 2000) (see Fig. 1). This means that in order for
the ED autonomic manager to work sucessufully, hu-
man interaction is required. The resource in charge of
managing the ED, such as a charge nurse, will be part
of the decision making process of the autonomic man-
ager and will be able to change the outcome, or re-
configuration commands, of the autonomic manager.
HITL is important in our model because we realize
that in the ED, an expert nurse can influence the out-
come of the system in a way that is difficult if not im-
possible to autonomically reproduce exactly. HITL in
the ED environment also readily allows for the iden-
tification of problems and requirements that may not
easily be identified by other means of the system. Uti-
lizing HITL provides a more realistic implementation
approach to a self-managed ED.
2.2 Architecture of the Controller
Figure 2 shows details of the autonomic manager in
an ED. The ED autonomic manager is based on the
notion that the ED is enhanced with an ED controller
that monitors the ED performance, monitors the re-
source utilization of the various resources of the ED,
and executes, at regular intervals called controller in-
tervals (CI), a controller algorithm to determine the
best configuration for the ED. As a result of running
the controller algorithm, reconfiguration options are
generated that will help charge nurses change the ED
configuration to maintain optimal QoS. As shown in
Fig. 2, the ED controller has four main components:
Utility Function Computation, ED Simulator, Work-
load Analyzer, and Controller Driver.
THE DESIGN OF AN AUTONOMIC CONTROLLER FOR SELF-MANAGED EMERGENCY DEPARTMENTS
175
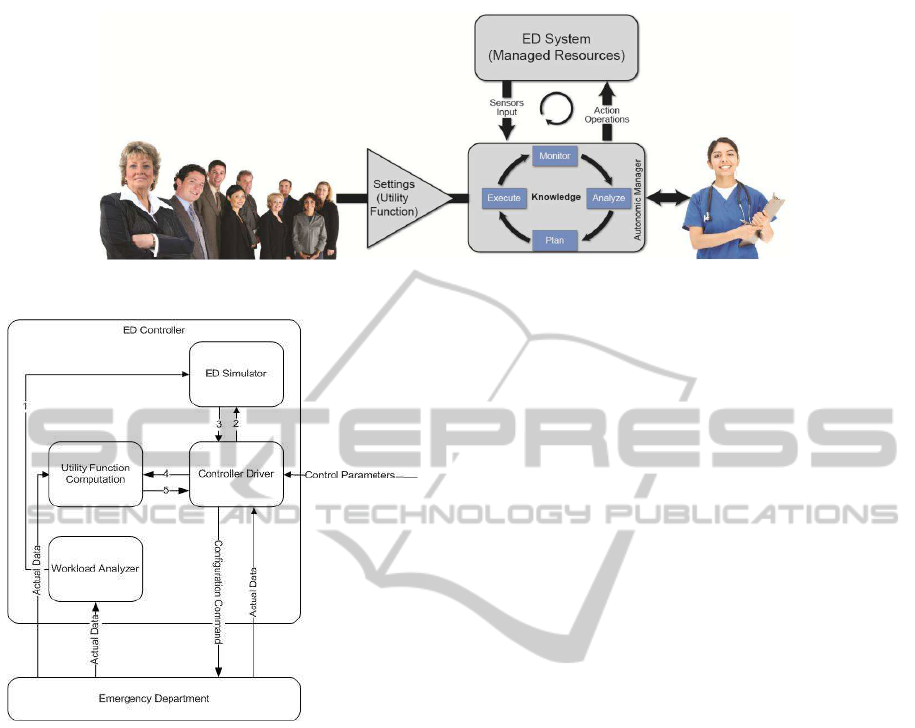
Figure 1: ED Autonomic Control Loop.
Figure 2: Architecture of the Autonomic Controller for the
ED.
The Utility Function Computation component col-
lects QoS metrics from the ED, such as resource uti-
lization and patient length of stay (LOS), to compute
the ED utility functions. The utility function is the
goal to be optimized by the controller. The Workload
Analyzer component analyzes the stream of arriving
patients and forecasts the workload intensity values
(e.g., average arrival rates) for the forthcoming peri-
ods. The predicted workload intensity values(1) com-
puted by this component are used as input parameters
to the ED Simulator. The ED Simulator receives re-
quests (2) from the Controller Driver to run the ED
Simulator corresponding for a specific configuration
of the ED. The ED Simulator takes as input parame-
ters configuration parameter values (2), and worload
intensity values (1). The output of the ED Simulator is
a resulting set of QoS values (3) for the configuration
used as input by the Controller Driver. The Controller
Driver then sends a request (4) to the Utility Function
Computation component to compute the value of the
utility function for the QoS values obtained from the
ED Simulator. The corresponding value of the util-
ity function (5) is returned to the Controller Driver.
This last two steps are repeated for every point in each
neighborhood visited by the Controller Driver, which
executes a combinatorial search algorithm to deter-
mine the optimal configuration for the ED.
At the begining of each controller interval, the
Controller Driver runs the combinatorial search en-
gine, which takes into account the desired utility func-
tion and performs a combinatorial search (e.g., beam
search or hill-climbing) (Rayward-Smith et al., 1996)
of the state space of possible configuration points in
order to find a near-optimal configuration. The QoS
values have to be computed by the ED simulator for
each point in the space of configuration points exam-
ined by the Controller Driver. Once the Controller
Driver determines the best configuration for the work-
load intensity levels provided by the Workload Ana-
lyzer, it sends reconfiguration commands to the ED.
The Control Parameters shown in Fig. 2 provide
for Controller Driver’s settings such as the maximum
number of configuration points to be searched before
the search engine stops and the length of the controller
interval (CI).
2.3 Combinatorial Search Engine
This section describes the combinatorial search al-
gorithm used by the ED Controller. This algo-
rithm, which is based on hill-climbing (Rayward-
Smith et al., 1996), is used to obtain a near-optimal
configuration
~
C = (c
1
,...,c
p
) for the ED without per-
forming an exhaustive search of the space of all pos-
sible configurations.
We consider that the patients that arrive at the ED
are categorized into tracks according to the resources
they need and their workflow through the ED.
Let
~
W be the vector of workload intensity (e.g.,
patient average arrival rate) values for each track. Let
~
C
curr
be the vector of current configuration parameters
for the ED and let
~
C
fin
be the vector of final configu-
HEALTHINF 2012 - International Conference on Health Informatics
176

ration parameters for the ED determined by the com-
binatorial search algorithm. In the example described
here, a configuration vector
~
C is a tuple (n,d,t) where
n is the number of nurses, d the number of doctors,
and t the number of lab technicians.
Let U(
~
Q) = f(
~
W ,
~
C) be the value of the utility of
the ED as a function of a vector
~
Q of QoS values for
the ED. The values in
~
Q for a given configuration
~
C
and workload intensity vector
~
W are computed by a
function f, which implements a simulation of the ED.
In the example presented in this paper, we use LOS as
the single QoS metric. Thus,
~
Q = (LOS).
The utility function, U(LOS), used in this paper
follows a sigmoid curve of the type
U(LOS) = K
e
α (β−LOS)
1+ e
α (β−LOS)
(1)
where K is a normalizing factor equal to
K = (1+ e
αβ
)/e
αβ
(2)
and β is the QoS goal for the LOS, which is equal to
90 minutes in our experiments, and α is a sensitivity
parameter that defines the sharpness of the curve. Sig-
moids are commonly used as utility functions when
the QoS metric is LOS or response time. We used
α = 0.05 in our experiments. Note that the utility is a
dimensionless quantity in the interval [0, 1].
Figure 3 depicts U(LOS) according to Eq. (1) and
the parameters defined above. As it can be seen, the
utility is 1 when the LOS is zero. As the LOS in-
creases, the utility decreases asymptotically to zero.
When the LOS is equal to its QoS goal, the utility is
equal to 0.5. Note that any other utility function de-
fined by the stakeholders could be used.
0.0
0.1
0.2
0.3
0.4
0.5
0.6
0.7
0.8
0.9
1.0
0
40
80
120
160
200
Utility
Length of Stay (in minutes)
Figure 3: Utility as a function of Length of Stay (in min-
utes).
Each configuration
~
C has a cost C (
~
C) associated
to it. The optimization problem implemented by the
combinatorial search engine can be formally defined
as
Maximize U(LOS) = f(
~
W ,
~
C)
s.t.
C (
~
C) ≤ COST
max
c
min
1
≤ c
1
≤ c
max
1
···
c
min
p
≤ c
p
≤ c
max
p
Hill-climbing works by analyzing the neighboring
configurations of a configuration being visited, deter-
mining the one with the highest utility, and moving
to that point as the next point to visit. Let N (
~
C) be
the set of neighbors of configuration
~
C in the space of
possible configurations for the ED.
Typically, a neighbor of a given configuration is
defined by a small perturbation in one of the elements
of that configuration (e.g., increasing or decreasing
by one the number of nurses of a given type). In
our example, the neighbors of a configuration (n,d,t)
are (n ⊕ 1, d,t), (n⊖ 1,d,t), (n,d ⊕ 1,t), (n, d ⊖ 1,t),
(n,d,t ⊕ 1), and (n, d,t ⊖ 1). The operator ⊕ is de-
fined as x ⊕ 1 ← x + 1 if x < x
max
else x ← x
min
. In
other words, the addition wraps around to x
min
. Sim-
ilarly, ⊖ is defined as x ⊖ 1 ← x − 1 if x > x
min
else
x ← x
max
.
The search engine algorithm is given below.
• Step 1: (Initialization): NumIterations ← 0;
~
C ←
~
C
curr
; U ← f(
~
W ,
~
C).
• Step 2: Find the configuration
~
C
max
that has the
largest utility among the configurations in {
~
C ∈
N (
~
C) | C (
~
C) ≤ COST
max
}.
• Step 3: U
max
← f(
~
W ,
~
C
max
)
• Step 4: If U
max
> U then
{
~
C ←
~
C
max
;
U ← U
max
}
Else {
~
C
fin
←
~
C; Stop};
• Step 5: NumIterations ← NumIterations + 1;
• Step 6: If NumIterations < MaxIterations then go
to Step 2 else
~
C
fin
←
~
C.
The function f, i.e., the ED simulation, has to be
run as many times as the number of points visited in
the search space. This number is roughly equal to
MaxIterations ×
¯
N, where
¯
N is the average size of a
neighborhood of a point in the configuration space.
Assuming that each of the p parameters of a point
in the configuration space can vary in two possible
ways,
¯
N can be estimated as 2× p. One can reduce
the number of times the simulation has to be run by
THE DESIGN OF AN AUTONOMIC CONTROLLER FOR SELF-MANAGED EMERGENCY DEPARTMENTS
177
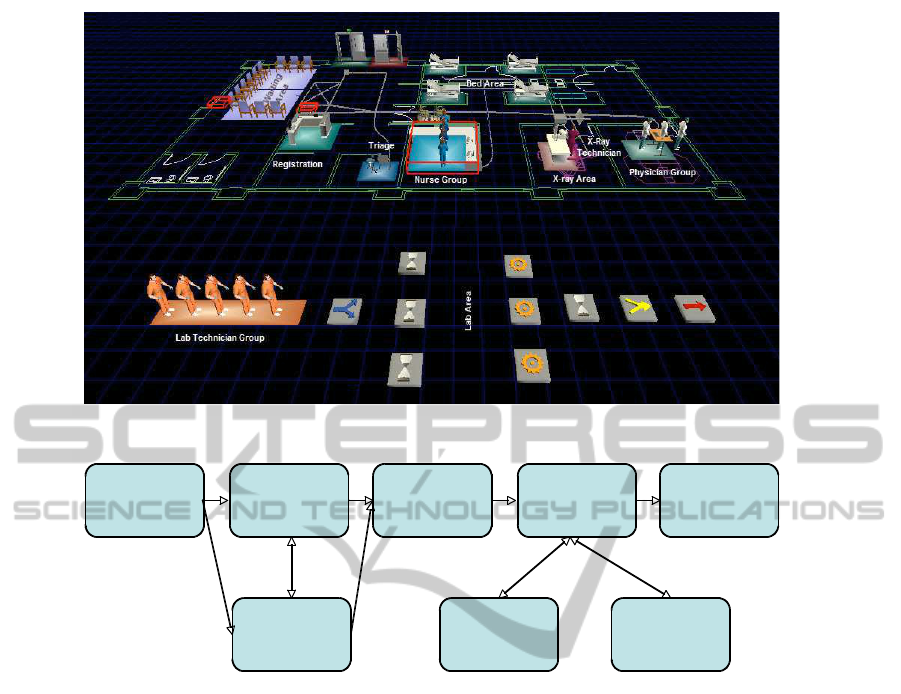
Figure 4: Simulated Emergency Department.
Patient Arrival
Area
Registration
Area
Triage
Area
Bed
Area
Patient
Exit Area
Waiting
Room Area
X-Ray
Area
Lab
Area
Figure 5: ED Model - Patient Workflow.
storing the results of simulation runs in a hash table
indexed by the configuration. This avoids re-running
the simulation when a point is visited more than once,
which occurs when neighborhoods overlap.
3 THE EXPERIMENTAL
SETTING
In order to illustrate the operation of the controller de-
scribed above, we developed an ED simulation model
combined with a combinatorial search technique. Our
experiment uses Flexsim HC Simulation Software
(see www.flexsim. com/products/healthcare/) to sim-
ulate an Emergency Department (ED) that consists of
a finite number of resources including beds, nurses,
doctors, lab technicians, imaging machines, and labs
(see Fig. 4). No patient is rejected from being seen
in the ED. Arriving patients are required to register at
check in.
A triage nurse performs a preliminary assessment
of each ED patient. If no nurse is available, the patient
waits in the waiting area. After triaging, an available
staff nurse escorts the patient to the treatment area of
the ED. If the treatment area is full, the patient waits
in the triage area until the next room is available. In
the treatment area, the patient is seen by a physician
and a staff nurse for diagnosis. The ED patient flow
is depicted in Fig. 5. Our experiment considers three
patient tracks. A track is an easy way to break patients
into different types that define possible pathways in
the course of an ED visit. The different tracks are
identified by the type of tests and/or screening, if any,
the patient will need to take.
More specifically, the tracks considered here are:
• Basic: Patients in this track are discharged after
being treated without the need for X-Ray screen-
ing or lab tests.
• X-Ray: Patients in this track need X-Ray screen-
ing before being discharged.
• X-Ray and Lab Test: Patients in this track need
both X-Ray screening and three lab tests before
being discharged.
The length of stay (LOS) for each patient can
HEALTHINF 2012 - International Conference on Health Informatics
178

Table 1: Initial Resource Settings.
Resource Value
Nurse group 4
Physician group 3
Lab Technician group 5
X-ray Technician group 1
Bed 4
X-ray machine 1
Labs 3
Table 2: Workload characteristics for the three tracks for
experiments 1 and 2.
Track Routing Interarrival
Probability Time (min)
Experiment 1
Basic 60% 40
X-ray 20% 45
X-Ray & Lab Test 20% 50
Experiment 2
Basic 60% 30
X-ray 20% 35
X-Ray & Lab Test 20% 40
therefore be broken down into the waiting time at the
waiting area, triage station, treatment area, and X-Ray
or Lab (if required). Again, the LOS is the QoS met-
ric measured in our experiment and used to calculate
the utility function U(LOS) to determine the optimal
configuration of the ED. Additionally, we run the sim-
ulation with two different interarrival times (low and
high intensity) and compare the results of the opti-
mal ED configuration to illustrate our approach under
varying interarrival times. The intearrival times and
patient routing probabilities for the different tracks in
each experiment are shown in Table 2.
In our experiment, we also assume that the num-
ber of X-ray technicians, beds, X-ray machines and
labs is constant. Thus, the three configurable param-
eters to be changed by the contorller are the values of
n, d, and t. The configurable parameters (n,d,t) of
the ED simulator are consequently adjusted dynam-
ically at the end of every controller interval so that
the utility is maximized. In addition, COST
max
is set
as $6,000.00/hr based on the following industry av-
erage fully loaded hourly rates: $75.00/hr for nurses,
$250.00/hr for ED doctors, $30.00/hr for lab techni-
cian. In Flexsim Simulation, the Staffing Cost is cal-
culated as:
∑
∀ staff
StaffPayRate ×(StaffTravelTime+
StaffServiceTime). (3)
According to Eq. (3), the hourly cost of the ED is
a function of the time spent by its staff serving pa-
tients and therefore a function of the patient vol-
ume (Bamezai et al., 2005).
The initial values of the resources are shown in
Table 1. The configurable parameters of the tuple
(n,d,t) are also limited by the following [min, max]
values:
• Nurse: n ∈ [2,4]
• Physician d ∈ [1,3]
• Technician t ∈ [3,5]
Consequently the state space of possible configu-
rations consists of N × D× T points where N,D, and
T are, respectively, the possible number of nurses,
physicians, and technicians. In our small example,
the size of the state space is 3 × 3× 3 = 27. In gen-
eral, the state space can be much larger as the number
of controllable resources and the number of possible
instances of these resources grows.
4 RESULTS
This section shows the results of the execution of the
first two iterations of the ED controller algorithm dis-
cussed in section 2.3 for two experiments that have
different interarrival times for the three tracks (see Ta-
ble 2). The percentage of patients in each track is the
same in both experiments but the interarrival times are
lower for experiment 2, which indicates a higher traf-
fic intensity. The warmup time for the experiments
was set to 60 minutes and the ED simulator simulates
24 hours, or a full day, in the modeled ED. Each con-
figuration point was replicated 40 times in the simu-
lator to achieve maximum accuracy and repeatability.
Simulation results are reported with 95% confidence
intervals. We assume that COST
max
= $6,000.00/hr.
Table 3 shows the results of the controller’s first it-
eration for Experiment 1 (total arrivalrate of about 1.4
patients/hr) using the controller algorithm discussed
above. Based on the algorithm, the optimal U(LOS)
value for this iteration is for configuration (4, 2,5).
However, due to the COST
max
constraint of $6,000/hr,
this configuration is not feasible according to Eq. (3).
Consequently, based on both the U(LOS) value and
theCOST
max
constraint, the optimal ED configuration
is actually (3, 3,5), which means three nurses, three
doctors, and five lab technicians. Using this new con-
figuration as the starting point for the second iteration
(Iteration 1) of Experiment 1, we obtain the values
in Table 4. The table shows that the optimal config-
uration for the ED remains at (3, 3,5) with a cost of
$5,785.00/hr. The average LOS for this configuration
is 54 minutes and the 95% confidence interval for the
LOS is [51 minutes, 57 minutes].
THE DESIGN OF AN AUTONOMIC CONTROLLER FOR SELF-MANAGED EMERGENCY DEPARTMENTS
179

Table 3:
~
C
0
, LOS, utility values, and cost for experiment 1.
n d t LOS (min) U(LOS) Cost ($/hr) Feasible
4 3 5 56± 3.5 0.963 $6,044.00 ×
3 3 5 54± 3.0 0.967 $5,785.00 X
2 3 5 66± 5.5 0.939 $6,155.00 ×
4 2 5 53± 2.5 0.968 $6,027.00 ×
4 1 5 58± 3.5 0.959 $4,951.00 X
4 3 4 59± 4.5 0.957 $5,993.00 X
4 3 3 57± 3.5 0.961 $5,971.00 X
Table 4:
~
C
1
, LOS, utility values, and cost for experiment 1.
n d t LOS (min) U(LOS) Cost ($/hr) Feasible
3 3 5 54± 3.0 0.868 $5,785.00 X
2 3 5 66± 5.5 0.777 $6,155.00 ×
4 3 5 56± 3.5 0.855 $6,044.00 ×
3 2 5 58± 3.5 0.841 $5,357.00 X
3 1 5 58± 3.5 0.841 $6,003.00 ×
3 3 4 57± 3.5 0.848 $6,053.00 ×
3 3 3 55± 3.5 0.861 $6,061.00 ×
Experiment 2 has an increased total workload in-
tensity of about 1.8 patients/hr. Iteration 0 of the ED
Controller for this experiment suggests an optimal
configuration of (4, 1,5) with a cost of $5,975.00/hr
(see Table 5). Iteration 1 provides an improved con-
figuration of (3,1, 5) with a cost of $5,521.00/hr (see
Table 6). The average LOS for this configuration is 79
minutes and the 95% confidence interval for the LOS
is [69 minutes, 89 minutes]. Note that the 95% con-
fidence interval for the (4, 1,5) configuration is [76
minutes, 96 minutes]. These two configurations are
not statistically different in terms of LOS at the 95%
level because the average LOS of one configuration
falls in the confidence interval of the other and vice
versa (Jain, 1991). However, configuration (3,1,5) is
preferable because it uses one less nurse and is less
expensive.
Figure 6 shows other details for the optimal con-
figuration for Experiment 2: patient throughput per
track (i.e., number of patients in each track processed
by the ED during the day), the evolutionof throughput
over time, the evolution of the number of patients in
each track at each hour of the day, and the utilization
of various resources (nurse group, physician group,
X-ray technicians, and lab technicians).
As shown in Table 7, the ED Controller was able
to find an optimal configuration in Experiment 1 that
consists of only one nurse less than the maximum
number of nurses available and has an average LOS
that is lower than the desired LOS of 90 minutes. The
cost of this configuration is 4% lower than the initial
configuration that uses the maximum ED resources.
The ED Controller was able to find in the second
iteration of Experiment 2 an optimal configuration for
the higher intensity workload that is still below the
desired LOS goal and at the same time allows a 27%
cost saving with respect to the cost $7,588.00 of the
initial configuration (4,3,5) for that experiment (see
Table 5).
We only showed two iterations of the controller
in this paper to illustrate its operation. In practice,
the controller will run until the maximum number of
iterations is achieved or until it cannot find a better
solution.
5 CONCLUDING REMARKS
Deciding on the best ED configuration given the
ED resource limitations, cost constraints, and unpre-
dictable workload is a complex task. It is extremely
difficult for human beings to solve problems of such
complexity. Consequently, using the proposed self-
managed ED to assist charge nurses with the decision
making process and managing EDs efficiently may
prove to be advantageous.
This paper provides a novel use for a controller-
based autonomic system to implement a self-managed
ED that can help improve the ED’s performance. This
autonomic system is effective in providing best con-
figuration parameters for EDs subject to cost con-
straints and varying workloads. The experiments re-
ported in this paper clearly show the effectiveness of
combining combinatorial search techniques with sim-
HEALTHINF 2012 - International Conference on Health Informatics
180
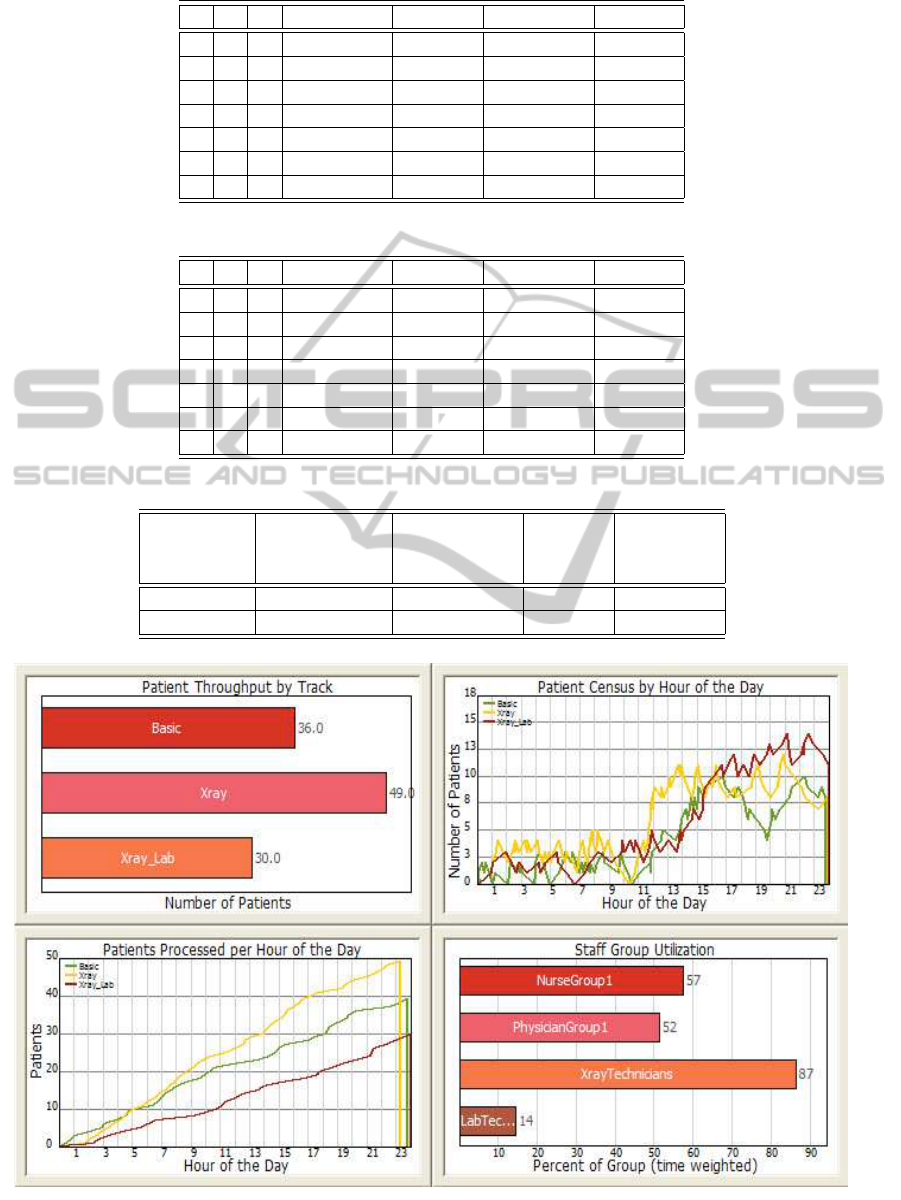
Table 5:
~
C
0
, LOS, utility values, and cost for experiment 2.
n d t LOS (min) U(LOS) Cost ($/hr) Feasible
4 3 5 81± 8.5 0.617 $7,558.00 ×
3 3 5 80± 7.7 0.629 $7,468.00 ×
2 3 5 114± 13 0.234 $7,642.00 ×
4 2 5 92± 14 0.480 $7,511.00 ×
4 1 5 86± 10 0.556 $5,975.00 X
4 3 4 87± 8.5 0.543 $7,683.00 ×
4 3 3 87± 11 0.543 $7,469.00 ×
Table 6:
~
C
1
, LOS, utility values, and cost for experiment 2.
n d t LOS (min) U(LOS) Cost ($/hr) Feasible
4 1 5 86± 10 0.556 $5,975.00 X
3 1 5 79± 10 0.641 $5,521.00 X
2 1 5 100± 12 0.382 $5,205.00 X
4 3 5 81± 8.5 0.617 $7,558.00 ×
4 2 5 92± 14 0.480 $7,511.00 ×
4 1 4 83± 9.5 0.593 $5,315.00 X
4 1 3 90± 13.5 0.506 $5,434.00 X
Table 7: Comparison of experiments 1 and 2.
Experiment Optimal Con-
figuration
(n,d,t)
LOS (in min) U(LOS) Cost ($/hr)
1 (3,3,5) 54 ± 3 0.868 $5,785.00
2 (3,1,5) 79 ± 9 0.641 $5,521.00
Figure 6: Experiment 2 - ED Optimal Configuration QoS.
THE DESIGN OF AN AUTONOMIC CONTROLLER FOR SELF-MANAGED EMERGENCY DEPARTMENTS
181

ulation models when used for QoS control. Not only
is the controller able to find the optimal configuration,
but it does fast enough to afford its utilization in real-
world settings to maintain optimal ED QoS metrics.
In fact, simulating 40 replicas of one configuration
takes approximately 70 seconds on a 1.73-GHz Intel
Core i7 processor.
We are currently working on implementing the re-
sults of this paper in a real-world ED and analyzing
the controller’s effectiveness under cost constraints
and actual varying patient arrival rates.
ACKNOWLEDGEMENTS
The authors would like to thank FlexSim Software
Products, Inc. for providing the FlexSim Healthcare
Simulation software to complete this research. In par-
ticular, the support of Mr. Roger Hullinger and his
team at FlexSim Software Products is highly appreci-
ated.
REFERENCES
ACEP (2010). Meeting the challenge of emergency de-
partment overcrowding/boarding. American College
of Emergency Physicians.
Almomen, S. and Menasc´e, D. (2011). An autonomic com-
puting framework for self-managed emergency de-
partments. In International Health Informatics Con-
ference, Rome.
Arkun, A., Briggs, W. M., Patel, S., Datillo, P. A., Bove, J.,
and Birkhahn, R. H. (2009). Emergency department
crowding: Factors influencing flow. Western Journal
of Emergency Medicine, pages 10–15.
Asplin, B. R., Magid, D. J., Rhodes, K. V., Solberg, L. I.,
Lurie, N., and Camargo, C. A. (2003). A conceptual
model of emergency department crowding. Annuals
of Emergency Medicine, pages 173–180.
Bamezai, A., Melnick, G., and Nawathe, A. (2005). The
cost of an emergency department visit and its rela-
tionship to emergency department volume. American
College of Emergency Physicians, pages 483–490.
Fields, W. W. (2003). Calculus, chaos, and other models of
emergency department crowding. Annuals of Emer-
gency Medicine, pages 181–184.
Huescher, M. C. and McCann, J. A. (2008). A survey of
autonomic computing: Degrees, models,and applica-
tions. ACM Computing Surveys, pages 1–28.
Jain, R. (1991). The Art of Computer System Performance
Evaluation. John Wiley & Sons, New York.
Kephart, J. and Chess, D. (2003). The vision of autonomic
computing. IEEE Internet Computing, pages 41–50.
Parasuraman, R., Sheridan, T. B., and Wickens, C. D.
(2000). A model for types and levels of human in-
teraction with automation. IEEE Systems, Man, and
Cybernetics Society, 30:286–297.
Rayward-Smith, V., Osman, I., and Reeves, C. (1996).
Modern Heuristic Search Methods. John Wiley &
Sons.
Roberts, L., Johnson, D. C., Shanmugam, D. R., Malho-
tra, S., Zinkgraf, D. S., Young, M., Putnam, J., and
Cameron, L. (2006). Computer simulation and six-
sigma tools applied to process improvement in an
emergency department. Institue of Industrial Engi-
neers Society for Health Systems.
Welch, S., Augustine, J., Camargo, C. A., and Reese, C.
(2006). Emergency department performance mea-
sures and benchmarking summit. Academic Emer-
gency Medicine, pages 1074–1080.
HEALTHINF 2012 - International Conference on Health Informatics
182
