
ECONOMIC-PROBABILISTIC MODEL FOR RISK ANALYSIS
IN PROJECTS
Rogério Feroldi Miorando, José Luis Duarte Ribeiro, Maria A. C. Tinoco
and Carla Schwengber ten Caten
Federal University of Rio Grande do Sul, Porto Alegre, Brasil
Keywords: Risk analysis, Project management, Simulation.
Abstract: This paper presents an economic-probabilistic model to conduct risk analysis in projects. The model
integrates risk and economic project analysis by quantifying both value and probability of occurrence of
potential cash flow deviations, thus resulting in an economic-probabilistic analysis of the expected returns.
The model allows calculating risk-adjusted values for cash flow groups and projecting net present value
through stochastic simulation. As a result, the model provides both the risk-adjusted project economic return
with the associated probability distribution to its NPV and the variability that each risk factor generates in
the project return.
1 INTRODUCTION
Risk analysis is growing in importance in the current
economy, as most economic decisions are taken in
uncertainty-prone scenarios. Uncertainty sources are
multiple and extensive, encompassing risks
associated to markets, suppliers, weather,
technology, etc. (Chavas, 2004).
Among the risk analysis models for project
available in academic literature, few directly indicate
the actual risks. Moreover, among the models that
propose specific tools for risk analysis, most focus
only on the success probability for the overall
project itself, without considering their economic
dimension. There are also models, such as
Benaroch’s (2002, 2007), that use real options to
value IT projects given the assumed risks, but these
models only conduct economic analysis and do not
face the problem of identifying and quantifying the
risks involved.
The objective of this paper is to present the
application of an economic-probabilistic model for
analysing risks in project investments. The model
integrates risk and economic project analysis by
quantifying both value and probability of occurrence
of potential cash flow deviations, thus resulting in an
economic-probabilistic analysis of the expected
returns.
2 MODEL STRUCTURE
The model presented in this paper was based on the
models by Karolak (1996), Foo and Murugananthan
(2000) and Schimitz et al. (2006). The application of
the model is conducted according to four steps: cash
flow structure completion; risk assessment structure
completion; determination of cash flow group risk-
adjusted Net Present Value (NPV); and
determination of risk-adjusted Net Present Value for
the project.
In the step of cash flow structure completion, the
benefit and cost items are distributed among nine
cash flow groups. The groups are divided as follows:
(i) Benefits, (ii) Financial costs, (iii) Infrastructure,
(iv) Licensing and equipment, (v) Labor, (vi)
Training, (vii) Outsourced services, (viii)
Consumables and (ix) Other expenses.
The risk assessment structure completion is
carried out through a questionnaire that combines
the categories of risk with the project's cash flow.
Risk categories and associated risk factors were
identified through literature analysis coupled with
expert opinions. The questionnaire is composed of
six fields (Figure 1): (i) matching of cash flow
groups and risk categories; (ii) assessment of risk
factor impact; (iii) assessment of probability of
occurrences for the risk factors’ impact ranges; (iv)
indication of analysts’ knowledge level about each
risk factor assessment; (v) indication of reasoning
208
Feroldi Miorando R., Luis Duarte Ribeiro J., A. C. Tinoco M. and Schwengber ten Caten C..
ECONOMIC-PROBABILISTIC MODEL FOR RISK ANALYSIS IN PROJECTS.
DOI: 10.5220/0003737302080211
In Proceedings of the 1st International Conference on Operations Research and Enterprise Systems (ICORES-2012), pages 208-211
ISBN: 978-989-8425-97-3
Copyright
c
2012 SCITEPRESS (Science and Technology Publications, Lda.)

Worst case
Best case
Worst case
Best case
High
Medium
Low
Cash Flow Group A (-) Impact ($) (+) (-) Probability (+) Knowledge Reasoning base
Risk Category I
Risk Factor 1
Risk Factor 2
...
Group A Value
$ ...
Figure 1: Risk Assessment Structure.
Worst case
Best case
Worst case
Best case
A
ssessment of Benefits (-) Impact (U$/1.000) (+) (-) Probability (+)
Risks associated to competitor actions
Impact on benefits due to under/overestimated
competitor response
-1.045 -627 -209 816 2.448 4.080 35% 40% 15% 7% 3%
Impact on benefits due to under/overestimated
introduction of substitute technologies
-1.700 -1.020 -340 0 0 0 20% 35% 45% 0% 0%
... ... ... ... ... ... ... ... ... ... ... ...
Benefits Value U$ 14.764 million
* Monetary values, in thousands
Figure 2: Risk Assessment Structure – Impact versus Probability.
base; and (iv) calculation of the cash flow group.
The completion of the questionnaire is carried
out in four parts. First, the economic impact of the
risk factor upon the cash flow group where it
belongs is estimated. Analysts estimate values for
the largest negative economic impact as well as the
largest positive economic impact that each risk
factor can produce upon the expected value for the
cash flow group. From these values, the model
generates four intermediate values, resulting in five
probable economic impact ranges.
Secondly, analysts indicate the probability of
occurrence for each range generated in the previous
step. Figure 2 shows an example of this assessment
for the risk category Risks associated to competitor
actions. In the third part, the analysts indicate your
knowledge level about each risk factor assessment.
This allows analysing the opinion of several
analysts, according to their knowledge levels.
Finally, the analysts indicate the reasoning base,
which ensures the traceability of the criteria used in
the analysis and serve as a source of information to
correct any discrepancies between the responses of
different analysts.
In the step of determination of cash flow group
risk-adjusted net present value, average values for
the probable economic impact ranges and their
respective probabilities of occurrence are used to
generate a probability distribution for the economic
impact that translates the risk associated to each
factor. This distribution probabilistically describes
the impact of the considered factor on the monetary
value for the cash flow group in question.
Risk-adjustment was carried out by summing up
the deterministic value for the group, indicated in the
cash flow, and the probability distribution of the risk
factor that impact the group at hand, through
stochastic simulation using the Monte Carlo
sampling technique. Figure 3 shows an example of
the probability distributions for the cash flow groups
Benefits and Financial costs and budgeting.
The determination of risk-adjusted net present
value for the project is carried out by summing up
the probability distributions for the cash flow groups
through a new stochastic simulation. Figure 4
presents an example of the probability distribution
for the project NPV with an average NPV of U$
1,862,568.20.
ECONOMIC-PROBABILISTIC MODEL FOR RISK ANALYSIS IN PROJECTS
209
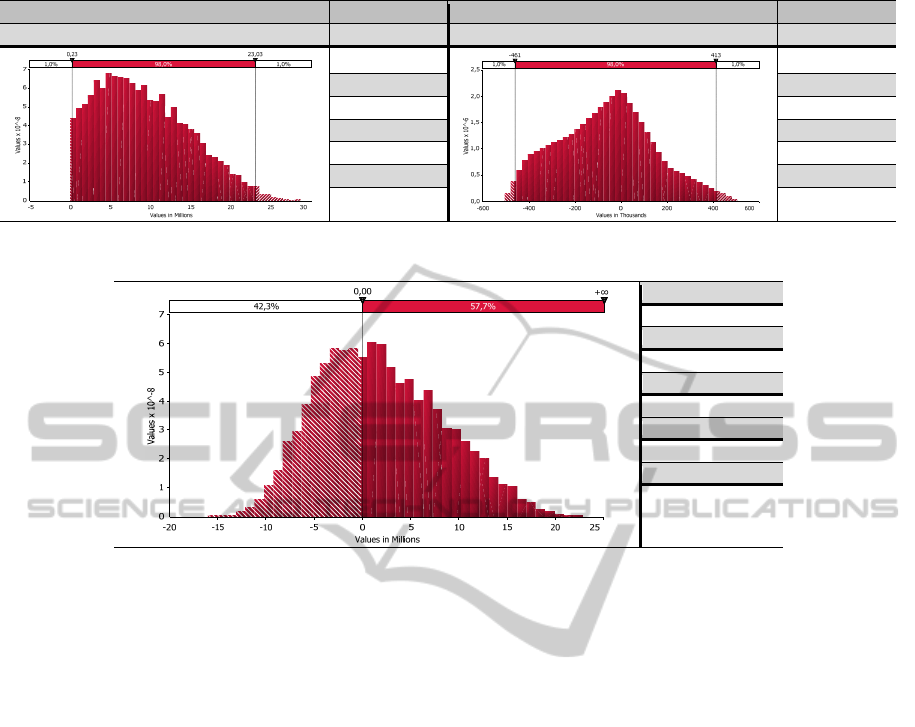
Cash Flow Group Values Cash Flow Group Values
Benefits Average Financial costs and budgeting Average
9.161.823
-63.890
SD SD
5.687.280 204.700
1% value 1% value
232.428 -461.450
99% value 99% value
23.025.189 412.544
Figure 3: Summary of the probabilistic cash flow.
Average
1.862.568,20
Standard Dev.
6.416.584,20
1% value
-10.431.215,30
99% value
17.053.084,40
P(VPL ≥ 0)
57,7%
Figure 4: Probabilistic risk-adjusted NPV.
Figure 4 also shows the NPV standard deviation, a
98% confidence interval for NPV and the probability
of a positive NPV. This information provides a
complete view of the economic risk involved in the
project in a language accessible to both analysts and
decision makers.
After completing the risk assessment structure
completion, it is also possible to rank the risk factors
according to their impact on the project. This allows
identifying which factors represent the greatest
threats and the best opportunities to the project,
enabling the analysis of new options.
This model fills a literature gap by integrating
risk and economic project analysis. It offers decision
support translating the different types of risks in
financial results providing a clearer view of the
project’s economic viability to decision makers.
3 CONCLUSIONS
The proposed model guides the elaboration of the
project cash flow, identifies the risks involved and
quantifies the risks by mapping the potential
economic impacts and their probabilities of
occurrence. As its final result, the model provides
the project risk-adjusted economic return in the form
of a probability distribution for its NPV.
The presentation of the economic-probabilistic
risk analysis as a project NPV probability
distribution facilitates the comprehension of the
subtitles involved in the risk analysis for the
decision makers. Moreover, the probabilistic NPV
allows decision makers without technical knowledge
to easily assess the project risk level and the impact
of alternative scenarios by themselves, whilst other
risk analysis solutions usually require the support of
specialists for this type of evaluation.
REFERENCES
Benaroch, M. 2002. Managing Information Technology
Investment Risk: A Real Options Perspective. Journal
of Management Information Systems, v. 19, n. 2, pp.
43-84.
Benaroch, M.; Jeffery, M.; Kauffman, R. J.; Shah, S.
2007. Option-Based Risk Management: A Field Study
of Sequential Information Technology Investment
Decisions. Journal of Management Information
Systems, v. 24 n. 2, p103-140.
Chavas, Jean-Paul. 2004. Risk analysis in theory and
practice. Elsevier Academic Press, San Diego, 247p.
Foo, S. W.; Muruganantham, A. 2000. Software Risk
Assessment Model. Proceedings of the International
Conference on Management of Innovation and
Technology, IEEE, v.2, n. 1, p. 536-544.
ICORES 2012 - 1st International Conference on Operations Research and Enterprise Systems
210

Karolak, D. W. 1996. Software Engineering Risk
Management. IEEE Computer Society Press, Los
Alamitos.
Schmitz, E. A.; Alencar, A. J.; Villar, C. B. 2006. Modelos
Qualitativos de Análise de Risco para Projetos de
Tecnologia da Informação. Brasport: Rio de Janeiro.
ECONOMIC-PROBABILISTIC MODEL FOR RISK ANALYSIS IN PROJECTS
211
