
PYCOEVOL
A Python Workflow to Study Protein-protein Coevolution
Fábio Madeira and Ludwig Krippahl
CENTRIA-DI, Universidade Nova de Lisboa, Caparica, Portugal
Keywords: Protein coevolution, Multiple sequence alignments, Mutual information.
Abstract: Protein coevolution has emerged as an important research topic. Several methods and scoring systems were
developed to quantify coevolution, though the quality of the results usually depends on the completeness of
the biological data. To simplify the computation of coevolution indicators from the data, we have
implemented a fully integrated and automated workflow which enables efficient analysis of protein
coevolution, using the Python scripting language. Pycoevol automates access to remote or local databases
and third-party applications, including also data processing functions. For a given protein complex under
study, Pycoevol retrieves and processes all the information needed to undergo the analysis, namely
homologous sequence search, multiple sequence alignment computation and coevolution analysis, using a
Mutual Information indicator. In addition, friendly output results are created, namely histograms and
heatmaps of inter-protein mutual information scores, as well as lists of significant coevolving residue pairs.
An illustrative example is presented. Pycoevol is platform independent, and is available under the general
public license from http://code.google.com/p/pycoevol.
1 INTRODUCTION
Protein coevolution has emerged as an important
research topic, being applied successfully to predict
the structure of RNA (Freyhult et al., 2005) and
proteins (Yeang and Haussler, 2007); to predict
intermolecular interactions (Pazos et al., 1997); to
identify functionally important regions of molecules
(Saraf et al., 2003); and to identify energetic
pathways through molecules (Süel et al., 2003).
Overall, protein coevolution corresponds to the
accumulation of structural/functional changes
through evolutionary lineages, which are
compensated by changes in other regions of the
same protein or in another protein (Pazos and
Valencia, 2008). Since many proteins have evolved
performing mutual interactions and consequently
forming specific molecular complexes (Pazos and
Valencia, 2008), inter-protein coevolution
corresponds to mutual evolutionary constraints
imposed by each protein on the other partner and
accordingly, protein sequences must reflect this
evolutionary process (Pazos et al., 1997).
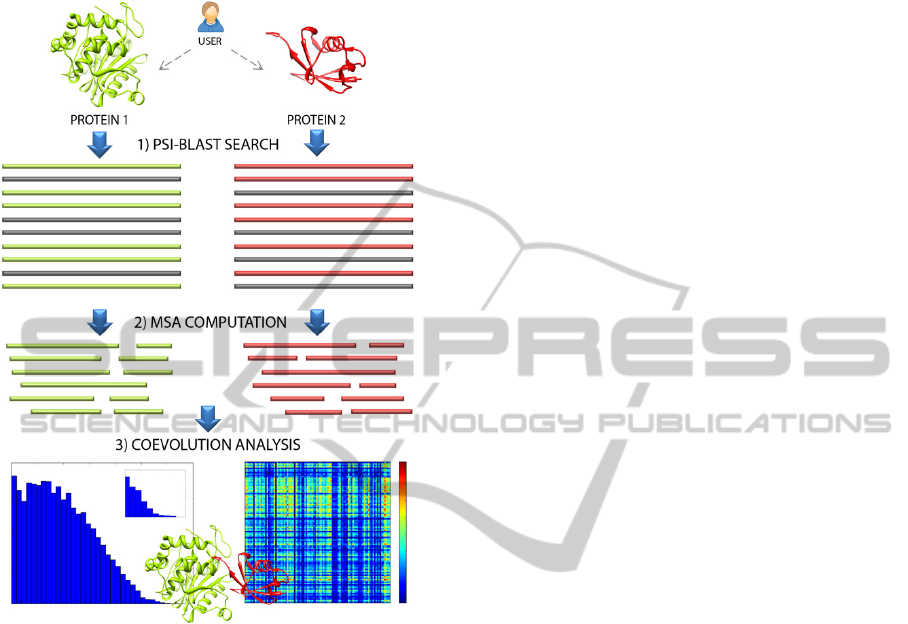
Coevolving residues are detected in a three-step
process: 1) search for homologue sequences; 2)
computation of a multiple sequence alignment
(MSA) for each protein; 3) calculation of a
coevolution score for each pair of sites in the MSAs.
The first step involves the selection of orthologues
and the matching of the correct protein pairs along
organism lineages. One approach can be a PSI-
BLAST search (Altschul et al., 1997), which is a
reliable source for distant relatives and favours
orthologues over paralogues, reducing one source of
errors. The second step involves the computation of
MSAs for each protein. The MSA is a rich source of
sequence-function relationships and attempts to
represent the evolutionary relations between the
homologous sequences by aligning them under the
assumption that mutations are independent.
Although the MSA relies in computationally
complex algorithms (Elias, 2006), considering the
number and the variability of a set of homologous
sequences, supplemented with the assumed
independence of mutations, this often leads to poor
alignments, and becomes an important problem for
identifying coevolution. Finally, a coevolution score
is calculated for each pair of sites in the MSAs.
Coevolution analysis depends on the
completeness of the biological data and, given the
complexity of MSA computations, sometimes made
worse by insufficient evolutionary divergence and
143
Madeira F. and Krippahl L..
PYCOEVOL - A Python Workflow to Study Protein-protein Coevolution.
DOI: 10.5220/0003737901430149
In Proceedings of the International Conference on Bioinformatics Models, Methods and Algorithms (BIOINFORMATICS-2012), pages 143-149
ISBN: 978-989-8425-90-4
Copyright
c
2012 SCITEPRESS (Science and Technology Publications, Lda.)

the presence of too many indels (gaps), a large
number of methods and scoring functions have been
proposed in the literature to estimate protein
coevolution, including phylogenetic independent and
phylogenetic dependent methods (see (Halperin et
al., 2006) and (Caporaso et al., 2008) for extended
reviews). It is likely that different applications
would require different methods and it can be
difficult to choose from them, as they exhibit subtle
yet significant differences. Unfortunately, there isn’t
any survey or benchmark assessing the accuracy of
each approach.
Mutual Information (MI) (Martin et al., 2005) is
a standard measure to identify sites of correlated and
compensatory mutations in a set of homologous
sequences and can be used to identify correlated
positions between two interacting proteins. MI is a
measure based on Information Theory, which
quantifies the mutual dependence between two
random variables, and is a “tree-ignorant” method
(Caporaso et al., 2008), since it does not account for
likelihoods or shared ancestral correlations. In a
MSA, the MI between two columns (positions)
reflects the extent to which the existence of one
specific amino acid residue at one position allows us
to predict the identity of the residue at the other
position. MI scores are high if substitutions at the
two positions show positive correlation.
Since protein-protein coevolution analysis
involves the execution of the specified steps, and for
each step there is a multitude of options, we have
implemented a fully integrated and automated
workflow which combines these steps and enables
efficient analysis of coevolution among proteins,
using the Python scripting language. Pycoevol aims
at automating the computation of coevolution
indicators, speeding up data-mining and improving
the accuracy of the results. Pycoevol automates
access to remote or local databases and third-party
applications and includes data processing functions,
thus enabling a flexible use of the workflow.
As a proof-of-concept we present the complete
analysis of coevolution in a protein complex formed
by transforming growth factor beta 3 (TGF-β3) and
extracellular domain of TGF-β receptor type II
(TGF-β receptor) (Hart et al., 2002). TGF-β3 is a
protein that controls cellular proliferation and
differentiation by signalling through kinase
receptors, namely serine/threonine receptors as
TGF-β receptor. The execution of the Pycoevol
workflow pinpointed several coevolving pairs of
residues. Most residues identified were at the surface
of the protein complex, and 13% of them were
located at the complex interface. This example
further illustrates how computing inter-protein
coevolution can improve the accuracy of constrained
docking algorithms (e.g. BiGGER (Palma et al.,
2000)) assisting the demanding task of protein
docking.
2 METHODS
As described in the previous section, protein
coevolution analysis involves the execution of a
series of steps, and for each step there is a multitude
of options. To congregate these steps in a system
which enables an efficient analysis of protein
coevolution, we developed a Python workflow
consisting of a set of scripts, which includes
connectors to local or remote databases, enabling
also the execution of third party applications through
the command line, for both PSI-Blast search and
computation of MSAs. Furthermore, we have used
the Biopython module (Cock et al., 2009), for
general manipulation of biological data.
The analysis starts with the input of Protein Data
Bank accession numbers (PDB ID), for each protein
partner. Alternatively, accession numbers for NCBI
reference sequence identifiers (GI) or UniProt
primary (citable) accession number can be also used,
as in the case of proteins without available 3D
structures. For each protein a collection of
orthologous sequences is searched. This is done by a
PSI-BLAST search (Altschul et al., 1997) against
NCBI Reference Proteins database. The reason for
using PSI-BLAST instead of a simple BLAST
search is that we need to start with a large number of
ortologous sequences and PSI-BLAST allows us to
find more distant relatives. PSI-blast uses the default
configuration, but alternative configurations can be
also specified. Protein sequences of both partners are
then matched by comparing the source organisms for
each sequence. The assumption is that, if the
proteins are homologous and interact in one
organism, they should also interact in the other
organisms. This is a crucial step because proteins
will only coevolve within the same lineage, and
without matching the correct organisms the data
obtained would be meaningless. A refined set of
sequences for each interacting partner is obtained
and three different MSAs are computed, using
ClustalW (Chenna et al., 2003) and Muscle (Edgar,
2004) in the default configuration, and Mafft (Katoh
et al., 2002) with linsi (L-INS-i), the most accurate
configuration. In order to compare the performance
of the MSAs computed, we develop two scores: SP
score, which scores each MSA (GOP 4.0, GEP 1.0
BIOINFORMATICS 2012 - International Conference on Bioinformatics Models, Methods and Algorithms
144

and the BLOSUM62 scoring matrix (Henikoff and
Henikoff, 1992)); and a column score (CS), which
compares the MSAs column by column. These
scoring systems are implemented in Python and are
based on the ones developed for BaliBASE
(Thompson et al., 1999). Instead of comparing the
SP scores against a reference MSA, as in the case of
BaliBASE approach, our implementation compares
the scores obtained for each MSA computed with
different MSA programs. For the MSAs
corresponding to each protein partner, the ones with
the best scores are selected to further analysis.
Supplementing the SP, CS gives an overview on the
similarity between MSAs, and the higher the CS; the
higher the percentage of equal columns present on
both MSAs. The selected MSAs are also inspected
for misalignments and for specific destabilizing
sequences, and are cropped by excluding portions
not covered by the structures if a 3D structure is
available, otherwise the complete sequences are
used. The next step consists in estimating which
pairs of residues show traces of coevolution. The
MSA columns represent a snapshot of the
evolutionary relations of all different protein
sequences for that position. The estimation is
calculated for all pairs of columns between two
MSAs, by Mutual Information (MI), which is
defined as follows (Martin et al., 2005):
MI (X,Y) = H(X) + H(Y) - H(X,Y) (1)
The estimation is done summing the entropies H(X)
and H(Y), corresponding to amino acid frequencies
for each residue belonging to the columns in
analysis, minus the joint entropy H(X,Y) for that
pair of columns. The higher the estimation is, the
higher the indication that compensatory mutations
arose that mitigated the deleterious effects of
mutations interfering with the stability of the
interaction between that specific pair of residues.
Estimation of MI (1) for all pairs of columns in both
MSAs gives a matrix of scores and, to improve the
detection of significant positions, the analysis is
constrained to include only the residues belonging to
the surface of the proteins. The assumption is that
residues on the core of the protein are not
susceptible to perform or sense the influence of
residues at the interface of the other protein. We
implemented a measure of accessible surface area
(ASA) based on the surface calculations
implemented in Hollow (Ho and Gruswitz, 2008).
Alternatively, we implemented a measure of solvent
excluded surfaces of molecules, using the MSMS
program (Sanner et al., 1996). In any case, for each
position in the MSAs there are a multitude of
contacts and the results of this estimations show that
for each residue in one protein the possible mutual
propensity contacts between positions are usually
variable.
For each complex, the map of potential
interactions is calculated using a MI calculator, and
friendly output results are created, namely
histograms and heatmaps of inter-protein mutual
information scores, as well as lists of significant
coevolving residue pairs. From the collection of MI
scores (surface positions), only the best 20% scores
are selected as significant coevolving residues, and
are prone to further analysis.
3 RESULTS AND DISCUSSION
Pycoevol detects inter-protein coevolution, being
therefore suitable to the study of protein complexes.
Furthermore, this workflow is optimized to predict
intermolecular interactions and to constraint the
search space in protein docking. It can be also used
to complement studies concerning the identification
of functionally and structurally important regions of
molecules as well as to predict the structure of
proteins. It offers an easy implementation of the
protein-protein coevolution analysis workflow
(Figure 1), which congregates several tools and
tasks, enabling the researcher to focus on biological
problems, rather than repetitive execution or
implementation of self-made codes. Only if special
tools or specific tasks are needed, the user may need
to edit or complement the Pycoevol source code. For
the general user, Pycoevol runs like any other
application or any other python script, called from
the command line. The simplest usage is to type
python pycoevol.py at the prompt of the operating
system’s command line and select from the available
options. The execution of the workflow takes from
minutes to hours, depending on the extension of the
data being processed. To analyse the traces of
coevolution between the proteins in the complex, the
user only have to specify the accession numbers of
the protein sequences. After PSI-BLAST search,
MSA computation and coevolution analysis, easy
readable output results are generated.
As we noticed before, several methods and
scoring systems were developed to detect traces of
coevolution, though the quality of the results also
depends on the quality of the source data.
Accordingly, the detection of inter-protein
coevolution relies on two main aspects. One is the
computation of coevolution indicators and, to
improve our application, we plan to include other
PYCOEVOL - A Python Workflow to Study Protein-protein Coevolution
145
coevolution indicators as well as normalizations,
increasing therefore the sensibility and allowing the
cross-validation of the most significant results.
Figure 1: Main steps implemented in the Pycoevol
workflow.
The other important factor is the quality of the
data and MSA being processed, so we plan to
include other MSA programs and a refining tool that
accounts for the dependence of mutations, thus
improving the quality of the MSAs. Beyond the
advantages to the user, these improvements will
eventually let us perform a survey assessing the
accuracy of some coevolution indicators, as well as
evaluate which MSA program is better suited to
protein-protein coevolution analysis. T-Coffee
Expresso (Notredame et al., 2000) is a good
candidate to be included in our workflow, as it
produces structural alignments, rather than sequence
alignments, and is a powerful and accurate
alignment tool based on the construction of libraries
(local alignments), which then incorporates
additional structural information to obtain the final
MSA. In theory, the advent of structural information
to constraint and to compute MSAs should be a
more realistic source of information towards
detection of inter-protein coevolution, since residues
are aligned based on structural topologies rather than
just to maximize a scoring function, as in the case of
the classic Sum-of-Pairs (SP) scoring system usually
implemented in MSA algorithms (Do and Katoh,
2008). Although the details of which scoring
function is better suited to co-evolutionary analysis
or how to infer inter-molecular contacts from MSA
data requires serious benchmarking, our workflow
uses three standard MSA programs with different
performances to compute the alignments. The MSA
programs included are the widely used ClustalW and
Muscle, and Mafft, ranked the best program in
overall performance in a recent benchmark based on
the BaliBASE database (Thompson et al., 2011).
The comparison between the SP scores of each
MSA, gives a preliminary measure on what MSA
program may favour the detection of coevolution for
the specific test case under study, accounting on the
principle that an MSA with high SP score is better
suited to MI analysis. This can be misleading, since
the MSA algorithm can misplace coevolving sites in
the alignment, while attempting to maximize a
scoring function (as the SP score).
Pycoevol was tested on the protein complex
TGF-β3/TGF-β receptor. Figure 2A shows a
histogram of MI score frequencies computed for all
the pairs of positions on the MSAs computed for
each protein. In this case, coevolution results were
processed using MSAs computed by Mafft, as they
scored best. Along with histograms, heatmaps were
also generated (Figure 2B and 2C). These give a
general view on the relative positions of highly
scoring residues belonging to each protein. By
selecting only the highest MI scores, the heatmap
gives a clearer view on the positions of those
residues. The structural analysis of the protein
complex shows the location of interface residues for
both protein partners (Figure 2D). Most residues
presenting higher MI scores were located at the
surface (Figure 2E bottom), and 13% of them (3 out
of 23) were located at the interface (Figure 2E top).
The interacting map obtained for the TGF-β3/TGF-β
receptor complex (Figure 2F), i.e. the network of
pairings relatives to the highest scoring positions,
shows that TGF-β3 has 2 residues on the interface (2
out of 8) and TGF-β receptor has 1 residue on the
interface (1 out of 15). This finding is very
interesting; given the complexity of protein-protein
docking, finding even only one positive interface
contact can help constraint the search space and
improve the accuracy of constrained docking
algorithms.
To test the application of our coevolution measure-
BIOINFORMATICS 2012 - International Conference on Bioinformatics Models, Methods and Algorithms
146
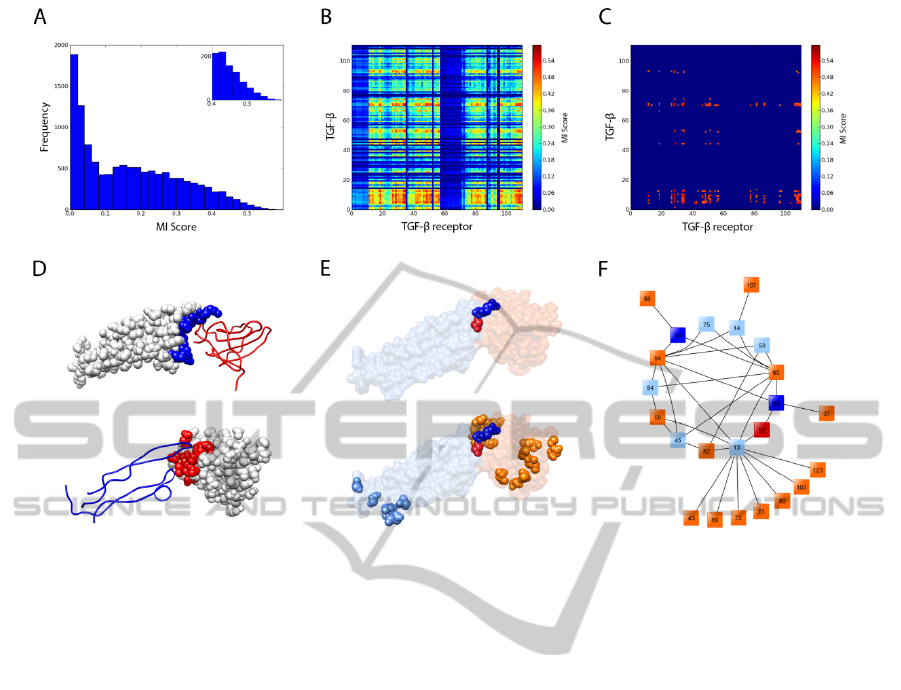
Figure 2: Protein coevolution analysis of complex TGF-β3/TGF-β receptor with mutual information. Every pair of positions
on the MSAs was examined for coevolution using an analysis of MI. (A) Histogram of inter-protein mutual information
scores. (B) The matrix of scores for each pair of positions in the alignment is plotted as a heatmap, according to the colour
legend shown. (C) The matrix of scores for positions with highest MI scores (greater than 80% of the best MI score) is
plotted as a heatmap. (D) Illustration of complex TGF-β3/TGF-β receptor (PDB ID 1KTZ) showing interface residues of
TGF-β3 as blue spheres (top) and interface residues of TGF-β receptor as red spheres (bottom). (E) Illustration of
coevolving residues of TGF-β3 (blue spheres) and TGF-β receptor (red spheres), located at the interface (top). Previous
representation with remaining coevolving residues of TGF-β3 (light blue spheres) and TGF-β receptor (orange spheres),
located at the surface (bottom). (F) Network of the pairings identified by MI, using the same colour scheme as in the
previous panel (E).
ments on protein docking, we employed the
coevolving residues identified on the complex TGF-
β3/TGF-β receptor, as constraints in BiGGER. This
is a difficult complex to model because of the low
contact surface. Using unbound structures of both
TGF-β3 and TGF-β receptor (PDB structures 1TGK
and 1MZ9, respectively), to simulate a real-life
application, BiGGER could not retain, within the
5000 highest scoring surface contacts, any model
that placed the TGF-β receptor at the correct
position (Figure 3A). This was no longer the case
when constraining the docking simulation using
coevolution data. From TGF-β3 we considered 8
residues with higher MI score, in our coevolution
criteria, two of which were truly at the interface.
From TGF-β receptor there were 15 residues that
fulfilled our selection criteria, with only one at the
interface. One approach was to use both sets of
residues, but imposing the constraint that there must
be at least one contact between the 8 residues of one
partner and the 15 of the other. Contact was defined
as having the alpha Carbons at most 7Å apart. Panel
B of Figure 3 shows one model obtained as a result,
with TGF-β receptor placed at the correct point
relative to TGF-β3, though not quite at the right
orientation. This experiment shows that even
without being able to identify exactly which are the
correct contacts, the constraint requiring any one
contact, at least, reduces the search space enough so
that correct models are not lost during the filtering
stage of docking. In Figure 3C we show one model
obtained by forcing the specific contact between an
interface residue of TGF-β3 (A93) and one interface
residue of TGF-β receptor (R52). Since both
residues are at the interface, all models are
approximately at the right position. The interesting
aspect of this experiment is that, with this constraint,
the search space is so reduced that a docking takes
less than five minutes, as opposed to nearly two
hours for an unconstrained docking run. This means
that it is feasible to test, individually, all potential
residue contacts given by the coevolution measure-
PYCOEVOL - A Python Workflow to Study Protein-protein Coevolution
147
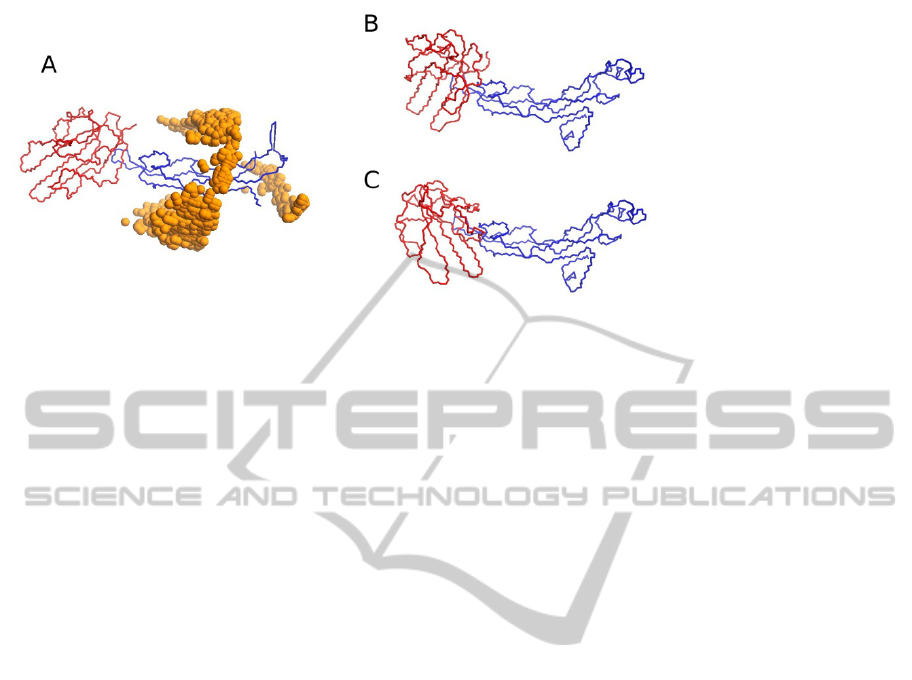
Figure 3: Summary of the docking results. (A) Correct structure of the complex TGF-β3/TGF-β receptor (PDB ID 1TGK
and 1M9Z, respectively), surrounded by spheres representing the geometric centre of TGF-β receptor (red), where it was
predicted in the 5000 models generated in the docking run. No model was found that places TGF-β receptor at the right
position. (B) One of the models obtained by requiring an unspecified contact between the two groups of 8 and 15 candidate
interface residues. In both cases, the resulting model was not very accurate, given the incorrect orientation of TGF-β
receptor (red), but even so this was a significant improvement over the unconstrained docking in the modelling of this
complex. (C) One of the models obtained by restricting the distance between residue A93 of TGF-β3(blue) and residue R52
of TGF-β receptor (red), which run took less than five minutes.
ments. Furthermore, since the docking runs are
independent, the whole process is trivial to run in
parallel, thus, in practice, taking less time than a
single unconstrained docking run.
4 CONCLUSIONS
Pycoevol source code (version 1.0) will be made
freely available for downloaded from
http://code.google.com/p/pycoevol.
Additional information on the third-party
dependencies, as well as how to install and run the
program can be check at the same location. The
workflow is fully written in Python 2.7, platform
independent, and is available under the general
public license. User requests and contributions may
be implemented and included in future versions of
the software.
Pycoevol is a fully integrated and automated
system which enables efficient analysis of
coevolution among proteins. In order to improve the
workflow and its capabilities, we plan to include
other coevolution indicators as well as
normalizations. Alongside, the inclusion of new
MSA programs and a refining tool is also planned.
The integration with molecular viewers, such as
RasMol (Bernstein, 2000) and UCSF-Chimera
(Pettersen et al., 2004), which allows the automatic
selection and display of the coevolving residues, will
enable further analysis and usage possibilities.
Finally, the natural extension of the Pycoevol
workflow aims at include also protein docking and
consequently, Pycoevol will be included and
integrated in the Open Chemera Library (Krippahl,
2011), an open source library, which includes among
several features, BiGGER, the constrained docking
algorithm. This system will become a useful tool to
study protein coevolution and interaction, and will
hopefully be the basis for several studies concerning
protein interactions.
ACKNOWLEDGEMENTS
This work was funded by national funds from FCT-
Fundação para a Ciência e Tecnologia, under project
PTDC/EIA-CCO/115999/2009.
REFERENCES
Altschul, S. F., Madden, T. L., Schäffer, A. A., Zhang, J.,
Zhang, Z., Miller, W., Lipman, D. J. (1997). Gapped
BLAST and PSI-BLAST: a new generation of protein
database search programs. Nucleic Acids Research,
25(17), 3389-402.
Bernstein, H. J. (2000). Recent changes to RasMol,
recombining the variants. Trends in Biochemical
Sciences, 25(9), 453-5.
Caporaso, J. G., Smit, S., Easton, B. C., Hunter, L.,
Huttley, G. A., Knight, R. (2008). Detecting
BIOINFORMATICS 2012 - International Conference on Bioinformatics Models, Methods and Algorithms
148

coevolution without phylogenetic trees? Tree-ignorant
metrics of coevolution perform as well as tree-aware
metrics. BMC Evolutionary Biology, 8, 327-52.
Chenna, R., Sugawara, H., Koike, T., Lopez, R., Gibson,
T. J., Higgins, D. G., Thompson, J. D. (2003).
Multiple sequence alignment with the Clustal series of
programs. Nucleic Acids Research, 31(13), 3497-500.
Cock, P. J., Antao, T., Chang, J. T., Chapman, B., Cox, C.
J., Dalke, A., Friedberg, I., Hamelryck, T., Kauff, F.,
Wilczynski, B. (2009). Biopython: freely available
Python tools for computational molecular biology and
bioinformatics. Bioinformatics, 25(11), 1422-3.
Do, C. B., Katoh, K. (2008). Protein Multiple Sequence
Alignment. Functional Proteomics: Methods and
Protocols, 484, 379-413.
Edgar, R. C. (2004). MUSCLE: multiple sequence
alignment with high accuracy and high throughput.
Nucleic Acids Research, 32(5), 1792-7.
Elias, I. (2006). Settling the intractability of multiple
alignment. Journal of Computational Biology, 13(7),
1323-39.
Freyhult, E., Moulton, V., Gardner, P. (2005). Predicting
RNA structure using mutual information. Applied
Bioinformatics, 4(1), 53-59.
Halperin, I., Wolfson, H., Nussinov, R. (2006). Correlated
Mutations: Advances and Limitations. A Study on
Fusion Proteins and on the Cohesin-Dockerin
Families. Proteins: Structure, Function, and
Bioinformatics, 63(4), 832–845.
Hart, P. J., Deep, S., Taylor, A. B., Shu, Z., Hinck, C. S.,
Hinck, A. P. (2002). Crystal structure of the human
TbetaR2 ectodomain--TGF-beta3 complex. Nature
Structural Biology, 9(3), 203-8.
Henikoff, S., Henikoff, J.G. (1992). Amino acid
substitution matrices from protein blocks. Proceedings
of the National Academy of Sciences of the United
States of America, 89(22), 10915-9.
Ho, B. K., Gruswitz, F. (2008). HOLLOW: generating
accurate representations of channel and interior
surfaces in molecular structures. BMC Structural
Biology, 8, 49-55.
Katoh, K., Misawa, K., Kuma, K., Miyata, T. (2002).
MAFFT: a novel method for rapid multiple sequence
alignment based on fast Fourier transform. Nucleic
Acids Research, 30(14), 3059-66.
Krippahl, L. (2011). Open Chemera Library. Available at
https://github.com/lkrippahl/Open-Chemera
Martin, L. C., Gloor, G. B., Dunn, S. D., Wahl, L. M.
(2005). Using information theory to search for co-
evolving residues in proteins. Bioinformatics, 21(22),
4116-24.
Notredame, C., Higgins, D. G., Heringa, J. (2000). T-
Coffee: A novel method for fast and accurate multiple
sequence alignment. Journal of Molecular Biology,
302(1), 205-17.
Palma, P. N., Krippahl, L., Wampler, J. E., Moura, J. J.
(2000). BiGGER: a new (soft) docking algorithm for
predicting protein interactions. Proteins, 39(4), 372-
84.
Pazos, F., Helmer-Citterich, M., Ausiello, G., Valencia, A.
(1997). Correlated mutations contain information
about protein-protein interaction. Journal of Molecular
Biology, 271(4), 511-23.
Pazos, F.,Valencia, A. (2008). Protein co-evolution, co-
adaptation and interactions.
The EMBO Journal,
27(20), 2648-55.
Pettersen, E. F., Goddard, T. D., Huang, C. C., Couch, G.
S., Greenblatt, D. M., Meng, E. C., Ferrin, T. E.
(2004). UCSF Chimera--a visualization system for
exploratory research and analysis. Journal of
Computional Chemistry, 25(13), 1605-13.
Sanner, M. F., Olson, J. Spehner, J. C. (1996). Reduced
surface: an efficient way to compute molecular
surfaces. Biopolymers, 38(3), 305-20.
Saraf, M., Moore, G., Maranas, C. (2003). Using multiple
sequence correlation analysis to characterize
functionally important protein regions. Protein
Engineering, 16(6), 397-406.
Süel, G. M., Lockless, S. W., Wall, M. A., Ranganathan,
R. (2003). Evolutionarily conserved networks of
residues mediate allosteric communication in proteins.
Nature Structural Biology, 10(1), 59-69.
Thompson, J. D., Plewniak, F., Poch, O. (1999).
BAliBASE: a benchmark alignment database for the
evaluation of multiple alignment programs.
Bioinformatics, 15(1), pp.87-8.
Thompson, J. D., Linard, B., Lecompte, O., Poch, O.
(2011). A Comprehensive Benchmark Study of
Multiple Sequence Alignment Methods: Current
Challenges and Future Perspectives. PLoS ONE, 6(3),
18093-107.
Yeang, C-H., Haussler, D. (2007). Detecting coevolution
in and among protein domains. PLoS Computational
Biology, 3(11), 2122-34.
PYCOEVOL - A Python Workflow to Study Protein-protein Coevolution
149
