
INTRODUCING DATA PROVENANCE AND ERROR HANDLING
FOR NGS WORKFLOWS WITHIN THE MOLGENIS
COMPUTATIONAL FRAMEWORK
H. V. Byelas, M. Dijkstra and M. A. Swertz
Genomics Coordination Center, Department of Genetics, University Medical Center Groningen
Groningen, The Netherlands
Bioinformatics Center, University of Groningen, Groningen, The Netherlands
Keywords:
Bioinformatics, Workflow Management system, Data provenance, High performance computing.
Abstract:
Running bioinformatics analyses in a distributed computational environment and monitoring their executions
has become a huge challenge due to the size of data and complexity of analysis workflows. Some attempts
have been made to combine computational and data management in a single solution using the MOLGENIS
software generator. However, it was not clear how to explicitly specify output data for a particular research,
evaluate its quality or possibly repeat the analysis depending on results. We present here a new version of a
MOLGENIS computational framework for bioinformatics, which reflects lessons learnt and new requirements
from end users. We have improved our initial solution in two ways. First, we propose a new data model,
which describes a workflow as a graph in a relational database, where nodes are analysis operations and edges
are transactions between them. Inputs and outputs of the workflow nodes are explicitly specified. Second,
we have extended the executional logic to trace data, show how final results were created and how to handle
errors in the distributed environment. We illustrate system applications on several analysis workflows for next
generation sequencing.
1 INTRODUCTION
In recent years, we have approached several genome
wide associations and expression quantitative trait
loci studies (Y. Li and R. Jansen, 2010), (Li and
Swertz, 2009), (Fu and Swertz, 2007), (J. Fu and
R. Jansen, 2007). Every of these analyses involves
large numbers of shell or R scripts that have to be run
in parallel on large compute clusters or grids. Re-
cently, we were designated as data coordination cen-
ter for next generation sequencing projects, most no-
tably the Genome of the Netherlands project (GoNL)
(BBMRI-NL bioinformatics team, 2010). The GoNL
project is a Dutch National initiative funded by the
Dutch Biobanking consortium BBMRI-NL to estab-
lish a HapMap of the Dutch population by sequenc-
ing 750 Dutch individuals at 12x depth in 250 par-
ent/child trios using Illumina HiSeq 2000 sequenc-
ing. In the first phase of the project, a major com-
putational challenge was to run thousands of analysis
pipelines on 45TB of input data, each consisting of
tens of protocols (scripts), to output 90TB of align-
ment of the DNA reads to the reference genome and
calls of Single Nucleotide Polymorphism (SNPs) in
this aligned data set (analogous to the pipelines de-
scribed in the 1000 Genomes project (1000 Genomes
Project Consortium, 2010)). Besides a computational
challenge, tracking all input and produced biomateri-
als adds a data management component to the prob-
lem, i.e. flowcells, lanes, samples, DNA libraries,
trios, QC reports, raw fq.gz files, alignment BAM files
and variant calling VCF files.
Starting all pipelines manually becomes very time
consuming for such a large and computationally in-
tensive research, e.g. each sample has been measured
in three lanes on average, resulting in 2250 lanes
total needing alignment requiring 15 analysis steps
totaling each a runtime of 50 hours of computation
on four cpu cores. Furthermore, conducting the data
management, which includes keeping track of what
computational protocols are used to produce partic-
ular research results, separately from computational
management makes it error prone.
In the first version of the MOLGENIS (Swertz
and Jansen, 2007), (M. Swertz and R. Jansen, 2007)
computational framework - MCF (H. Byelas and M.
42
V. Byelas H., Dijkstra M. and A. Swertz M..
INTRODUCING DATA PROVENANCE AND ERROR HANDLING FOR NGS WORKFLOWS WITHIN THE MOLGENIS COMPUTATIONAL FRAME-
WORK.
DOI: 10.5220/0003738900420050
In Proceedings of the International Conference on Bioinformatics Models, Methods and Algorithms (BIOINFORMATICS-2012), pages 42-50
ISBN: 978-989-8425-90-4
Copyright
c
2012 SCITEPRESS (Science and Technology Publications, Lda.)

Swertz, 2011), we aimed to combine computational
and data management in a single system. However,
several important functionalities were left out of the
initial solution. These included easy tracing of the
data produced and run-time error handling during
workflow execution. By error handling, we mean sce-
narios which can be applied if some data is missing or
quality indications for results are low.
In the new version of the MCF, our main goal is
to help a user to understand how the complex analyses
were accomplished and what computational processes
were used. In this paper, we describe the design and
implementation challenges to specifying data prove-
nance and handlling errors during workflow execu-
tion. In particular, we present our solution for the
NGS workflows used in the GoNL project.
This paper is structured as follows. Section 2 re-
views related work in the context of data provenance
and error handling in other workflow management
systems. Section 3 describes the new model in de-
tails. Section 4 reviews the system design in rough
lines. Section 5 details the new functional logic of the
system for error handling for generic pipelines and, in
particular - for the NGS pipeline and gives examples
of generated user interfaces. Section 6 discusses our
experience with using the system in practice. Section
7 concludes the paper.
2 RELATED WORK
Extensive overviews of data provenance approaches
and techniques are given in (Glavic and Dittrich,
2007) and (Simmhan and Gannon, 2005). We did
not set out to develop a new theoretical model for
data provenance, rather, we are interested in using a
lightweight data provenance approach for the specific
bioinformatics domain. In our scenario, several indi-
vidual researchers involved in the same project would
like to collaborate on analysing data. Here, data
sources, intermediate and final analysis results and
computational processes are often shared between re-
searchers to speed up the analysis. Consequently, data
and process oriented provenance should be combined
in one solution. Without proper data annotation, the
analysis results can easily be overwritten or dupli-
cated when the analysis is re-run on the same data
with other parameters, in other execution settings or
just at an other time. We are interested in methods to
avoid such situations.
J. Yu et al. present a taxonomy of workflow man-
agement systems in their work (Yu and Buyya, 2005).
Data provenance is modelled and implemented in var-
ious ways in different data warehouses and workflow
management systems. In the Taverna 2.0 workflow
system (Oinn and Greenwood, 2005), the semantics
of workflows is modelled using so-called traces(Sroka
and Goble, 2010), which record sequences of events.
These events can be of three types: input events, rep-
resenting values on input ports, atomic executions
and output events, i.e. values on output ports. The
model is implemented in the system using the file-
based database. Taverna can remember workflow runs
and only saves the results to file system after running
a workflow with different inputs. Users have the pos-
sibility to switch data provenance options off, which
can give a performance benefit and reduce a disk-
space usage. By default, Taverna stores the input val-
ues, intermediate values and the results of workflow
runs in memory. When Taverna is closed the values
are lost. In-memory storage can also be switched off
for workflows where passed data is large. In Kepler
(Altintas and Berkley, 2004), ordered trees are used to
represent data products of workflows (M. K. Anand
and T. McPhillips, 2009). These trees are stored
in trace files using the XML format. Kepler allows
browsing and navigation in the history of execution
traces by querying trace files. Queries can become
large and complex to produce scientifically meaning-
ful results. Kepler also enables outputs of one run
to be used as inputs of another. The specific bioin-
formatics management systems Galaxy (Blankenberg
and Taylor, 2007) tracks metadata to ensure repro-
ducibility of analyses. However, it is not sufficient
to capture the intent of analysis. Galaxy is not really
integrated with any data management system. All the
results produced by all analysis runs are saved in a
disk storage, which considerably increases the storage
requirements for large analyses. Furthermore, Galaxy
considers a workflow as a black box and if errors oc-
cur during execution, they will be received as the end
result of the analysis.
Keeping in mind features of the workflow systems
we are aware of, it emerges that even data provenance
is present to some extent in all of them. However,
an automatic error handling is missing. Adding error
handling can save a lot of time for computationally in-
tensive analyses, where a re-run of an individual anal-
ysis operation ad hoc instead of re-running the whole
workflow later would save a lot of time and efforts.
It can be difficult to find a good quality indications
of the successful completion of operations. These in-
dicators should be present in the model to specify re-
covery scenarios. Comparing our developments to the
above workflow systems, we aimed to create a spe-
cific solution for a particular bioinformatics analysis
(i.e. NGS workflows). However, we want to introduce
more advanced error handling into the system. In our
INTRODUCING DATA PROVENANCE AND ERROR HANDLING FOR NGS WORKFLOWS WITHIN THE
MOLGENIS COMPUTATIONAL FRAMEWORK
43
case, the set of possible failures is definite, hence, it
is possible to overlay all of them. This is discussed in
detail below.
3 INTEGRATED METADATA
MODEL
Before talking about the integrated model for data
and computational management, we briefly review
the main requirements for the system. First, it is im-
portant to provide less technically involved bioinfor-
maticians with simple interfaces to specify the work-
flow of commands they need, while scaling up to
hundreds of jobs to get the terabytes of genetic data
processed. Furthermore, the meta model should effi-
ciently specify data provenance and workflow execu-
tion logic. Second, it should be possible to monitor
workflow execution and the data products produced
in these workflows in one seamless solution. Third,
it is crucial to spread executions among the available
resources to shorten the analysis time, thereby im-
proving system productivity. Finally, research results
and quality control scores must be efficiently repre-
sented for final users. The results should be consid-
ered as part of the biological entity that is the target
of study (e.g. samples, lanes and trios in GoNL; co-
horts, individuals, markers, probes, and phenotypes
in QTL studies). In our scenarios, actual data results
are stored on remote disks, where computations took
place, only data quality indications are recorded in the
database for monitoring.
MOLGENIS is a software toolkit to rapidly gen-
erate rich biology software platforms from database
and user interface models which each are described
in the XML format. We currently use the eXtensi-
ble meta data model for Genotypes And Phenotypes
(XGAP) as main model which already covers an ex-
tensive list of biological experiments (Genomics Co-
ordination Center, Groningen, 2011), (M. Swertz and
R. Jansen, 2010). This core of the model is reused
for many projects and is now being further developed
for other domains in collaboration with NL-NBIC,
BBMRI-NL, EU-GEN2PHEN, EU-BioSHARE, and
EU-PANACEA consortia and consists of a number of
modules. However, each experiment/biotechnology
can have its own specific extension of the shared
model. Here, we discuss only the specific data model
extension used for NGS experiments (MOLGENIS
NGS) combined with the computational data model
extension (MOLGENIS Compute), which is generic
for any computational application generated using
MOLGENIS.
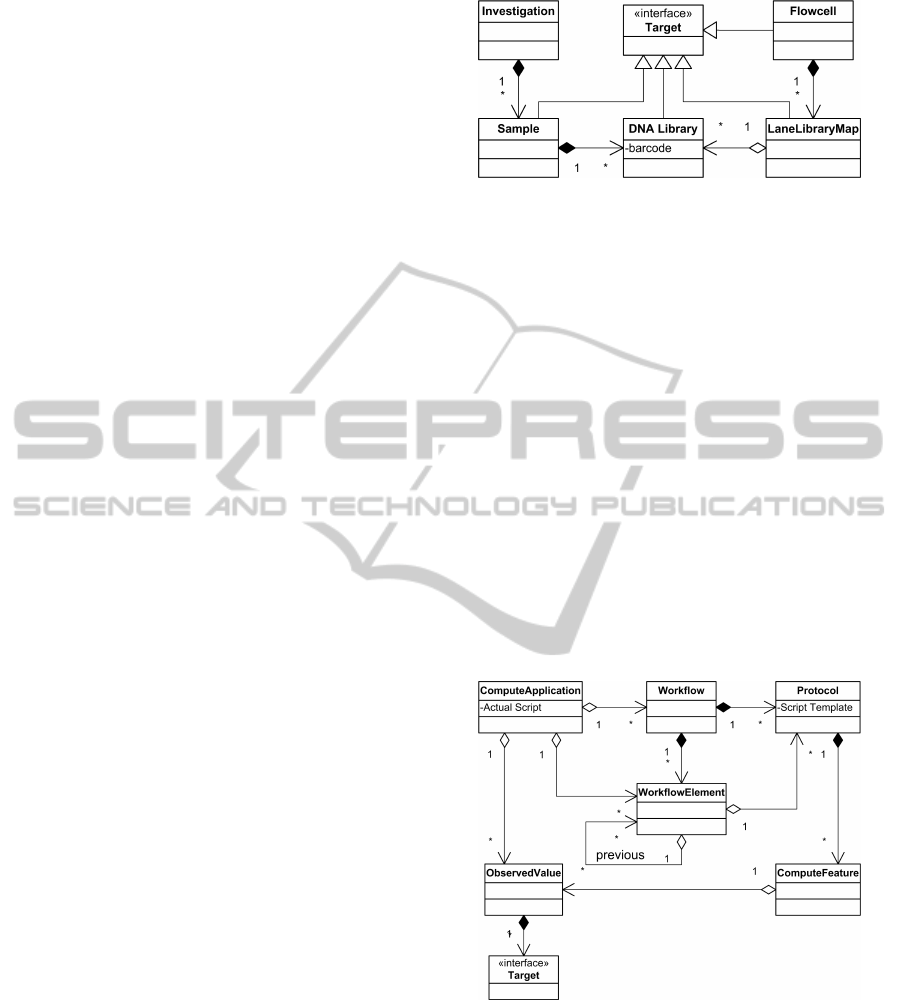
The design of the NGS model (Fig. 1) is based
Figure 1: Core of the NGS model.
on the laboratory process when using Illumina HiSeq
2000 which produces the input data for our analysis
workflows. It starts in a ”wet lab”, where a set of sam-
ples (Sample elements) are taken from individual(s).
These samples are involved in one or more analysis
projects, which are the Investigation elements. Sam-
ples are split into DNA Libraries, optionally using
barcodes. These libraries are then analysed in Flow-
cells in various orders, where currently eight lanes
of one flowcell can be filled with several libraries
of samples. Information about mapping libraries to
flowcell lanes and corresponding result analysis data
is the input ”worksheet” for NGS analysis workflows.
In addition to the input from the ”wet lab” data, we in-
troduce the Target interface into the model to enable
us to later uniformly refer to these subjects from dif-
ferent analyses. The Target interface is present in the
generic MOLGENIS model. All NGS analysis targets
implement it.
Figure 2: Core of the compute model.
The simplified compute model is presented in Fig-
ure 2. The Workflow element represents the whole
analysis. Workflow consists of WorkflowElements.
WorkflowElements know their forerunners (dependen-
cies). In this way, a workflow graph is built up, where
WorkflowElements are the nodes of the graph and
edges are the transactions between them. Every node
performs an operation, which is specified in a Proto-
col element. Our system aims to support specifying of
BIOINFORMATICS 2012 - International Conference on Bioinformatics Models, Methods and Algorithms
44
any external analysis tool, which can be invoked from
a command line or be run as an executable script (e.g.
a shell or R-script). Each Protocol contains a script
template. The use of templates is described in Section
5.1. Protocol can have a number of ComputeFeatures.
In the user interface, every ComputeFeature becomes
a field to enter an analysis parameter. Some analy-
sis parameters can be predefined as having a default
and stored in the database, or can be marked to be
technical so not for view by the end-user but only the
protocol designer. The ComputeApplication elements
record application of Workflows and Protocols during
the analysis, i.e., what actual analysis scripts (filled
in templates) were actually run. ComputeApplication
records for each ComputeFeature what parameters or
data files were used (input) and what files or variables
were produced (output) using ObservedValue element
to link ComputeFeature, Targets and Protocol.
To conclude, the Target interface is the link be-
tween the data management for the NGS analysis
and for computation management, i.e., the subclasses
Sample and Lane are typical targets of compute pro-
tocol applications. The implementation of this model
into an integrated software solution is the topic of the
next section.
4 FRAMEWORK
ARCHITECTURE
Since, the system design has not been changed exten-
sively from the first version of MOLGENIS compute
(H. Byelas and M. Swertz, 2011), we only present it
briefly here. In our developments, we concentrated on
the functionality requested and that most appreciated
by the end system users. We have two types of users:
• bioinformaticians, who design and edit analysis
workflows;
• biologists, who run analyses and examine results.
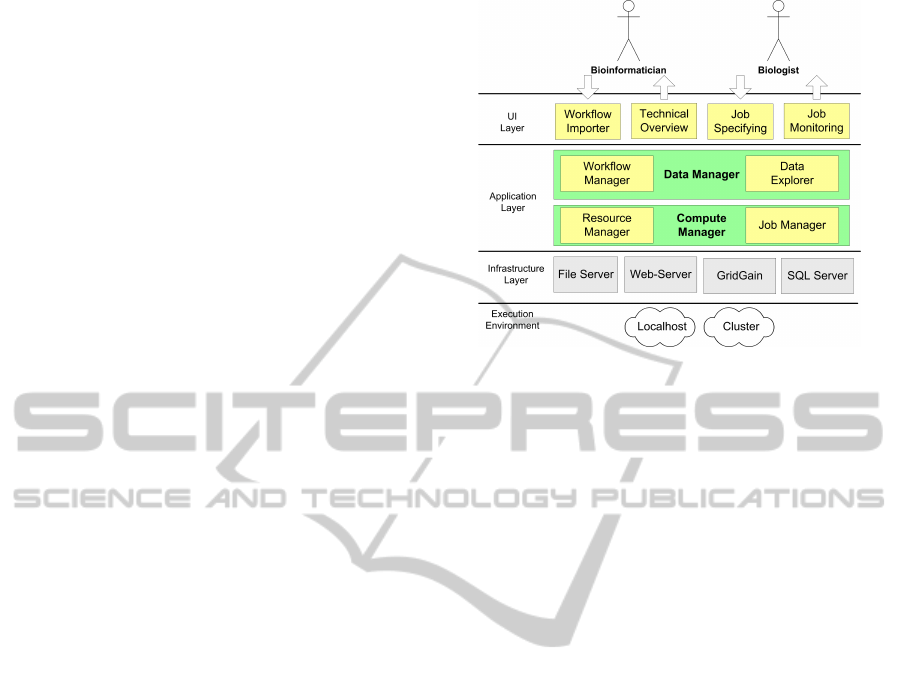
4.1 System Design
The visual representation of the system architecture
(Figure 3) has been changed accordingly to the new
use-case scenarios and functionality.
We have learnt in practice, that bioinformaticians
want to have a simple way to import/export the work-
flows and NGS data into the system, where, later, they
can edit some elements of it. We support two ways to
import workflows. First, it is an import of a work-
flow described as an Excel file in the MOLGENIS
standard format. Here, each Excel sheet represents
Figure 3: Generic archtitecture for MOLGENIS compute
applications.
a database table with workflows data, i.e., one Ex-
cel sheet can list the properties of Workflows, Pro-
tocols, ComputeFeatures and so on. Second, it is a
single tool import from the Galaxy (Blankenberg and
Taylor, 2007) XML tool description file. Here, a sin-
gle tool operation becomes the whole analysis work-
flow. Additionally, for NGS data, we support import-
ing a ’worksheet’ listing all Flowcells, Lane, Sample
and emphLibrary properties from one Excel file that
we received from the ”wet lab”. Another function-
ality, we found important for bioinformaticians, is to
be able to overview the system performance and to
receive technical reports about workflow executions,
e.g., how many workflows completed/failed, execu-
tion times, CPU load, failure frequency.
Biologists’ requirements are straightforward.
They want to be able to start an analysis pipeline in
a user friendly way by selecting analysis targets in
batch, setting batch level and individual level param-
eters, pushing a button to generate scripts and submit
those to the compute back-end, monitor its execution
progress and finally see workflow results locally. In
our scenario, results include log files from analysis
tools, the output files of the analysis procedure and
quality control scores. Hence, we concentrated our
developments on two user interfaces for biologists to
enter analysis parameters and monitor analysis execu-
tion.
Both biologists and bioinformaticians can browse
and edit the NGS database. If a biologist is more inter-
ested in reviewing results, a bioinformatician is more
interested in editing workflow, which is nothing more
than editing database records. These functionalities
are standard for MOLGENIS-based systems. Exe-
cuting workflows includes starting resources to exe-
cute them and sending analysis scripts for execution.
INTRODUCING DATA PROVENANCE AND ERROR HANDLING FOR NGS WORKFLOWS WITHIN THE
MOLGENIS COMPUTATIONAL FRAMEWORK
45
It is implemented in the Compute Manager module
(Fig.4).
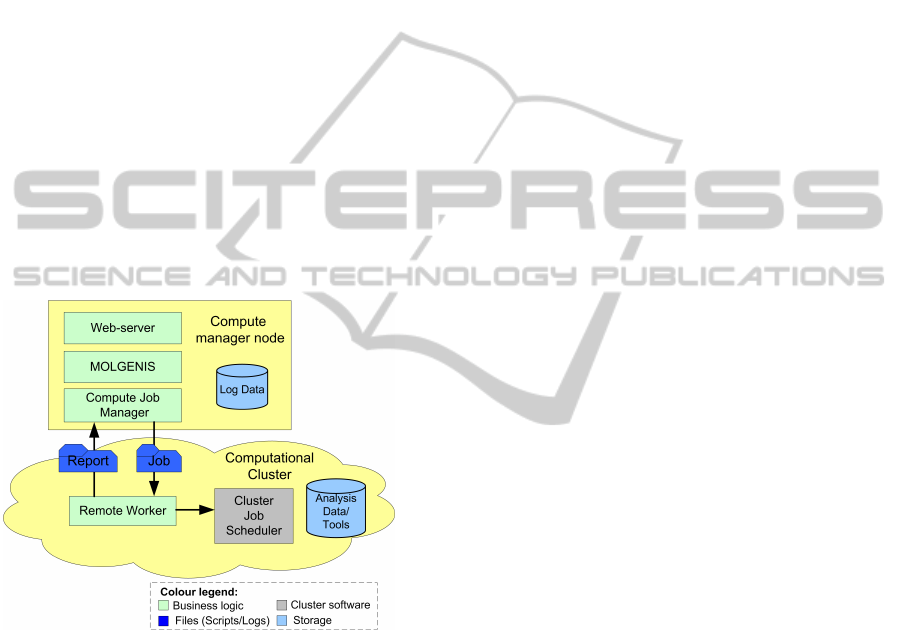
4.2 System Topology
We also refined the system topology (Fig.4) specifi-
cally for the NGS analysis. Now, all analysis scripts
run in one place, e.g. in the Millipede cluster
in Groningen (Millipede Cluster Team, Groningen,
2010). This solution was taken to avoid transferring
large files in the network. The input file sizes for
the GoNL project are about 6-9 GB and the interme-
dia workflow results grow up to 60 GB per Lane, to-
talling 45TB of input data and 450TB of intermediate
date. In the future, we are planning to re-introduce
a grid solution into the system, addressing then the
need for optimised large data management in grid en-
vironments. All statistics are stored in the MOLGE-
NIS database, based on MySQL, next to the clus-
ter. Users have an access to the database through
a MOLGENIS-generated user interface (see Section
5.4) running on the Tomcat web server.
Figure 4: System topology for NGS analyses.
All analysis scripts are generated in the database
and transported from Job Manager to the cluster. The
communication and data transfer are implemented
using the GridGain development platform (Ivanov,
2010) and the Ganymed SSH-2 library for Java (Swiss
Federal Institute of Technology, 2006). In the imple-
mentation using GridGain (shown in Fig.4), the re-
mote Worker receives jobs and forward them to the
cluster PBS scheduler and monitors their execution.
When an analysis operation is finished, Worker trans-
fers specified log files into the MOLGENIS database.
In the implementation using Ganymed SSH-2, Job
Manager sends jobs directly to the cluster PBS sched-
uler via a secure channel to the frontend cluster node.
This increases the load on the frontend node and can
cause a problem when cluster is heavily used by other
users. Hence, the GridGain solution is preferable for a
large-scale analysis and better tested so far. All anal-
ysis tools used in workflows are pre-installed in the
cluster.
5 DATA PROVENANCE AND
ERROR HANDLING
5.1 Using String Templates to Specify
Analysis Products
All run scripts and log information about analysis
runs are stored in the MOLGENIS database. The ex-
act location of files produced during an analysis is
known only after a user has entered all input param-
eters in the user interface and actual analysis script
have been generated. However, we would like to
have a way to pre-define file locations in the database.
For this, we use the Freemarker template proces-
sor that we use to define ComputeProtocol scripts to
pre-format output locations. The use of templates
for specifying input/outputs of operation allows us to
trace data. An example of a script template of the
Protocol X is listing below.
${tooldir}/${bwa} aln
${resdir}/${genome}/indices/${index}
${datadir}/${bwa-in} -t ${cores}
-f ${bwa-out}
Variables in curly brackets will be replaced with
actual values during template processing. Some vari-
ables are predefined in a database, others are re-
ceived from a user interface. Furthermore, some vari-
ables can consist of a combination of others: we call
these complex variables. They are, in turn, also con-
structed using templates. In this template, bwa-in and
bwa-out are variables, which specify input and out-
put files for the analysis operation. The template for
bwa-out is shown below:
${outdir}/${sample}/${id}.${index}.sai
Here, the complex variable consists of four sim-
ple variables, which are placed in curly brackets. In
our data model (Section 3), bwa-in and bwa-out are
ComputeFeatures of the Protocol X. After applying
Protocol X, they will receive actual values. For exam-
ple, bwa-out can be given the value:
results/run01/bwa/sample01/bwa01.sai
This value of ComputeFeatures bwa-out is
recorded in a database as an ObservedValue. Hence,
we know the locations of output results of analysis
BIOINFORMATICS 2012 - International Conference on Bioinformatics Models, Methods and Algorithms
46
operations. Typical analysis tools, in particular, tools
we are using in the NGS workflow (e.g. GATK (The
Genome Analysis Toolkit, 2011), FastQC (FastQC,
2011)), produce several outputs of two types: these
are the actual analysis output and log files about anal-
ysis execution. Besides log files from analysis tools,
cluster PBS software writes script command line er-
ror/outputs to the cluster file system. We consider
these files as technical information about the analy-
sis execution. We add information about analysis run
time, machine on which analysis took place and sizes
of data output files to the log file as well. All this
technical information is transferred back to the MOL-
GENIS database. Now, we can construct a summary
about workflow execution and a user can review it on-
line without searching for it in the cluster storage.
5.2 Generic Error Handling for
Analysis Workflows
In general, the content of the log files and actual ex-
istence of output files on the cluster are good indica-
tions for successful analysis execution. First we will
discuss the problem indications and resolving strate-
gies we are considering for a generic workflow. We
propose two error indicators, which are unexpected
output size and output absence. We mark them as
UNEXP. and ABSENT, respectively. Here, by an ex-
pected size, we mean file sizes in bytes. Usually, it
is possible to estimate an approximate size range for
output files in terms of MBs or GBs, for example, the
range between 500 MB and 2 GB. In bioinformatics
analyses, this number often depends on the size of an
input dataset.
Our recovery strategies also include two opera-
tions. The first is to set an error indicator to a database
and continue analysis (INDIC.). The second is to re-
peat an analysis operation one or more times (RE-
PEAT) until a correct result is achieved, which is a
kind of a backward error recovery. In the case of re-
peated failures (e.g. n > 3), the analysis should be
stopped. Recovery operations are applied if any kind
of output, the analysis data or log files, are absent.
Figure 5: Generic error/recovery matrix.
The proposed matrix of error indications and re-
covery operations for generic workflows is shown in
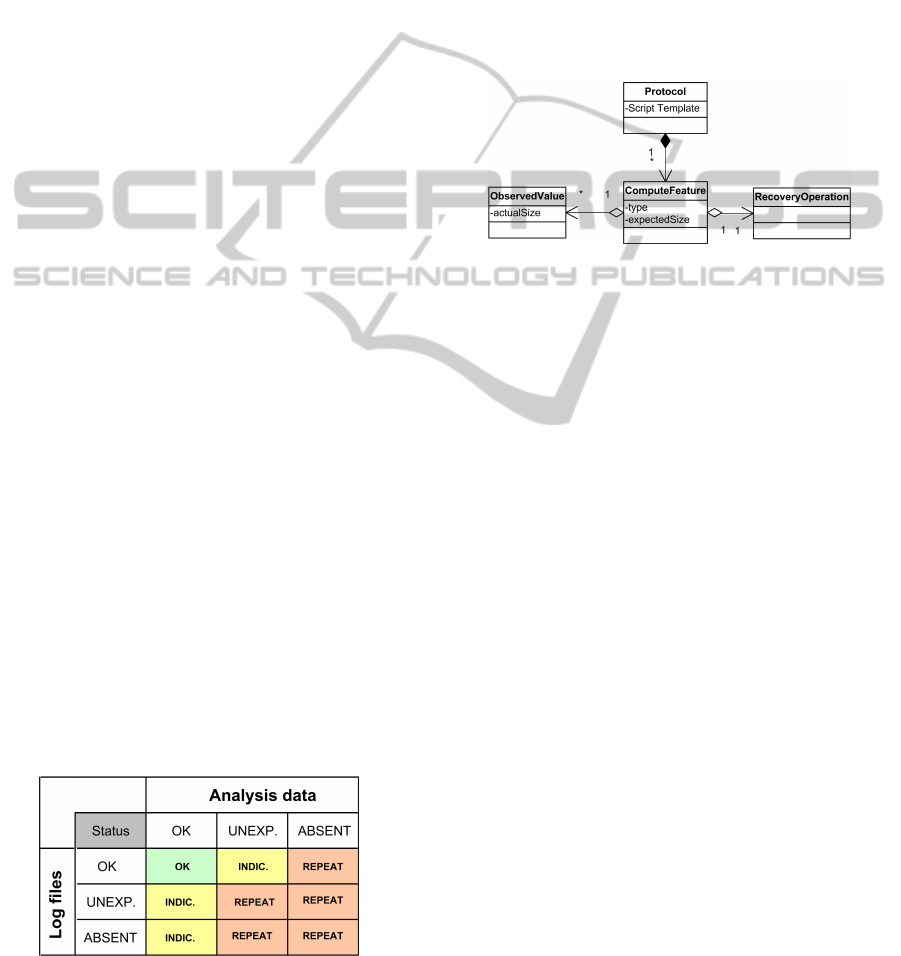
Figure 5. We extended the Compute model (Section
3) with a RecoveryOperation element to incorporate
this matrix into the system logic. We also added two
fields to the ComputeFeature element: these are the
type of output and the expected file size range (see
Fig. 6). ComputeFeature that specifies an output type,
can have values data or log. For example, the ex-
pected size of the error log file produced by the clus-
ter software, if a script ran successfully, is zero bytes.
Hence, if the size is larger, we indicate it in the Ob-
servedValue object and transfer the contents of the log
file to the database.
Figure 6: Introducing error-handling into compute model.
Additionally, we found the operation execution
time being a practical indicator. We always indicate
ComputeApplications in our NGS workflow, if their
execution take less than 30 seconds. Certainly, more
advanced error handling can be applied for particular
cases, when we have more knowledge about the anal-
ysis operations and the correlations between their in-
put and output data. This situation for the NGS anal-
ysis is described in the next section.
5.3 Error Handling for the NGS
Workflow
The NGS analysis workflows are highly computation-
ally intensive. For instance, our NGS lane analysis
workflow takes more than 50 hours to run on a ma-
chine with 4 3GHz AMD Opteron cores. Having
thousands of lanes to analyse for the GoNL project,
we would not like to rely only on the context of the
log files. We know that the number of DNA sequence
reads is constant from input workflow files to final re-
sults of the analysis. The number of reads in sequence
data files can be calculated using the Genome Anal-
ysis Toolkit (GATK (The Genome Analysis Toolkit,
2011)). Checking this pre-/postcondition before/after
workflow operations guarantees correct completion of
the analysis. Now, we can leave out reading log files
for error handling and, instead of it, we just take into
account the number of DNA reads in analysis files.
It simplifies the error handling logic (see Fig. 7),
but adds some extra computational overhead to the
INTRODUCING DATA PROVENANCE AND ERROR HANDLING FOR NGS WORKFLOWS WITHIN THE
MOLGENIS COMPUTATIONAL FRAMEWORK
47
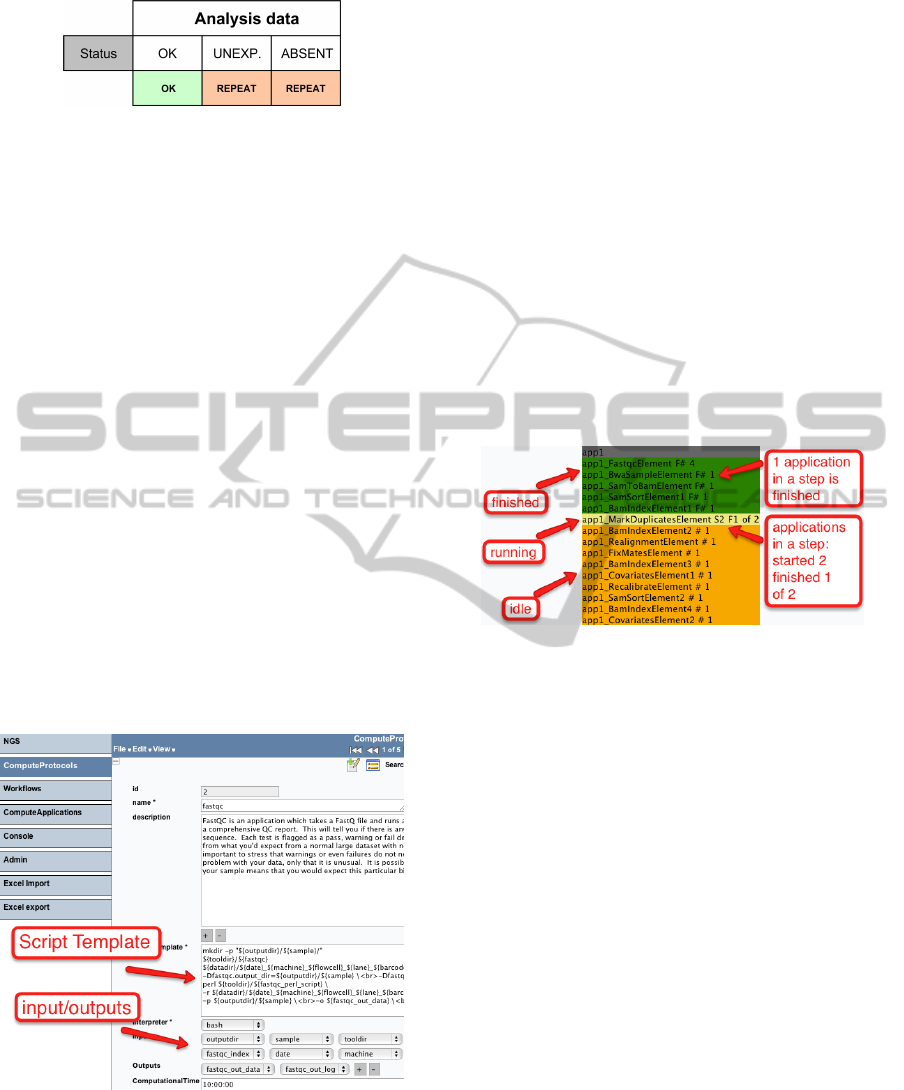
Figure 7: Error-handling matrix for the NGS workflows.
analysis (i.e. a counting reads operation, which takes
about half an hour for datasets we are considering in
our project). Hence, it is important to select right
points in the workflow logic, where to perform ad-
vanced conditional checks. How results of the work-
flow execution are shown to users is discussed in the
next section.
5.4 Implementation of User Interfaces
MOLGENIS-generated web interfaces are used for
diverse bioinformatics applications. Because of this
automated procedure the style of user interfaces is
uniform easing learning the system. For the NGS
analysis, a user have an access to several generated
interfaces to overview lanes, flowcells etc. for anal-
ysis, edit different elements of workflows, and view
progress and analysis results.
In practice, after importing a workflow to a MOL-
GENIS database, a user commonly can edit
• a sequence of workflow elements,
• analysis script templates or their inputs/outputs,
• default values of parameters.
Figure 8: Generated web user interface for editing an anal-
ysis element.
An example of the generated user interface for
ComputeProtocol is shown in Figure 8. Here, users
can edit the listing of a template and specify in-
puts/outputs, which they are interested in. It is com-
mon that an analysis workflow will contain a few ty-
pos in templates or wrong paths to analysis tools, es-
pecially when new protocols/tools are added or when
the system is deployed in a new environment. Hence,
a bioinformatician uses this interface mostly during
the workflow testing. Interfaces to edit a sequence of
workflow elements and default parameters look simi-
lar to the one presented in Figure 8.
We show a progress of a workflow using a simple
coloured table. The table displays the names of anal-
ysis steps and a number of ComputeApplications in
steps, which are running in parallel. Colours indicate
the status of a step.
Figure 9 shows the workflow progress table with
the running NGS alignment analysis. This workflow
consists of 15 steps and, 19 ComputeApplications,
which are generated from 12 different ComputeProto-
cols. In some steps, ComputeApplications are running
in parallel.
Figure 9: Workflow monitoring.
In Figure 9, a number of steps is finished, one is
currently running and some are waiting in a queue. In
the step currently running, one ComputeApplication
is already finished, but the JobManager (see Fig. 3)
is waiting for the second ComputeApplication to be
finished before starting the next step.
Even if we are using one table per workflow, this
visualisation does not scale well to show many run-
ning pipelines efficiently. Furthermore, it is not really
informative, if a user wants to see dependencies or ex-
ecution times of workflow elements in a workflow in a
single image. Some ideas on how to improve current
workflow visualisation are discussed in Section 6.
Another important functionality is to have an
overview of the results of analyses when it is finished.
As it is mentioned in Section 5.1, we store all run
scripts and log information about runs in a database
as ComputeApplications. Figure 10 shows an exam-
ple of a single analysis operation execution. Here, a
user can see an actual script, which has been run, and
the logs about its execution. In this example, the error
log is empty, indicating the successful completion of
the operation. A user can navigate from ComputeAp-
plication to its ObservedValues to see parameters of
the analysis.
BIOINFORMATICS 2012 - International Conference on Bioinformatics Models, Methods and Algorithms
48
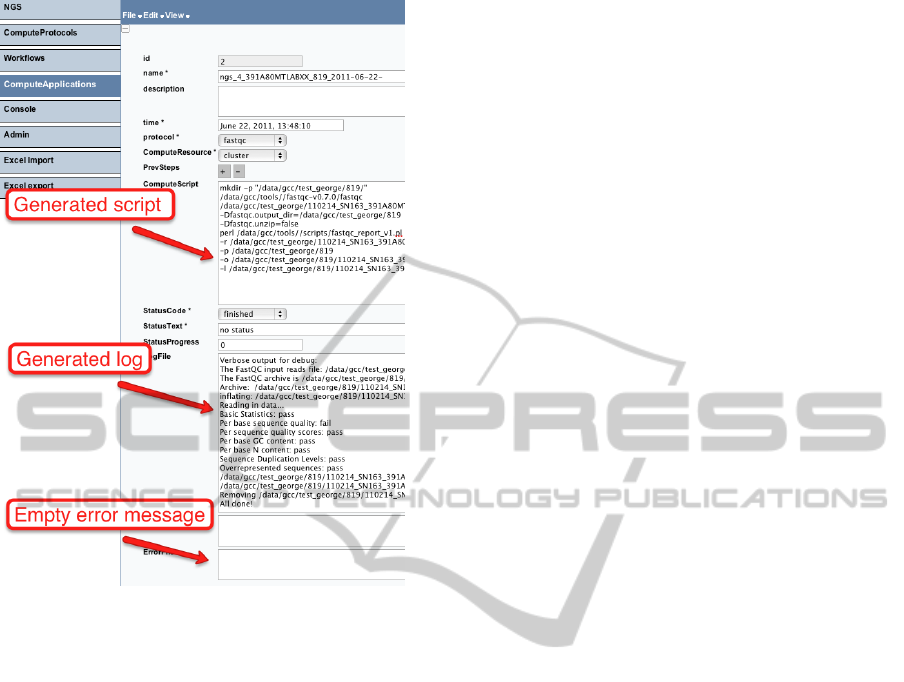
Figure 10: Viewing analysis results in the user interface.
To summarise, we enable a user to navigate
through different user interfaces and review all details
about the analysis and its targets online. Making a
statistical summary about the analyses run is also pos-
sible, but this completely depends on particular user
needs and wishes and we do not standardise it.
6 DISCUSSION
The main results and findings obtained during this re-
search can be considered in three areas.
Specifying an analysis: We have tried to combine
the NGS data model with the generic model for com-
putational management. This leads us to the specific
solution to support only NGS analysis workflows. We
narrowed the possible structural design of the work-
flow. For example, we left out conditional execution
of workflow elements and iteration over several pa-
rameters of a workflow element. This was done, be-
cause we do not need these complex mechanisms in
workflows we consider necessary for NGS. We have
also not included dependancies of analysis operations
on resources, such as analysis tools, in the model. We
aimed to use a less complex workflow model, that
covers practical problems for NGS analyses.
Monitoring analysis execution and error han-
dling: Defining one explicit pre-/post-condition, i.e.
a number of DNA sequence reads, which guaran-
tees the correct completion of the operation, allows
us to easily introduce error handling into the sys-
tem implementation for NGS (see Fig. 7). Theo-
retically, it is possible to define such indications for
any generic analysis operations. However, it can be
time-consuming to find different criteria and imple-
ment it, especially, if the number of analysis operation
is large and their nature is different. The implemen-
tation basically includes implementing a log/error file
parser, which should interpret outputs from analysis
tools. These tasks are not complex, but depend di-
rectly on a number and complexity of tools and their
expected outputs. Still, our recovery matrix in Figure
5 is easy to implement for generic workflows and use
in the distributed execution environment.
We show a progress of a workflow in a coloured
table (Fig. 9). A number of interesting aspects, such
as a workflow graph structure, execution times of in-
dividual workflow operations, actual machines where
executions take place and applying error-handling ap-
plications, are missing in the current progress repre-
sentation. We are planning to incorporate these as-
pects in a future version, where the workflow will be
visualised as a graph of analysis operations. A pop-up
window with detailed information about each opera-
tion will be shown, when a user navigates through a
workflow graph with a mouse.
Presenting analysis results: Even if we save all
logs produced by analysis tools to a database, the in-
formation would not always be informative for an av-
erage user. Users can be familiar with running com-
plete workflows and interested in the final analysis
results. Adding simple indicators to the logging in-
formation, such as execution times, sizes of output
files etc., raises the quality of logging reports. Fur-
thermore, it helps to foresee what computational re-
sources will be needed to run an analysis, in terms of
computational time and storage capacity.
Having all the information about analyses means,
more views on data can be constructed to show a bio-
logical target and the analyses applied to it. The gen-
erated user interface is fully customisable, so that it
can be adjusted for user preferences. Some informa-
tion can be hidden in a user interface, which makes a
view on the data more compact and easier to compre-
hend.
7 CONCLUSIONS
We demonstrated a data model to record analysis
INTRODUCING DATA PROVENANCE AND ERROR HANDLING FOR NGS WORKFLOWS WITHIN THE
MOLGENIS COMPUTATIONAL FRAMEWORK
49

provenance and a data model to record NGS analyses.
We reported implementation of this model and exten-
sion of the existing compute framework to accommo-
date the large scale of analysis in the MOLGENIS
open source software (Genomics Coordination Cen-
ter, Groningen, 2011). Currently we are using these
models for both GoNL and in-house analyses. Based
on these results, we are convinced that newly estab-
lished NGS centres can benefit from this work when
setting up data management and analysis infrastruc-
ture, optionally using the MOLGENIS framework to
speed up customisations where needed.
ACKNOWLEDGEMENTS
We thank BBMRI-NL (funded by the Netherlands Or-
ganisation for Scientific Research, NWO), the Nether-
lands Bioinformatics Center (NBIC)/BioAssist NGS
and Biobanking task forces, NWO (Rubicon Grant
825.09.008), and Netherlands Proteomics Center II
(reference NPC II E4.2) for financial support and
helpful collaborations. We thank the GATK team at
the Broad Institute, GEN2PHEN (funded by the Eu-
ropean Commission FP7-HEALTH contract 200754),
PANACEA (funded by the European Commission
FP7 contract 222936), and our collaborators Freerk
van Dijk, Alexandros Kanterakis, Laurent Francioli,
Danny Arends, and Joeri van der Velde at Groningen
Genomics Coordination Center and Groningen Bioin-
formatics Center for fruitful discussions on MOLGE-
NIS extensible models for genotypes, phenotypes and
the analysis protocols surrounding these type of data.
REFERENCES
1000 Genomes Project Consortium (2010). A map of hu-
man genome variation from population-scale sequenc-
ing. Nature, 467(7319):1061–73.
Altintas, I. and Berkley, C. (2004). Kepler: Towards a grid-
enabled system for scientific workflows. In in pro-
ceedings of GGF10-The Tenth Global Grid Forum.
BBMRI-NL bioinformatics team (2010). Biobanking
and biomolecular research infrastructure. http://
www.bbmriwiki.nl.
Blankenberg, D. and Taylor, J. (2007). A framework for col-
laborative analysis of encode data: making large-scale
analyses biologist-friendly. Genome Res., 17:6:960 –
4.
FastQC (2011). Babraham bioinformatics. http://
www.bioinformatics.bbsrc.ac.uk/projects/fastqc/.
Fu, J. and Swertz, M. (2007). Metanetwork: a computa-
tional protocol for the genetic study of metabolic net-
works. Nature Protocols 2, pages 685 – 694.
Genomics Coordination Center, Groningen (2011). Molge-
nis web-site. http://www.molgenis.org.
Glavic, B. and Dittrich, K. (2007). Data provenance: A cat-
egorization of existing approaches. In Datenbanksys-
teme in Business, Technologie und Web, pages 227–
241.
H. Byelas and M. Swertz (2011). Towards a molgenis
based computational framework. in proceedings of
the 19th EUROMICRO International Conference on
Parallel, Distributed and Network-Based Computing,
pages 331–339.
Ivanov, N. (2010). Cloud development platform. http://
gridgain.com/.
J. Fu and R. Jansen (2007). System-wide molecular evi-
dence for phenotypic buffering in arabidopsis. Nature
Genetics, 41:685 – 694.
Li, Y. and Swertz, M. (2009). DesignGG: an R-package and
web tool for the optimal design of genetical genomics.
BMC Bioinformatics, 10:188.
M. K. Anand and T. McPhillips (2009). Efficient prove-
nance storage over nested data collections. in pro-
ceedings of the 12th International Conference on Ex-
tending Database Technology: Advances in Database
Technology.
M. Swertz and R. Jansen (2007). The molgenis toolkit:
rapid prototyping of biosoftware at the push of a but-
ton. BMC Bioinformatics, 11:12.
M. Swertz and R. Jansen (2010). Xgap: a uniform and ex-
tensible data model and software platform for geno-
type and phenotype experiments. Genome Biology,
11:27.
Millipede Cluster Team, Groningen (2010). newblock
Clustervision opteron cluster. http://www.rug.nl/cit/
hpcv/faciliteiten/index.
Oinn, T. and Greenwood, M. (2005). Taverna: lessons in
creating a workflow environment for the life sciences.
Concurrency and Computation: Practice and Experi-
ence, 18:10:1067 – 1100.
Simmhan, Y. and Gannon, D. (2005). A survey of data
provenance techniques. Technical report.
Sroka, J. and Goble, C. (2010). A formal semantics for the
taverna 2 workflow model. Journal of Computer and
System Sciences, 76:6:490–508.
Swertz, M. and Jansen, R. (2007). Beyond standardization:
dynamic software infrastructures for systems biology.
Nature Reviews Genetics, 8:3:235–43.
Swiss Federal Institute of Technology, Z. (2006). Ganymed
ssh-2 for java. http://www.ganymed.ethz.ch/ssh2.
The Genome Analysis Toolkit (2011). Broad institute.
http://www.broadinstitute.org/.
Y. Li and R. Jansen (2010). Global genetic robustness of the
alternative splicing machinery in caenorhabditis ele-
gans. Genetics, 186(1):405–10.
Yu, J. and Buyya, R. (2005). A taxonomy of scientific
workflow systems for grid computing. ACM SIGMOD
Record, 34:3.
BIOINFORMATICS 2012 - International Conference on Bioinformatics Models, Methods and Algorithms
50
