
AN INDOOR LOCALIZATION ALGORITHM BASED IN WEIBULL
DISTRIBUTION AND BAYESIAN CLASSIFIER
S. Orozco-Ochoa, X. A. Vila-Sobrino, I. G
´
omez-Conde and M. J. Lado
Escola Superior de Enxe
˜
ner
´
ıa Inform
´
atica, Universidade de Vigo, As lagoas S/N, 32004, Ourense, Spain
Keywords:
Bluetooth, Received Signal Strength, Indoor Positioning, Weibull, Bayes, RSS.
Abstract:
The location of objects and people by the use of Global Positioning System (GPS) or Global System for Mobile
Communications (GSM) network is increasingly used to provide location-based services. These technologies
work well outdoors and when the required accuracy is not very high, up to 10 meters. This paper describes
an algorithm for monitoring elderly people at home, by continuously taking its position, which uses the RSS
information exchanged between Bluetooth devices, Weibull distributions and Bayesian classifiers. This algo-
rithm has been validated in a real environment, an area of 13 × 12 meters, with several rooms and corridors,
where zones of approximately 6 square meters have been delimited. Our algorithm achieved a rate of correct
detections of 91.875%.
1 INTRODUCTION
Today’s highly technical society is continuously de-
manding more advanced and sophisticated services.
Communication networks are all pervasive: there are
more than 5000 million mobile phones and 2000 mil-
lion Internet connections all over the world. Until re-
cently, these networks essentially acted as ”commu-
nication” networks for voice or text (e-mail), but this
is rapidly changing.
”Location-based services”, that is, applications that
require the user’s current location to provide ser-
vices are also becoming increasingly popular. In fact,
some studies (Vaughan-Nichols, 2009) indicate that
in 2012, a percentage of 20% of the mobile services
will depend on the user’s location.
Nevertheless, how to get the people’s location?
Currently, the most common way is to use the mo-
bile telephone network itself, where the position and
power level from several antennas are known and,
by triangulation, it is possible to calculate the ap-
proximate location of the mobile device. The er-
ror is between 100 and 1000 meters, depending on
the distance among the antennas and the environment
(Nurmi et al., 2010). Recently, most mobile phones
incorporate a Global Positioning System (GPS) re-
ceiver. Appart from this, the scientific community has
started to publish location algorithms that mix data
from telephone antennas and satellites. Through such
enhancements, the mean error can be reduced to 50
meters (Fritsche and Klein, 2009).
Just as there is a growing trend towards ser-
vices for outdoor location, there is also an increas-
ing trend for indoor location services. These are cur-
rently poorly developed, among other reasons, be-
cause Global System for Mobile Communications
(GSM) and GPS tracking do not work indoors. There-
fore, new technical alternatives are required. The two
solutions most deployed are radiofrequency identifi-
cation tags (RFID tags) and wireless transceivers.
In our group, we are interested in developing sys-
tems for monitoring elderly people at home. In partic-
ular, an important task would be the development of a
system capable of detecting not only alarm conditions
(falls or warnings from the user), but also anoma-
lous behavior or cognitive impairments by continu-
ously monitor the person at home. In order to do so,
we address this issue in two ways: tracking with in-
telligent video analysis (G
´
omez-Conde et al., 2011)
and localization via Bluetooth (Orozco-Ochoa et al.,
2011). In the current paper, we present an algorithm
which seeks to locate the ”zone” where the user is.
2 STATE OF THE ART
As it has been previously metioned, indoor localiza-
tion is not yet very extended. However, extense re-
search literature can be found. In particular, two re-
view refences can be cited: Liu (Liu et al., 2007), and
338
Orozco-Ochoa S., A. Vila-Sobrino X., Gómez-Conde I. and J. Lado M..
AN INDOOR LOCALIZATION ALGORITHM BASED IN WEIBULL DISTRIBUTION AND BAYESIAN CLASSIFIER.
DOI: 10.5220/0003742203380341
In Proceedings of the International Conference on Bio-inspired Systems and Signal Processing (BIOSIGNALS-2012), pages 338-341
ISBN: 978-989-8425-89-8
Copyright
c
2012 SCITEPRESS (Science and Technology Publications, Lda.)

Gu (Gu et al., 2009). There are other works that em-
ploy the Bluetooth’s RSS (Received Signal Strength)
parameter, and offer experimental data, as well as the
mean error. Some of these works will be now de-
scribed in chronological order.
Forno (Forno et al., 2005) used inquiries with dif-
ferent trasmission power. They experimented in un-
obstructed areas, without indoor walls. Hossain (Hos-
sain et al., 2007) presented a novel method, based on
calculating differences among RSS values. The ex-
perimental values (a mean error of 3.5 m) were again
obtained in a free-of-walls area. In a recent paper,
Aparicio (Aparicio et al., 2008) reached a mean er-
ror of 2.21 meters, employing a hybrid method, based
on wireless LAN and Bluetooth, and a 4-NN classi-
fier. In this work, the experimental area was a com-
plex zone, including walls, rooms and corridors. In
2010, Pei (Pei et al., 2010) obtained a mean error of
5.1 meters by applying a Weibull distribution to the
RSS dataset, and using a Bayesian classifier; however,
it must be taken into consideration that they only em-
ployed 3 access points for a quite extense area. In
fact, the methodology employed in this paper is based
in Pei’s work.
3 METHODOLOGY
3.1 Algorithm
The algorithm proposed in this paper belongs to
the category of the so-called fingerprinting methods
based on the RSS parameter. It has a training phase
in which a set of ”inquiries” are performed at known
positions. The Bluetooth inquiry mechanism consists
of an inquirer that broadcasts inquiry packets to de-
vices in the neighborhood. A radio map is built with
all RSS values from the different Base Stations (BS)
that respond to the inquiry. Then, the radiomap is pro-
cessed in order to obtain a new feature map, where
each zone is identified with a particular feature vec-
tor. In the localization stage, data from inquiries in
an unknown area are processed for feature extraction
from the RSS values. Such features will be compared
with the feature map to determine which is the area
that best matches and then, infere the target location.
Training Stage
We will call the set of training data tr, and the valida-
tion or test set te. We also assume that the set of RSS
values taken in the training stage is collected in an ar-
ray, called Original Radio Map (ORM), where ORM
[i, j] would be a variable length vector containing all
RSSs surveyed at zone i from BS
j
.
Many obstacles in indoor spaces can either pre-
vent or hinder the propagation of waves, as well as
introduce wave reflection that cause a noisy signal
from reflected waves. These characteristics of in-
door spaces explain why indoor wave propagation is
much more complex than outdoor wave propagation
(Figueiras et al., 2005). In an attempt to mitigate pos-
sible side effects of these reflections, we have decided
to filter the ORM by removing the lowest values. The
resulting Filtered Radio Map (FRM) was built as fol-
lows:
FRM[i, j] =
{
ORM[i, j][l]|
ORM[i, j][l] >= Q
1
(ORM[i, j])
(1)
being Q
1
(x) the first quartile of vector x.
For feature extraction we assume that each vector of
RSS values, i.e. each FRM[i,j] can be modeled by a
probability distribution function and therefore, sum-
marize its features by the parameters of the distribu-
tion. In our case we use a Weibull distribution func-
tion for the modeling since this distribution models
this type of radio wave propagation better than the
normal distribution function (Pei et al., 2010). The
Weibull distribution has two parameters, scale (λ) and
shape (k), and is given by the following expression:
g(x;k, λ) =
k
λ
(
x
λ
)
k−1
e
−(
x
λ
)
k
(2)
After this step we have a new array, the Weibull Ra-
dio Map (WRM), in which WRM[i,j] contains the k
and λ parameters of the Weibull probability distribu-
tion function that best models the set of values from
??FRM[i,j], i.e: W RM[i, j] = (k
i j
, λ
i j
). This matrix
has the features that model our radio map and that
will be used in the localization process.
Localization Stage
For the localization of the mobile device after the
training stage, we use data from an inquiry launched
from the mobile device. To begin with, the data col-
lection is preprocessed just as in training stage, i.e.:
• All RSS values are stored ??in a vector, denoted
te, where te[ j] is the set of values ??measured
from the BS j.
• Elimination of the lowest RSS values in order to
have the filtered test set (tef ).
Following is the classification step, which is based on
Bayesian inference:
• First, an RSS value is selected at random from
each vector tef [j], i.e. tef [ j][l
j
].
• RSSs are assumed to have a Weibull distribution;
AN INDOOR LOCALIZATION ALGORITHM BASED IN WEIBULL DISTRIBUTION AND BAYESIAN
CLASSIFIER
339
therefore, in order to get the probability value of
the tef [ j][l
j
], given a zone (z
i
), we perform:
P(te f [ j][l
j
] | z
i
) = g(te f [ j][l
j
]; k
z
i
, λ
z
i
) (3)
• The joint probability for tef is calculated as:
P(te f | z
i
) =
N
BS
∏
j=1
P(te f [ j][l
j
] | z
i
) (4)
where N
BS
is the number of base stations.
• The highest probability value obtained determines
the z
i
target zone.
The last step is the voting process, which is the repe-
tition of the above steps t times. As a result, a number
t of target zones are obtained, and the one with the
highest number votes is selected as the definite target
zone.
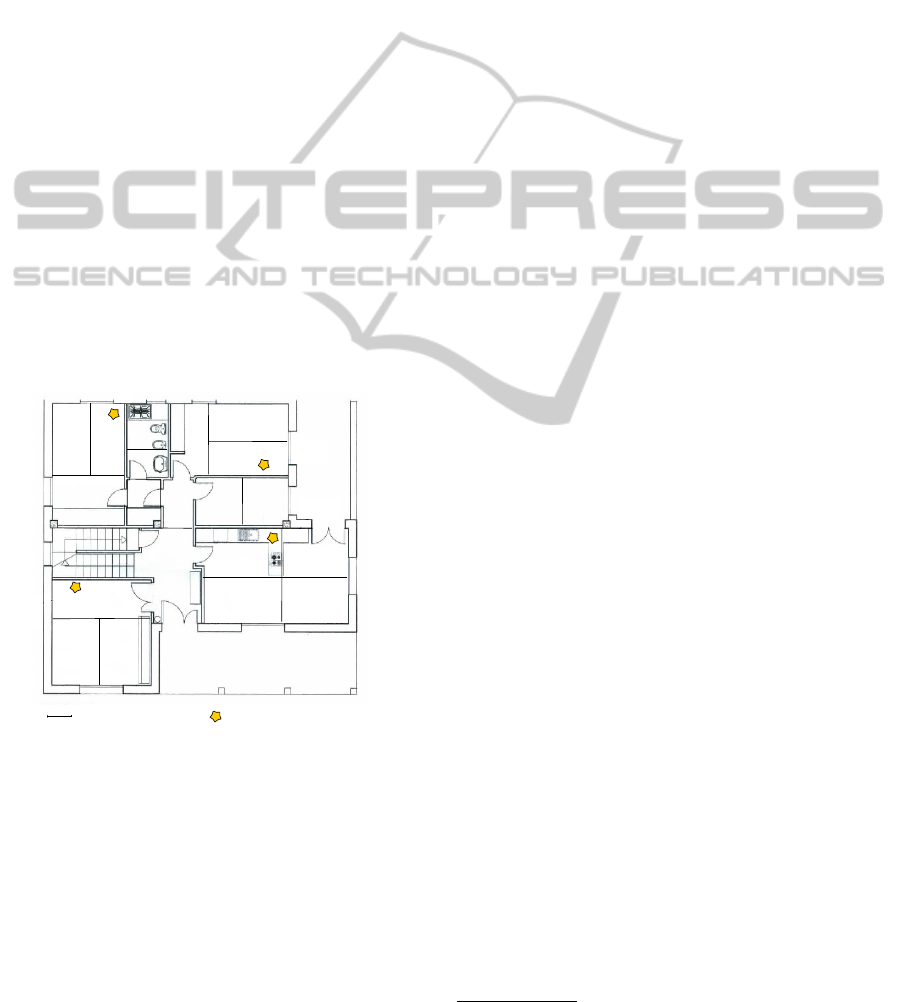
3.2 Experimental Setup
The experimental testbed is located in a private house.
Its dimensions are 13 × 12 meters, and it includes
rooms and corridors. Each room is divided in zones
of approximately 6 square meters. There are 20 zones,
denoted by z
i
, and labelled as shown in Figure 1.
n1
n2
n3
b1
b2
b3
d1
d3
l1 l2
p1
p2
c1
c2
c3
c4
s2
s3
bs4
bs1
bs3
bs2
d2
s1
Bluetooth base station
1 m
Figure 1: Map of the experimental area.
We placed 4 fixed Bluetooth transceivers attached
to personal computers, they are the Base Stations
(BS), denoted by bs
i
. All BSs are running Windows
XP except for bs
2
which runs on Unbuntu 10.04.
For data acquisition, an Acer Aspire 1 laptop with
a plugged Bluetooth 2.0 EDR receiver was used. The
laptop was in Bluetooth ”inquiry mode”, transmitting
a discovery packet every 11 seconds, while BSs are
set to ”discoverable” responding to these packets with
their identification (MAC Address) and RSS informa-
tion. To obtain the RSS information from the Linux
Bluetooth protocol stack (BlueZ 4.60), a python pro-
gram was executed in the laptop. In order to build
the radio map, 60 inquiries per zone were launched.
The total time for surveying each zone was around 10
minutes. The number of inquiries required to survey
the area of interest was 1200.
The R
1
statistical software package was used for
the calculations. All RSS values obtained (65010)
were stored in a 20 × 4 matrix, the ORM, kept in
the R environment. The tr data set was the base for
the ORM, we will explain later how these tr and te
sets were obtained from the 1200 inquiries. From
the ORM map the FRM was obtained. The FRM
was modeled by the Weibull distribution, by using the
Surv and survreg functions of the R survival package,
that provides methods for survival analysis. Based on
those functions we calculated the parameters λ, k that
define a Weibull distribution for each vector FRM[i,j].
Validation
We decided to develop a 4-cross validation model. In
order to do this task, the data set was divided into:
3/4ths of the data for the tr set and the remaining 1/4th
for the te set. This was done 4 times changing the
1/4th te part.
Since our goal is to identify the zone based in a
single inquiry (which takes about 11 s), the whole te
set was not used, only data corresponding to a ran-
domly selected inquiry.
From the filtered te set, the tef is got. Then the
classification is done and the whole process was re-
peated 20 times. A final voting was done in to order
obtain the predicted zone. Again, the whole process
was repeated 4 times (classification and voting).
4 RESULTS AND DISCUSSION
A summary of results is shown in Table 1. The second
column has the correct classification per cross valida-
tion, the 3rd column gives the correct classification in
terms of room (all zones belonging to the same room),
the last column is the mean error in terms of distance.
The last row has the columns’ mean values.
We can see that errors are in very specific areas.
Most of them are in c1 and n2, which are both close to
a BS. Our hypothesis is that in the areas nearby a BS,
the signal is so strong that many waves are reflected.
These waves were received by the mobile device and
they were not removed by the threshold.
The average percentage of correct classification
1
The R Official page, http://cran.r-project.org/
BIOSIGNALS 2012 - International Conference on Bio-inspired Systems and Signal Processing
340

Table 1: Summary of the 4-cross validation.
Cross Hits Room level Mean error
validation (%) (%) (m)
1st 88.75 92.50 0.77
2nd 86.25 100.00 0.79
3rd 97.50 100.00 0.71
4th 95.00 95.00 0.73
Mean 91.875 96.875 0.75
Table 2: Number of misclassifications by zone.
Cross- Cross- Cross- Cross-
Zone valid. 1 valid. 2 valid. 3 valid. 4 Total
c1 3 4 2 - 9
c3 - 1 - - 1
l1 2 - - - 2
n2 4 4 - 4 12
s1 - 2 - - 2
is 91.875% for the 4-cross validations, as shown in
Table 1.
Following the method for the mean error calcula-
tion developed by us in previous work (Orozco-Ochoa
et al., 2011) and based on the results from Table 2, an
average error of 0.75 meter was obtained. The mean
error is below other researchers’ mean error, which is
also around 2 meters, as has been shown in section 2.
5 CONCLUSIONS AND FUTURE
WORK
This paper describes an algorithm suitable for indoor
location based on a Bayesian classifier and Weibull
distribution. The results are very promising, better
than those of the literature.
This method would allow the monitoring of el-
derly people at home, not only the room where the
person is at each moment, but also the area within the
room where the person is. In this way, we can try
to identify the actions he is performing (sitting on the
couch, standing by the window, etc). We plan to study
the problem detected in areas close to a BS. A possi-
ble fix may be changing the type of filter used for re-
moving the reflected waves. Eventually, we will work
on the integration of our algorithm with multisenso-
rial and intelligent monitoring system: a system that
includes the use of video cameras and other sensors.
ACKNOWLEDGEMENTS
This work was supported by the Xunta de Galicia un-
der grant 08SIN002206PR.
REFERENCES
Aparicio, S., P
´
erez, J., Tarr
´
ıo, P., Bernardos, A., and Casar,
J. (2008). An indoor location method based on a fu-
sion map using bluetooth and wlan technologies. Int.
Symp. on Distributed Computing and Artificial Intel-
ligence (DCAI), 50:702–710.
Figueiras, J., Schwefel, H.-P., and Kovacs, I. (2005). Accu-
racy and timing aspects of location information based
on signal-strength measurements in bluetooth. IEEE
16th Int. Symp. on Personal, Indoor and Mobile Radio
Communications (PIMRC, 4:2685–2690.
Forno, F., Malnati, G., and Portelli, G. (2005). Design and
implementation of a bluetooth ad hoc network for in-
door positioning. IEE Proc. Software, 152(5):223–
228.
Fritsche, C. and Klein, A. (2009). On the performance of
hybrid gps/gsm mobile terminal tracking. IEEE Int.
Conf. on Comm. Workshops (ICC Workshops), pages
1–5.
G
´
omez-Conde, I., Olivieri-Cecchi, D., Vila-Sobrino, X.,
and Orosa-Rodr
´
ıguez, A. (2011). Intelligent video
monitoring for anomalous event detection. 2nd Int.
Symp. on Ambient Intelligence (ISAmI), 92:101–108.
Gu, Y., Lo, A., and Niemegeers, I. (2009). A survey of
indoor positioning systems for wireless personal net-
works. IEEE Comm. Surveys Tutorials, 11(1):13–32.
Hossain, A. M., Van, H. N., Jin, Y., and Soh, W. (2007).
Indoor localization using multiple wireless technolo-
gies. IEEE Int. Conf. on Mobile Adhoc and Sensor
Systems, pages 1–8.
Liu, H., Darabi, H., Banerjee, P., and Liu, J. (2007).
Survey of wireless indoor positioning techniques
and systems. IEEE Transactions on Systems, Man
and Cybernetics, Part C (Applications and Reviews),
37(6):1067–1080.
Nurmi, P., Bhattacharya, S., and Kukkonen, J. (2010). A
grid-based algorithm for on-device gsm positioning.
Proc. of the 12th ACM Int. Conf. on Ubiquitous Com-
puting, pages 227–236.
Orozco-Ochoa, S., Vila-Sobrino, X., Rodr
´
ıguez-Dami
´
an,
M., and Rodr
´
ıguez-Li
˜
nares, L. (2011). Bluetooth-
based system for tracking people localization at home.
Int. Symp. on Distributed Computing and Artificial In-
telligence (DCAI), 91:345–352.
Pei, L., Chen, R., Liu, J., Tenhunen, T., Kuusniemi, H., and
Chen, Y. (2010). An inquiry-based bluetooth indoor
positioning approach for the finnish pavilion at shang-
hai world expo 2010. Proc. of IEEE/ION PLANS,
pages 1002–1009.
Vaughan-Nichols, S. (2009). Will mobile computing’s
future be location, location, location? Computer,
42(2):14–17.
AN INDOOR LOCALIZATION ALGORITHM BASED IN WEIBULL DISTRIBUTION AND BAYESIAN
CLASSIFIER
341
