
A SYMBOLIC APPROACH FOR CLASSIFICATION OF MOVING
VEHICLES IN TRAFFIC VIDEOS
D. S. Guru, Elham Dallalzadeh and S. Manjunath
Department of Studies in Computer Science, University of Mysore, Manasagangothri, Mysore - 570 006, Karnataka, India
Keywords: Corner-based tracking, Shape reconstruction, Shape normalization, Shape feature extraction, Interval-valued
feature vector, Symbolic representation, Symbolic similarity measure, Vehicle classification.
Abstract: In this paper, a symbolic approach is proposed to classify moving vehicles in traffic videos. A corner-based
tracking method is presented to track and detect moving vehicles. We propose to overlap the boundary
curves of each vehicle while tracking it in sequence of frames to reconstruct a complete boundary shape of
the vehicle. The reconstructed boundary shape is normalized and then a set of efficient shape features are
extracted. The extracted shape features are used to form interval-valued feature vector representation of
vehicles. Vehicles are categorized into 4 different types of vehicle classes using a symbolic similarity
measure. To corroborate the efficacy of the proposed method, experiment is conducted on 21,239 frames of
roadway traffic videos taken in an uncontrolled environment during day time. The proposed method has
95.16% classification accuracy. Moreover, experiments reveal that the proposed method can be well
adopted for on-line classification of moving vehicles as it is based on a simple matching scheme.
1 INTRODUCTION
Vision-based traffic video monitoring systems have
made the cost of traffic monitoring reduced with
increased quality. In addition to vehicle counts, a set
of traffic parameters such as vehicle labels, lane
changes, illegal U-turns, posture, speed and moving
direction can be measured. Vehicle classification is
one of the other key tasks in any vision-based traffic
monitoring system. Important data about vehicle
classes that use a particular street or highway can be
obtained.
Detection and tracking of vehicles are the
preliminary steps in the task of vision-based traffic
video monitoring (Maurin et al., 2002; Dallalzadeh
et al., 2011; Ottlik and Nagel, 2008; Ticiano et al.,
2008; Maurin et al., 2005; Techmer, 2001). Besides,
in literature we can find a number of works on
classification of vehicles in traffic videos. In (Buch
et al., 2009), they utilized a combined detector and
classifier based on 3D wire frame models to locate
ground plane positions of vehicles. They generate
motion silhouettes for an input video frame. The
motion silhouettes are then applied to generate
vehicle hypotheses. The classifier matches 3D wire
frame models with the motion silhouettes. A
parameterized model was proposed to describe
vehicles by (Wu et al., 2001). The topological
structures of vehicles are extracted as the key
features. However, extracting the topological
structures of vehicles requires high quality of frames
that is not always achievable in a real traffic
monitoring system. Hsieh et al. (2006) proposed a
classification method which has a good capability to
categorize cars into more specific classes with a new
“linearity” feature extraction method. A maximum
likelihood estimation based classifier is then
designed to classify vehicles. Vehicle classification
based on Eigenvehicle and PCA-SVM was proposed
by (Zhang et al., 2006). After generating
Eigenvehicle vectors for all the training samples, the
Euclidian distance between the weight vectors of the
testing sample with respect to all the weight vectors
of vehicles in the training set is calculated. If the
mean distance exceeds some threshold value, it is
decided that the testing sample does not belong to
that class. In their second proposed method, features
are extracted using the (x, y) coordinates of vehicles
as well as the intensity values of the coordinates.
With each point represented by a 3-dimensional
vector, the point cloud is subject to Principle
Component Analysis. They apply One-Class
Support Vector Machine to classify vehicles into
three categories of vehicles. Chen and Zhang (2007)
351
S. Guru D., Dallalzadeh E. and Manjunath S. (2012).
A SYMBOLIC APPROACH FOR CLASSIFICATION OF MOVING VEHICLES IN TRAFFIC VIDEOS.
In Proceedings of the 1st International Conference on Pattern Recognition Applications and Methods, pages 351-356
DOI: 10.5220/0003754103510356
Copyright
c
SciTePress

proposed an ICA based vehicle classification
platform. For that, an ICA based algorithm is
implemented to identify the features of each vehicle
type. One-Class Support Vector Machine is then
used for classification of vehicles.
Classification of vehicles in traffic videos
imposes challenge due to their high intra class
variations. Many types of vehicles belonging to the
same class have various size and shape features.
Transformation of vehicles, occlusion, shadow,
illumination, scale, pose and position of a camera in
a scene make the shape of vehicles to be changed
while moving. In addition, stereo cameras are rarely
used for traffic monitoring (Gupte et al., 2002).
Hence, it would become more complex to recover
vehicle parameters such as length, width and height
from a single view camera. However, the inherent
complexity of stereo algorithms makes them
impractical in real-time applications. Besides,
vehicle classification methods are suffering from
high computational time if the extracted features are
based on 3D modelling of vehicles or in
dimensionality reduction of the extracted vehicle
features. In addition, the classification methods that
are based on template matching of vehicles involve
the detailed geometric of various types of traffic
vehicles which is impractical to use in real-time
traffic videos. Moreover, many different types of
vehicles have similar features which make the
classification approaches to classify them into only
two simple categories of cars and non-cars.
On the other hand, in this brief survey on vehicle
classification, we understand that almost all works
rely on classifying vehicles by thresholding or
likelihood estimation or using a well-known
classifier that cannot be well applied for on-line
classification of moving vehicles in traffic videos.
Hence, the above mentioned issues motivated us to
propose a simple and novel approach for
classification of moving vehicles based on symbolic
representation. To the best of our knowledge, no
work has been reported in the literature which uses
symbolic approach to represent the features of
moving vehicles. The recent developments in the
area of symbolic data analysis have proven that the
real-life objects can be better described by the use of
symbolic representation that is the extensions of
classical crisp data (Gowda and Diay, 1991).
Recently, a symbolic representation model for 2D
shapes has been proposed in (Guru and
Nagendraswamy, 2007). By the use of the proposed
representation, it is also shown that symbolic
representation effectively captures shape
information which outperforms conventional
representation techniques.
The rest of the paper is structured as follows.
The proposed method for classification of traffic
vehicles based on symbolic representation is
presented in section 2. In section 3, the details of the
classification experimentations along with results are
summarized. Finally, section 4 follows with
conclusions.
2 PROPOSED MODEL
This paper presents a symbolic-based traffic
surveillance system to classify detected moving
vehicles in a video captured by a stationary camera.
Moving vehicles are tracked and detected using the
proposed refined version of corner-based tracking
approach proposed in (Dallalzadeh et al., 2011). The
complete boundary shape of every detected vehicle
is reconstructed, normalized and then a set of shape
features are extracted. To capture intra-class
variations across vehicles of a same class, the
symbolic interval-valued feature vector
representation is formulated to represent each class
by feature assimilation. Vehicles are then classified
into 4 different categories, 1- motorcycles and
bicycles, 2- cars, 3- heavy vehicles (minibus, bus
and truck) and 4- any other (complement class), by
computing the symbolic similarity measure proposed
in (Guru and Prakash, 2009).
2.1 Corner-Based Tracking
We use the approach proposed in (Dallalzadeh et al.,
2011) to segment, track and detect moving vehicles
in traffic videos. The authors in (Dallalzadeh et al.,
2011) have also proposed to track occluded moving
vehicles individually. However, we develop the
proposed tracking approach to track occluded and as
well split moving vehicles separately using SIFT
features. The SIFT features of vehicles considered as
occluded or split vehicles as explained in
(Dallalzadeh et al., 2011) are extracted. If the
variation computed among the extracted SIFT
features are higher than a threshold value, the
vehicles are identified as occluded or split vehicles.
Figure 1 illustrates the refined version of corner-
based tracking approach (Dallalzadeh et al., 2011) to
track moving vehicles in a traffic video. Vehicles are
tracked from the time of their appearance to the time
of their disappearance in the scene as shown in
Figure 1(c). Further, Vehicles with significant
movement during their tracking are detected as
moving vehicles.
ICPRAM 2012 - International Conference on Pattern Recognition Applications and Methods
352
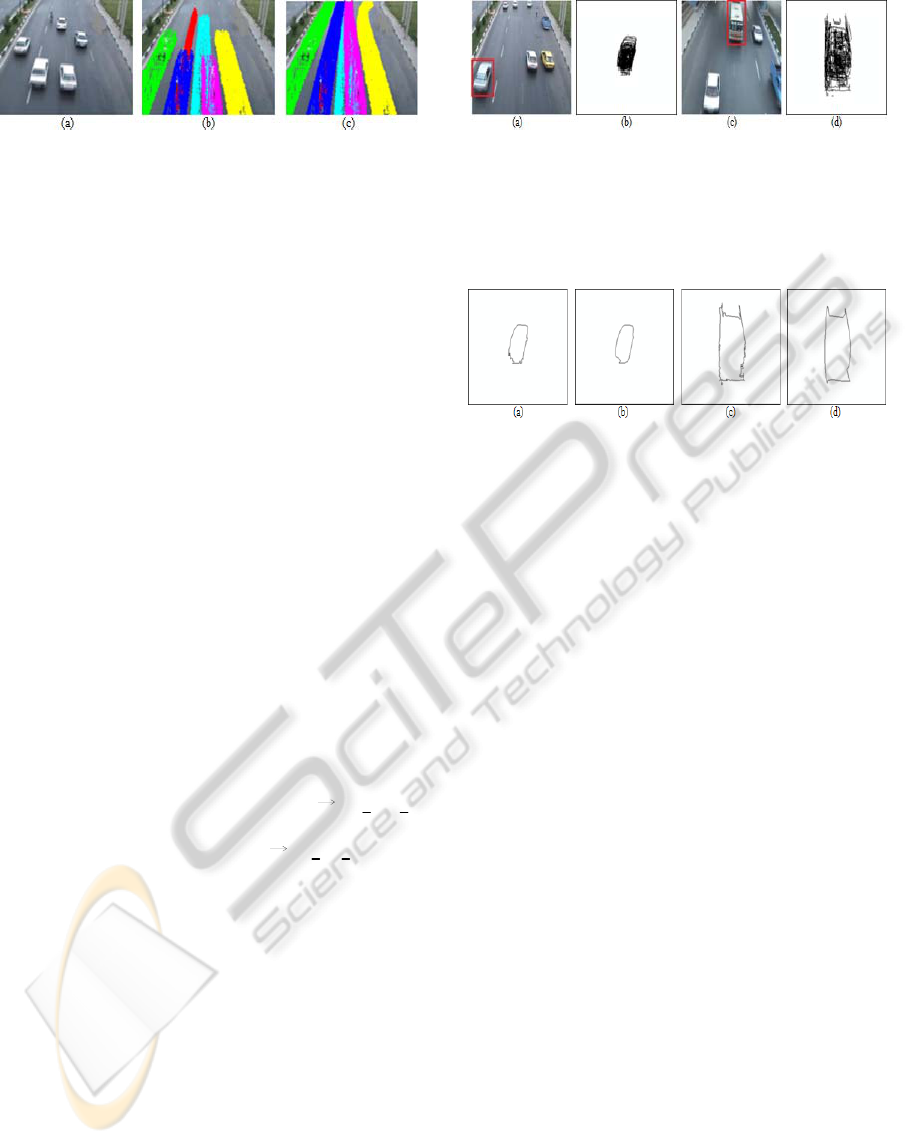
Figure 1: (a) Main frame. (b) Tracked vehicles in a shot.
(c) Vehicles are tracked from the time of appearance to the
time of disappearance in the scene.
2.2 Feature Extraction
In this subsection, we outline the proposed approach
to extract the shape features of a detected moving
vehicle in order to classify the vehicle. First, we
propose to reconstruct a complete boundary shape of
a vehicle during the period of its tracking. The
reconstructed boundary shape of the vehicle is then
normalized to have the same number of data points.
Details are explained in section 2.2.1. The shape
features of the normalized boundary shape are
extracted as given in section 2.2.2.
2.2.1 Shape Reconstruction
To extract the shape features for a vehicle, we
propose to reconstruct the complete boundary shape
of a vehicle during the period of its tracking. We
propose to overlap all the boundaries of a vehicle
while it is tracking in sequence of frames from the
time of its appearance to the time of its
disappearance in the scene. Thus, for all the frames
where a vehicle is tracked, its closed boundary
curves are located in the center of a temporary
framework such that the centroid of the boundaries,
represented in terms of the vector V=(V
x
, V
y
),
coincides with the center of the coordinates of a
temporary framework, termed as C=(C
x
, C
y
). Figure
2 shows an example of the reconstructed boundary
curves of two different traffic vehicles. Before
extracting the shape features, the outline of the
reconstructed boundary shape is sampled to a fixed
number of points. The sampling process normalizes
the sizes of the boundary shapes, smoothes the
shapes as well as eliminates the small details along
the boundary shapes (Zhang and Lu, 2003). In this
paper, the boundary shape of a vehicle is normalized
using the equal arc-length sampling method (Zhang
and Lu, 2003) as it achieves the best equal space
effect. Figure 3 shows the normalized boundary
shapes of the vehicles as reconstructed in Figure 2.
Figure 2: (a) A sample car enclosed in a bounding box. (b)
The shifted boundary curves of the car to the center of a
framework during its tracking. (c) A sample bus
circumscribed by a bounding box. (d) The located
boundary curves of the bus to the center of a framework
while it is tracking.
Figure 3: (a)&(c) The reconstructed boundary shapes of
two different vehicles. (b)&(d) Boundary shapes
normalization.
2.2.2 Shape Feature Extraction
We propose to extract a set of shape features that are
applicable for symbolic data representation. In this
direction, the following shape features are extracted.
A number of basic features of a minimum
bounding box (MBB) circumscribing the normalized
boundary shape are obtained as follows.
Normalized Length: It is a length of the MBB. The
length is as well normalized via NL=L∕LF (where,
‘LF’ is the length of a framework).
Normalized Width: It is a width of the MBB. The
obtained width is also normalized with NW=W∕WF
(where, ‘WF’ is the width of a framework).
Length by Width Ratio: This ratio is calculated by
NL∕NW.
Width by Length Ratio: It is the computed ratio of
NW∕NL.
Area: The area of the MBB i.e., A=NL×NW.
Perimeter: The perimeter of the MBB viz., P=
(NL+NW)×2.
Further, the region properties of a vehicle are
computed in terms of Eccentricity, Solidity, Centroid
Size, Minimum Distance to Centroid and Maximum
Distance to Centroid.
Eccentricity: The eccentricity is the ratio of the
distance between the foci of the ellipse of a vehicle
and its major axis length.
Solidity: It is a scalar specifying the proportion of
the pixels in the convex hull that are also in the
region.
A SYMBOLIC APPROACH FOR CLASSIFICATION OF MOVING VEHICLES IN TRAFFIC VIDEOS
353

Centroid Size: An alternative characterization of the
size of a vehicle is defined as the square root of the
sum of the squared Euclidean distances between
each landmark point and the centroid of a boundary
(Costa and Cesar, 2001).
Maximum and Minimum Distance to Centroid:
Maximum distance from the centroid to the
boundary points as well as Minimum distance from
the centroid to the coordinates of the border (Costa
and Cesar, 2001).
2.3 Symbolic Representation
In representation of traffic vehicles, the sample
traffic vehicles of each category possess significant
variations and thus features extracted from such
samples too vary considerably. Therefore, we feel
that it would be more meaningful to capture these
variations in the form of interval-valued features and
provide an effective representation for vehicles.
With this backdrop, the extracted shape feature
values of each class of vehicles are represented by a
symbolic approach which is formulated to represent
each class by feature assimilation. To efficiently
represent the high variations existing among the
shape features of a traffic vehicle class, we propose
to represent the features in terms of min-max values.
To assimilate the features, let {S
1
, S
2
, S
3
, …, S
n
} be
a set of ‘n’ samples of a vehicle class say ‘C
j
’, j =1,
2, 3, …, Z (‘Z’ denotes the number of classes) and
let [f
1
, f
2
, f
3
, …, f
m
] be the set of ‘m’ features
characterizing each vehicle sample of the vehicle
class ‘C
j
’. Considering the k
th
feature of the feature
vector, ‘f
k
’; the minimum value of the k
th
feature
values belonging to all ‘n’ samples of the vehicle
class ‘C
j
’ is obtained as:
()
min = min f
jk k
(1)
Similarly, the maximum value of the k
th
feature
values belonging to all ‘n’ samples of the vehicle
class ‘C
j
’ is achieved by:
()
max = max f
jk k
(2)
Now, we recommend capturing intra-class
variations for each k
th
feature of the j
th
vehicle class
by the use of interval-valued feature [f
jk
-
, f
jk
+
], where
+
f=minandf=max
jk jk jk jk
−
(3)
Hence, each interval [f
jk
-
, f
jk
+
] representation
depends on the minimum and maximum values of
the respective k
th
feature of the j
th
vehicle class. On
the other hand, the interval [f
jk
-
, f
jk
+
] represents the
lower and upper limits of the k
th
feature of the
corresponding vehicle class ‘C
j
’.
Consequently, the reference signature for the
vehicle class ‘C
j
’ is formed by representing each
feature in the form of an interval and is given by:
{
}
j
R = f ,f , f ,f ,..., f ,f
j1 j1 j2 j2 jm jm
−+ − + − +
⎡
⎤⎡ ⎤ ⎡ ⎤
⎣
⎦⎣ ⎦ ⎣ ⎦
(4)
It shall be noted that, unlike conventional feature
vector, ‘R
j
’ is a vector of interval-valued features.
Similarly, we compute symbolic feature vectors for
all of the vehicle classes (j = 1, 2, 3, …, Z). Thus,
‘Z’ numbers of symbolic vectors are created and
stored.
2.4 Vehicle Classification
The vehicle classification technique exploited in this
work is based on applying a symbolic similarity
measure proposed in (Guru and Prakash, 2009). Let
F
t
= [f
t1
, f
t2
, f
t3
, …, f
tm
] be the set of ‘m’ features
characterizing a test sample vehicle. Let ‘R
j
’ be the
interval-valued feature vector representation of the
class ‘C
j
’
as described in section 2.3. The similarity
value for the k
th
feature of ‘F
t
’ with respect to the k
th
interval-valued feature of ‘R
j
’ is calculated using
Equation 5. Subsequently, the total similarity value
for the test sample vehicle features, ‘F
t
’, with respect
to the interval-valued features ‘R
j
’ is calculated by
Equation 6.
Similarly, we compute the total similarity value
for the test sample vehicle features regarding the
interval-valued features of all the ‘Z’ classes. The
maximum total similarity value with respect to all
calculated total similarity values is selected as
shown in Equation 7. Ultimately to classify the test
sample vehicle, the label of the maximum total
similarity value is decided as the label for the test
sample.
+
1ifffandf<=f
tk jk tk jk
+
Sim f , f , f =
tk jk jk
11
max , otherwise
+
1+ f - f 1+ f - f
tk jk tk jk
−
>=
−
−
⎛⎞
⎡⎤
⎜⎟
⎢⎥
⎛⎞
⎣⎦
⎝⎠
⎜⎟
⎜⎟
⎜⎟
⎝⎠
(5)
()
m
+
Total_Sim F ,R = Sim f , f ,f
t j tk jk jk
k=1
−
∑
⎛⎞
⎡⎤
⎜⎟
⎢⎥
⎣⎦
⎝⎠
(6)
() ( ) ( )
{
}
max Total_Sim F ,R ,Total_Sim F ,R ,...,Total_Sim F ,R
t1 t2 tZ
(7)
3 EXPERIMENTATION
The traffic videos used in this experiment were
ICPRAM 2012 - International Conference on Pattern Recognition Applications and Methods
354
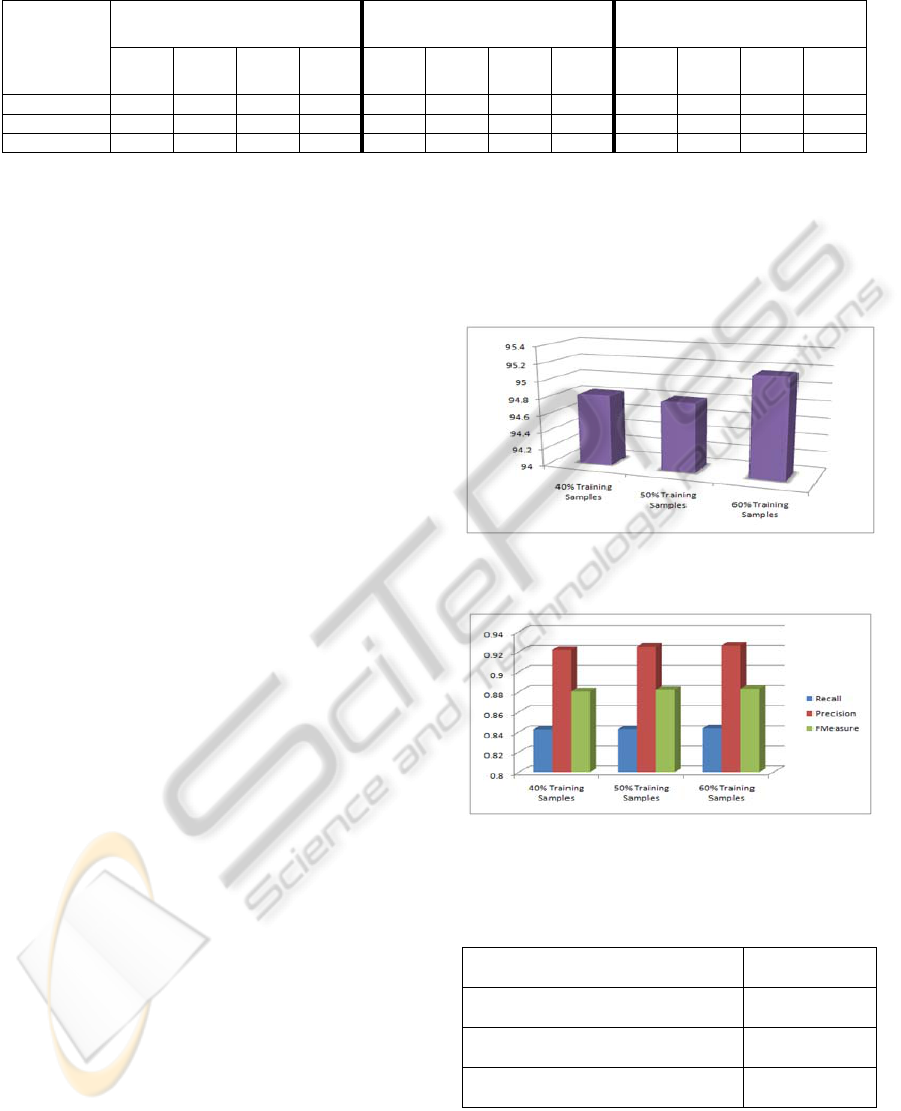
Table 2: Calculated Recall, Precision and FMeasure of the classified moving vehicles.
40% of the Traffic Video Samples
Total no. of Tested Vehicles=329
50% of the Traffic Video Samples
Total no. of Tested Vehicles=289
60% of the Traffic Video Samples
Total no. of Tested Vehicles=248
Class
1
Class
2
Class
3
Class
4
Class
1
Class
2
Class
3
Class
4
Class
1
Class
2
Class
3
Class
4
Recall
0.60 0.98 0.93 0.85 0.60 0.99 0.93 0.85 0.60 0.99 0.90 0.88
Precision
1.00 0.98 1.00 0.71 1.00 0.97 1.00 0.73 1.00 0.98 1.00 0.72
FMeasure
0.75 0.98 0.97 0.77 0.75 0.98 0.96 0.76 0.75 0.99 0.95 0.79
captured with a fixed digital camera in RGB colour
space mounted on a pole or other tall structure,
looking down on traffic scenes. The frame rate of
the videos is 25 frames per second with resolution of
320 × 240 pixels. In our system, the experiments are
conducted on 13 real traffic videos (21,239 traffic
video frames totalling about 14.16 minutes of inner
city video) having different complex background,
illumination, motion, position of a camera and
moving direction.
Extracted vehicles are tracked by the proposed
refined version of corner-based tracking approach
proposed in (Dallalzadeh et al., 2011) and vehicles
are detected as moving vehicles if the distance of
movement from the time of their appearance to the
time of their disappearance in the scene is
significant. However, some extracted false vehicles
are also detected as moving vehicles in our
experiment. In this paper, vehicles are classified into
4 categories: 1- motorcycles and bicycles, 2- cars, 3-
heavy vehicles (minibus, bus and truck) and 4- any
other (complement class).
From our experimentation, 56,517 vehicles have
been tracked in all the frames of the traffic video
samples which also include tracking the false
detected vehicles. Out of these tracked vehicles in all
the frames, 689 vehicles are reconstructed.
The reconstructed boundary shape of vehicles
are normalized by selecting ‘K’=30 as the total
number of the candidate points to be sampled along
the boundary shapes presented in (Zhang and Lu,
2003). The system is trained and evaluated in three
sets. In the first set, we consider the reconstructed
vehicles belonging to the 40% of the traffic video
samples used in this experiment. Similarly, we
consider the reconstructed vehicles belonging to the
50% and 60% of the traffic video samples as the
second and third sets respectively. The performance
evaluation of the proposed approach for
classification of the detected moving vehicles is
shown in Figure 4 and tabulated in Table 1 as well.
The highest classification accuracy achieved is
95.16%. The precision, recall and FMeasure are also
calculated. The results are given in Table 2 and the
average calculated precision, recall and FMeasure
are shown in Figure 5 respectively. By using the
proposed approach, we accomplish on an average of
84.37% recall, 92.62% precision and 88.30%
FMeasure after training the system by the
reconstructed vehicles belonging to the 60% of the
traffic video samples.
Figure 4: Classification accuracy of the proposed
Symbolic approach.
Figure 5: (a) Average Recall, Precision and FMeasure of
the classified moving vehicles.
Table 1: Tabulated values of Symbolic approach for
classification of moving vehicles.
Symbolic Approach
Classification
Accuracy
40% of the Traffic Video Samples
Total no. of Tested Vehicles=329
94.833
50% of the Traffic Video Samples
Total no. of Tested Vehicles=289
94.8097
60% of the Traffic Video Samples
Total no. of Tested Vehicles=248
95.1613
4 CONCLUSIONS
In this paper, we present a novel symbolic
A SYMBOLIC APPROACH FOR CLASSIFICATION OF MOVING VEHICLES IN TRAFFIC VIDEOS
355

representation approach for classification of moving
vehicles. We have made a successful attempt to
explore the applicability of symbolic data concepts
to classify the traffic vehicles. The newly presented
representation model has an ability to capture the
variations of the features among the training sample
vehicles. In the proposed method, we get a number
of feature vectors which is equivalent to the number
of vehicle categories. Our proposed approach is able
to deal with different types of deformations on the
shape of vehicles even in cases of change in size,
direction and viewpoint. Results show the robustness
and efficiency of our classification model.
REFERENCES
Buch, Norbert, Yin, Fei, Orwell, James, Makris,
Dimitrios, Velastin, Sergio A., 2009. Urban Vehicle
Tracking using a Combined 3D Model Detector and
Classifier. In 13th International Conference on
Knowledge-Based and Intelligent Information &
Engineering Systems, vol. 5711, pp. 169-176.
Chen, X., Zhang, Ch., 2007. Vehicle Classification from
Traffic Surveillance Videos at a Finer Granularity. In
13th International Multimedia Modeling Conference,
part I, pp. 772-781.
Costa, Luciano da Fontoura, Cesar, Roberto Marcondes,
2001. Shape Analysis and Classification, CRC Press
LLC, USA.
Dallalzadeh, Elham, Guru, D. S., Manjunath, S., Suraj, M.
G., 2011. Corner-Based Tracking of Moving Vehicles
in Traffic Videos. In 5th Indian International
Conference on Artificial Intelligence.
Gowda, K. C., Diday, E., 1991. Symbolic Clustering using
a New Dissimilarity Measure. Pattern Recognition,
vol. 24(6), pp. 567-578.
Gupte, S., Masoud, O., Martin, R. F. K., Papanikolopou-
los, N.P., 2002. Detection and Classification of
Vehicles. IEEE Transactions on Intelligent Transpor-
tation Systems, vol. 3(1), pp. 37-47.
Guru, D. S., Nagendraswamy, H. S., 2007. Symbolic Re-
presentation of Two-Dimensional Shapes. Pattern
Recognition Letters, vol. 28 (1), pp. 144-155.
Guru, D. S., Prakash, H. N., 2009. Online Signature
Verification and Recognition: An Approach Based on
Symbolic Representation. IEEE Transactions on
Pattern Analysis and Machine Intelligence, vol. 31(6),
pp. 1059-1073.
Hsieh, J. W., Yu, S. H., Chen, Y. S, Hu, W. F., 2006.
Automatic Traffic Surveillance System for Vehicle
Tracking and Classification. IEEE Transactions on
Intelligent Transportation Systems, vol. 7(2), pp. 175-
188.
Maurin, B., Masoud, O., Papanikolopoulos, N., 2002.
Monitoring Crowded Traffic Scenes. In 5th Interna-
tional Conference on Intelligent Transportation Sys-
tems, pp. 19-24.
Maurin, B., Masoud, O., Papanikolopoulos, N. P., 2005.
Tracking All Traffic: Computer Vision Algorithms for
Monitoring Vehicles, Individuals, and Crowds. In
Robotics and Automation Magazine, vol. 12(1), pp.
29-36.
Ottlik, A., Nagel, H.-H, 2008. Initialization of Model-
Based Vehicle Tracking in Video Sequences of Inner-
City Intersections. International Journal of Computer
Vision, vol. 80(2), pp. 211-225.
Techmer, A., 2001. Contour-Based Motion Estimation and
Object Tracking for Real-Time Applications. In
International Conference on Image Processing, pp.
648-651.
Ticiano, A. C. B., Gabriel, I. S. R., Victor, A. P. B,
Marcus, V. L., Daniel, A., George, L. T., Yaeko, Y.,
2008. A New Approach to Multiple Vehicle Tracking
in Intersections using Harris Corners and Adaptive
Background Subtraction. In Intelligent Vehicles
Symposium Eindhoven University of Technology
Eindhoven, pp. 548-553.
Wu, W., Zhang, Q., Wang, M., 2001. A Method of
Vehicle Classification using Models and Neural
Networks. In Vehicular Technology Conference
, vol.
4, pp. 3022-3026.
Zhang, Ch., Chen, X., Chen, W.-bang, 2006. A Pca-Based
Vehicle Classification Framework. In 22nd Interna-
tional Conference on Data Engineering Workshops,
pp. 17-26.
Zhang, D., Lu, G., 2003. A Comparative Study on Shape
Retrieval using Fourier Descriptors with Different
Shape Signatures. Journal of Visual Communication
and Image Representation, vol. 14 (1), pp. 41-60.
ICPRAM 2012 - International Conference on Pattern Recognition Applications and Methods
356
