
SMART METER
Artificial Neural Network for Disaggregation of Electrical Appliances
Dirk Benyoucef, Thomas Bier and Philipp Klein
Digital Communications & Signal Processing Lab, Furtwangen University,
Robert-Gerwig-Platz 1, 78120 Furtwangen, Germany
Keywords:
Smart meter, Artificial neural networks, Non intrusive appliance load monitoring.
Abstract:
Goal of that paper is to show a possibility for the disaggregation of electrical appliances in the load curve of
residential buildings. The advantage is that the measurement system is at a central point in the household. So
the installation effort decrease. For the disaggregation of the appliances out of the load curve, an approach for
the development of classification algorithms is presented. One method for the classification of appliances is to
use Artificial Neural Network. This idea is the main part of that paper. It is shown a method, to classify one
kind of appliances. At the end, the first relsults and the next steps are presented. The disaggregation of the
appliances is part of a research project at the University of Furtwangen.
1 INTRODUCTION
The world wide energy demand has risen during the
past years. As an example the consumption in the
European Union (EU) has increased by 10.8 % from
1999 through 2004 (Bertoldi and Atanasiu, 2006). In
contradiction to this development the amount of avail-
able resources is decreasing. This makes energy sav-
ing a necessity. One way to achieve this is to in-
fluence and change the behavior of the human pop-
ulation (Bertoldi and Atanasiu, 2006). To adapt the
users’ behavior to the new challenges of energy sav-
ing it is necessary to provide them with a transparent
report of their energy usage. This can be achieved by
installing so called smart meters. Therefore the in-
troduction of smart meters becomes more interesting.
The smart meters should allow for detailed informa-
tion on the consumption of each of the appliance in
a household. It is important that this information in-
cludes how much and when each appliance consumes
energy. This information could be presented in a de-
tailed energy bill at the end of each month. The com-
parison with other appliances of the same type could
reveal the out-dated equipment consuming too much
energy.
Another advantage is that smart meters are able
to measure real and reactive power in one-second in-
tervals. This information is crucial to electric supply
companies for determination of grid load, grid faults
and the power factor cos(ϕ) in a smart grid.
The new systems should be cost-effective. There-
fore it is desirable to use only one measuring device
at a central location in each house. The use of signal
processing (disaggregation algorithms) should reveal
information on active appliances. This approach is
known as Non-Intrusive Appliance Load Monitoring
(NALM) (Najmeddine et al., 2008).
2 STATE OF ART
The methods for disaggregating different appliances
from the power consumption can be divided into two
groups: the steady state analysis and the transient
state analysis. An overview of the different methods
is given in Fig. 1.
Non Intrusive
Appliance Load
Monitoring
NALM
Steady State
Analysis
Transient State
Analysis
Fundamental
Frequency Domain
Fundamental
Time Domain
Figure 1: State of Art NALM.
546
Benyoucef D., Bier T. and Klein P. (2012).
SMART METER - Artificial Neural Network for Disaggregation of Electrical Appliances.
In Proceedings of the 1st International Conference on Pattern Recognition Applications and Methods, pages 546-550
DOI: 10.5220/0003754505460550
Copyright
c
SciTePress

2.1 Steady State
The first NALM system was developed by George
Hart at the Massachusetts Institute of Technology
(MIT). In the 1980s, he wanted to analyze the load
of residential buildings (Hart, 1992). His system
recorded active and reactive power in intervals of one
second. This system reaches its limits, when there
are multiple switching edges of linear and non-linear
loads at the same time. Also different appliances
with similar or identical power consumption as well
as loads with quick switching cycles cannot be dis-
aggregated correctly. In 1998, Mr. Pihala built a sys-
tem in Finland based on Hart’s approach. This system
worked with one-phased and three-phased load (Pi-
hala, 1998). In 2000 and 2001, Murata et al. made an
classification of loads (Murata and Onoda, 2000)(Mu-
rata and Onoda, 2002). This classification based on
the steady state approach.
In 2006, a further system based on Hart’s ap-
proach was developed by Mr. Baranski (Baranski,
2006) for German households at the University of
Paderborn. All the systems described above, used a
data base in which information on the appliances was
stored. Obviously, this procedure demanded a great
deal of measuring effort before using the system.
2.2 Transient State
Many disadvantages of the steady state analysis can
be eliminated by analyzing the transients of the
switching events. When turning on or off a device,
characteristic oscillations in the voltage and current
signal may occur. The shape of those oscillations is
dependent on the inner structure and the operation
mode of the appliance. The distorted reactive power,
the product of the distorted voltage and the distorted
current, are mainly caused by non-linear loads, for
example, switching power supplies. In contrast, lin-
ear but non-real loads like motors consume reactive
power.
Lee established that the sum of the currents at
higher frequencies can reach up to 150% of the cur-
rent in the fundamental wave of the power grid (Lee
et al., 2003). Thus to determine the energy consump-
tion of a device, it is crucial to regard the higher fre-
quencies as well.
In 2000, Shaw investigated the transient state anal-
ysis in detail (Shaw, 2000). In 2003, Lee (Lee et al.,
2003) and Laughman (Laughman et al., 2003) used
the steady state analysis and the transient state anal-
ysis for disaggregating the real power of appliances.
For the transient state analysis, they assumed that the
voltage is ideally sinusoidal and that only the current
is distorted.
All of these methods use databases of individual
appliances. This has the disadvantage that all devices
must be included in the database during the installa-
tion of the system. A solution is to include charac-
teristics of classes of appliances in the database. Fur-
thermore all listed algorithms are specialized on the
detection of one group of appliances. A complete
system that detects all possible appliances in the load
curve of private homes and that tracks their energy
consumption does not exist. At this point it should be
recognized.
3 RESEARCH PROJECT
The research project ”SmartMetering” is divided into
four parts (Benyoucef et al., 2010b; Benyoucef et al.,
2010c; Benyoucef et al., 2010a). The first part is to
fill a data base with measurements of individual ap-
pliances. Currently there are 350 of those measure-
ments available. These measurements are used for
a qualitative analysis of the behavior of loads which
means that characteristic features of the loads are to
be extracted. The measurements are performed using
a measuring system for the three phases of the line in
a house. This system was developed in-house and it
provides information on the distribution of the con-
sumed power over the three phases.
In the second part modeling especially of the
switching on behavior of appliances is done. These
models are used for classification of load profiles.
The algorithms are verified using a test system
which is the third part of the project.
The major part is the development of disaggrega-
tion algorithms. In a first stage all switching events
(on and off) are detected. A suitable event detection
algorithm was developed for this purpose. The event
detection is followed the classification of the detected
turn-on events. After the classification a tracking al-
gorithms tracks the consumed power of all detected
appliances and finds the appropriate turn-off event.
The tracked power is used to compute the consumed
energy. This detection strategy is sketched in Fig. 2.
Event Detection
Algorithm
Classification
Algorithms
Tracking
Algorithms
Step 1 Step 3Step 2
Figure 2: Structure for the disaggregation.
The topic of the following chapters is the detection
of the switching on profile of appliances. Experience
SMART METER - Artificial Neural Network for Disaggregation of Electrical Appliances
547
shows that it is necessary to include multiple meth-
ods for a successful classification of all possible load
types. Therefore several algorithms, each one for the
detection of some of all possible classes, are under
development. The main focus is put on loads con-
suming most of the energy comprising refrigerators
and freezers (EU, 2009; NRW, 2006). The proposal
of this paper is based on the idea to detect groups
of loads showing periodic switching behavior by em-
ploying an artificial neural network (ANN).
4 APPROACH
Electrical appliances can be classified into several
groups by applying several criteria. One criterion is
the number of possible operation states. One the one
hand there are on-off-loads (electric kettles, refriger-
ators, ...) with two states and on the other hand there
are complex appliances like e.g. dish washers.
Another criterion is to consider the switching be-
havior of loads. There are loads which are directly
influenced by the user (manually controlled), like e.g.
televisions (volume and contrast adjustment, program
change). Another group is filled with autonomously
controlled machines like refrigerators, freezers, etc.
In this paper an approach for the disaggregation of
the group containing autonomously controlled on-off
appliances is described. The approach is described at
the example of refrigerators and freezers.
Fig. 3 shows an exemplary measurement of the
power profile of one phase of the grid in a house. It
can be seen that, after subtracting the power drawn
by stand-by appliances, only one machine is active in
the nighttime. This is the profile of a refrigerator. At
around 7.00 am additional loads were switched on by
the house owner. The idea is to train the ANN with
0 2 4 6 8 10 12 14
500
1000
1500
2000
2500
3000
3500
4000
4500
time [h]
|S| [VA]
Figure 3: Power profile of one phase in a house.
the operating cycles of the refrigerator in the night-
time. In the daytime the signatures of all loads are
classified. The ANN detects the match of a newly
classified signature with the trained signature. Then
this signature is assigned to the refrigerator.
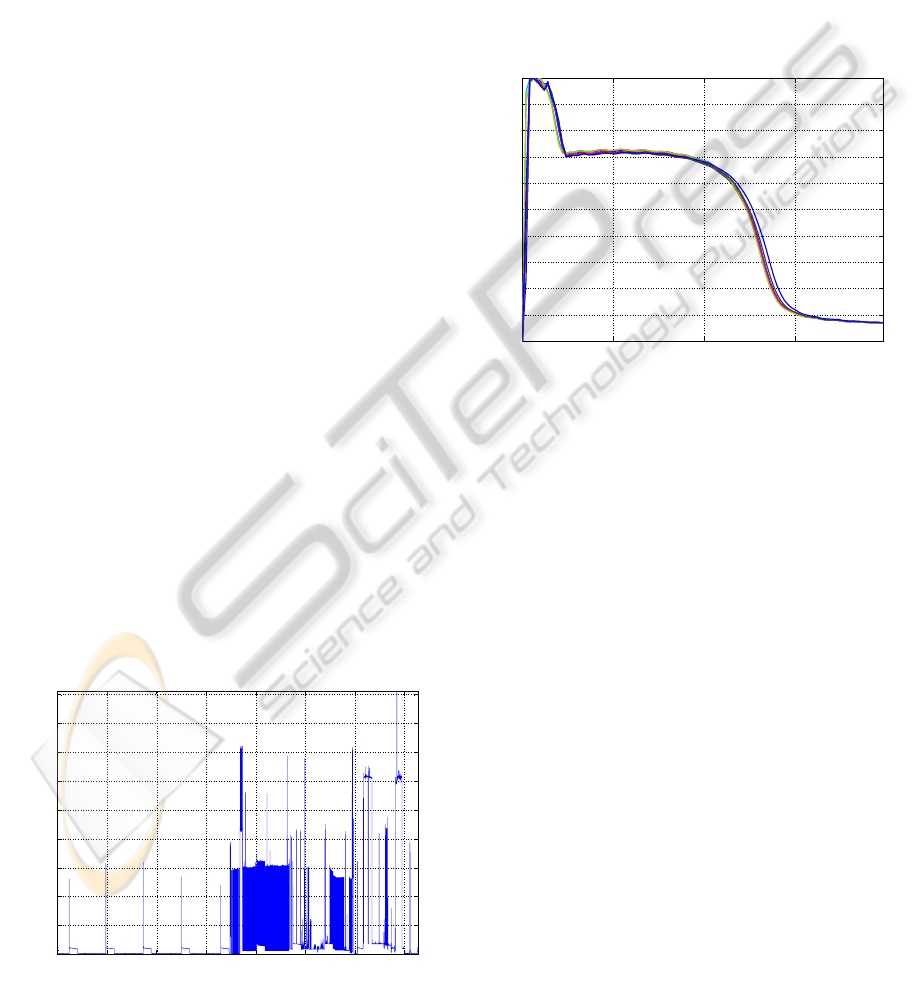
Fig. 4 shows the apparent power profile of
eight turn-on signatures of the refrigerator recorded
at night. The signatures show little variation and they
have a duration of about 1.5 s. The start signature of
the signature consists of a transient of about 250 ms.
The profile was normalized to the maximum of the
signature. As said in the beginning several algorithms
0 0.5 1 1.5
0
0.1
0.2
0.3
0.4
0.5
0.6
0.7
0.8
0.9
t [s]
|S|/|S
max
|
Figure 4: Switching on events of a refrigerator.
are required for detection of all equipment of a house-
hold. Especially for the periodically switching ma-
chines the ANN can be accompanied by the a priori
information on the duration of the operating cycles.
For the computation of these times the nighttime mea-
surement can be used as well. During the day the re-
sults of the ANN can be enhanced by the cycle times
to improve the detection accuracy, but for now only
the ANN is examined.
5 ARTIFICIAL NEURAL
NETWORKS
The basic structure of artificial neural networks is
similar to nerve cells, so called neurons.
5.1 Neurons
A simplified model of the structure of an artificial
neuron is shown in Fig. 5. On the right side the com-
pact form of the neuron is shown. The inputs of the
neurons are the values x
i
which is a vector of length
L + 1. These values may come from other neurons or
from sensors. The first value x
0
can be used to set
ICPRAM 2012 - International Conference on Pattern Recognition Applications and Methods
548

x
0
w
0j
x
1
w
1j
x
L
w
Lj
∑
z
j
f (·)
y
j
= f (z
j
)
x
N
y
j
Figure 5: Model of an artificial neuron and its compact
structure.
up the offset. The input values are weighted by the
weights w
i j
and afterwards added. The result z
j
is
mapped by a non-linear function f to the final result
y
j
. In the following the model is described in vector
notation. The input vector is described by
x =
x
0
x
1
··· x
L
T
. (1)
Analogously the weight vector is given by
w
j
=
w
0 j
, w
1 j
, ·· · , w
L j
T
. (2)
The final output is therefore given by
y
j
= f (z
j
) = f (x
T
w
j
). (3)
Equation (3) applying the non-linear image function
is known as the transfer function.
There are several types of artificial neural net-
works with various structures. The three basic types
are separated into the feed forward structure, the feed
back structure and the recurrent structure (Cichocki
and Unbehauen, 1993).
If several layers d of neurons are stacked the re-
sulting ANN is called a multilayer ANN. There are
three distinct layers, namely the input layer, the hid-
den layers and the output layer. Furthermore it is
possible to connect several neurons in parallel. This
makes a multiple outputs y
k
k = 0, ·· · , N in the output
layer possible. The d
th
input layer always depends on
the output layer d − 1.
5.2 Learning Algorithms
The individual weights of the neurons can be deter-
mined in many different ways. The simplest learning
algorithms are based on the method of least means
squares (LMS) (Haykin, 2002). It is for an ANN
consist of one neuron. The common principle of all
known methods is to minimize the error e in order to
determine the optimum weight vector w
opt
. The block
diagram for the computation of the error is shown in
Fig. 6. The first method used for the evaluation in
this paper is the gradient descent method. The opti-
mum is reached when the mean square error becomes
x
w
opt
d
−
e
y
t
Figure 6: Block diagram for the error claculation.
minimal. For a weight vector of length two this error
is given by (cf. Fig. 6)
e
2
= (y
t
)
2
− 2y
t
x
T
w + w
T
xx
T
w. (4)
Since the vectors x represent stochastic signals it
is useful to use the expectation of the mean square er-
ror. The optimum weight vector is computed by find-
ing the minimum of the derivative of equation (4). It
is given by
w
opt
= R
−1
p. (5)
This equation is known as the Wiener-Hopf Equation
with the autocorrelation matrix R = E
xx
T
of the
input signal x. p is the cross-correlation vector of the
desired value y
t
and the input signal x. A detailed
derivation of this principle is given in (Haykin, 2002).
Another approach would be an adaptive learning
method. Then the data for the training process of the
ANN could be the measured data during nighttime.
With that the time-variant behavior of switching cy-
cles of the refrigerator can be reacted.
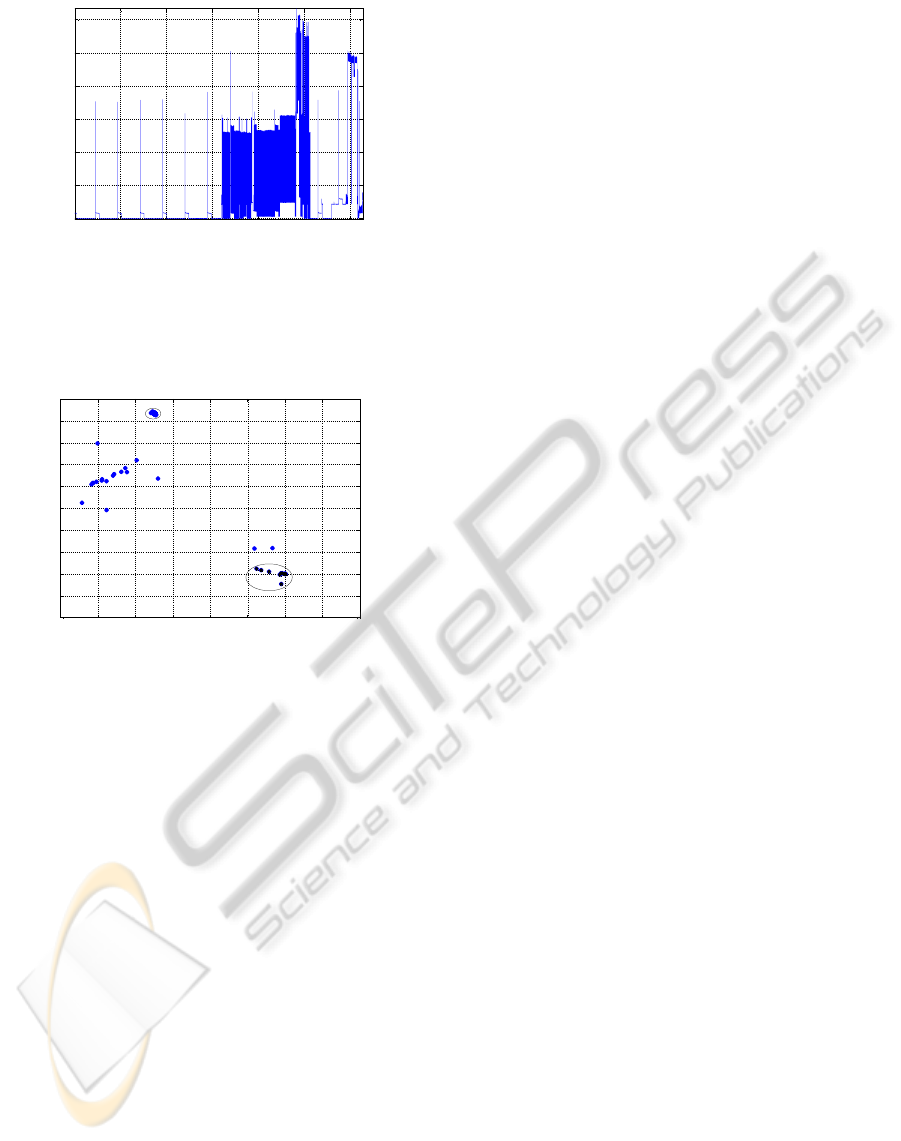
6 RESULTS
The first simulation results were obtained by using an
ANN with three layers. The learning method was the
gradient descent method. The input vector x had a
length of 80 values representing the first 80 values of
the apparent power measured after a detected switch-
ing on event (cf. Fig. 4). All layers used the same
activation function. This function is known as the
simple limiter transfer function. The measured data
for the simulation is shown in Fig. 7. This is a one
day long measurement of one phase of the power line
of a house. It commences at 0:00 am and it ends at
12:30 am. During the night the refrigerator showed
seven operation cycles. At 6:30 pm additional appli-
ances were turne on. The refrigerator went through
another seven cycles during the rest of the measure-
ment time which results in 14 operation cycles in to-
tal. The results of the classification achieved by the
ANN are shown in Fig. 8. The output vector is the
two-dimensional vector y =
y
1
y
2
T
with the com-
ponents shown on the axes of Fig. 8. All of the 14 op-
eration cycles of the refrigerator are clearly separated
SMART METER - Artificial Neural Network for Disaggregation of Electrical Appliances
549
0 2 4 6 8 10 12
0
500
1000
1500
2000
2500
3000
time [h]
|S| [VA]
Figure 7: Measurement for the analysis of the ANN.
from the other events. Additional clusters show up,
one of which representing the oven which was oper-
ated from 6:30 to 10:15. For our future work the ANN
-60 -50 -40 -30 -20 -10 0 10 20
-20
-10
0
10
20
30
40
50
60
70
80
y
1
y
2
Refrigerator
Oven
Figure 8: Outputs of the ANN.
is to be applied to additional measurements. This will
show if the ANN method is suitable for the classi-
fication of other equipment. An option for increas-
ing the classification accuracy and classification abil-
ity is to increase the dimension of the output vector y
from currently two to higher values. In order to use
the ANN method in time variant systems an adaptive
learning algorithm might be used.
7 CONCLUSIONS
This paper provides an overview of the state of the art
of the area of NALM. The research project with the
goal to find methods for the identification of individ-
ual appliances in the load profile of private apartments
and houses was presented. This project is divided
into four parts, one of which is to develop disaggre-
gation algorithms which was shown in more detail. A
method for the detection of periodically switching ap-
pliances was discussed. This method is based on arti-
ficial neural networks. The description of the method
was accompanied by first simulation results.
REFERENCES
Baranski, M. (2006). Energie-Monitoring im privaten
Haushalt. In Ph.D. Thesis, University of Paderborn.
Benyoucef, D., Bier, T., and Klein, P. (2010a). Plan-
ning of energy production and management of energy
resources with SmartMeters. In International Con-
ference on Advances in Energy Engineering (ICAEE
2010), pages 170–173, Beijing, China. IEEE.
Benyoucef, D., Klein, P., and Bier, T. (2010b). Smart Meter
with Non-Intrusive Load Monitoring for Use in Smart
Homes. In IEEE Energy 2010. IEEE.
Benyoucef, D., Klein, P., and Bier, T. (2010c). Smart me-
tering: Disaggregation von endverbrauchern. In VDE-
Kongress 2010. Smart Cities, Leipzig. VDE.
Bertoldi, P. and Atanasiu, B. (2006). Electricity consump-
tion and efficiency trends in the enlarged European
Union. In Status Report, Institute for Environment
and Sustainability. JRC European Commission.
Cichocki, A. and Unbehauen, R. (1993). Neural networks
for optimization and signal processing. Stuttgart :
Teubner, Chichester u.a.: Wiley, 1993.
EU (2009). Electricity Consumption and Efficiency Trends.
In JRCTechnicalReport. EU.
Hart, G. (1992). Non-intrusive Appliance Load Monitoring.
In JRC Technical Report, pages 1870–1891, Proceed-
ings of the IEEE. IEEE.
Haykin, S. (2002). Adaptive filter theory. Prentice-
Hall, Great Britain: Pearson Education International,
c2002.
Laughman, C., Lee, K., Cox, R., Shaw, S., Leeb, S., Nor-
ford, L., and Armstrong, P. (2003). Power signature
analysis. In Power and Energy Magazine, pages 56–
63. IEEE.
Lee, K., Norford, L., and Leeb, S. (2003). Development of
a functioning centrally located electrical-load monitor.
In Technical Report. MIT.
Murata, H. and Onoda, T. (2000). Applying support vector
machines and boosting to a non-intrusive monitoring
system for household electric appliances with invert-
ers.
Murata, H. and Onoda, T. (2002). Estimation of power
consumption for household electric appliances. In 9th
International Conference on Neural Information Pro-
cessing.
Najmeddine, H., Drissi, K. K., Pasquier, C., Faure, C., Ker-
roum, K., Diop, A., Jouannet, T., and Michou, M.
(2008). State of art on load monitoring methods. In
2nd IEEE International Conference on Power and En-
ergy (PECon 08), Johor Baharu, Malaysia.
NRW, E. (2006). Durchschnittliche stromkosten gemittelt
ber alle haushaltsgren. Presseinfo vom 06.04.2006.
Pihala, H. (1998). Non-intrusive appliance load monitoring
sytem based on modern kwh-meter. Technical report,
Technical Research Center of Finland.
Shaw, S. (2000). System identification and modeling for
nonintrusive load diagnostics. In Ph.D. Thesis. Mas-
sachusetts Institute of Technology.
ICPRAM 2012 - International Conference on Pattern Recognition Applications and Methods
550
