
SIMULATION OF BACTERIAL GENOME EVOLUTION UNDER
REPLICATIONAL MUTATIONAL PRESSURES
Paweł Bła
˙
zej, Paweł Mackiewicz and Stanisław Cebrat
Department of Genomics, Faculty of Biotechnology, University of Wrocław, ul. Przybyszewskiego 63/77, Wrocław, Poland
Keywords:
DNA asymmetry, Mutational pressure, Genome evolution, Monte Carlo simulation.
Abstract:
Directional mutational pressure associated with DNA replication is one of the most significant forces shaping
nucleotide composition and structure of bacterial chromosomes as well as influencing the evolution of their
genes. Here we introduced the model of bacterial genome evolution including two mutational pressures acting
in differently replicated DNA strands (called leading and lagging). The simulations were performed on the
population of protein coding genes from the Borrelia burgdorferi genome which shows a very strong compo-
sitional bias between the DNA strands. The simulated genomes were eliminated by selection because of: (i)
stop translation codon occurrence in their gene sequences and (ii) the loss of their coding signal which was
calculated according to the algorithm for recognition of protein coding sequences. This algorithm considers
three independent homogeneous Markov chains to describe transition between nucleotides separately for each
of three codon positions in a given DNA sequence. The negative selection for stop codons appeared much
stronger than the one based on the coding signal and led to elimination of more genomes from the population.
The genes were subjected both to the direct mutational pressure, characteristic of the strand on which they are
located and to the reverse pressure, characteristic of the opposite strand. Generally, the elimination of genomes
because of stop codons occurrence was the most frequent for the reverse pressure whereas the coding signal
selection eliminated the genome most often for the direct pressure. The leading strand mutational pressure
was more destructive for coding signal whereas the the lagging strand pressure generated more stop codons in
the gene sequences.
1 INTRODUCTION
A different mode of DNA strands’ replication makes
that one DNA strand named leading, is synthesized
continuously whereas the complementary one, i.e.
lagging strand is synthesized from Okazaki frag-
ments. In consequence, these strands are subjected to
different nucleotide substitution patterns (Frank and
Lobry, 1999); (Kowalczuk et al., 2001a); (Kowal-
czuk et al., 2001b); (Rocha and Danchin, 2001);
(Rocha et al., 2006). These various directional mu-
tational pressures lead to disparate nucleotide com-
position of the differently replicated strands, which
is very well pronounced in many bacterial genomes
and is called the DNA asymmetry (Lobry, 1996);
(Freeman et al., 1998); (Grigoriev, 1998); (McLean
et al., 1998); (Mrazek and Karlin, 1998); (Mack-
iewicz et al., 1999a); (Tillier and Collins, 2000a);
(Lobry and Sueoka, 2002). The asymmetry is de-
fined as a deviation from the equality between com-
plementary nucleotides in a single DNA strand, i.e.
[G]=[C] and [A]=[T]. The strongest asymmetry asso-
ciated with replication is observed in the nucleotide
composition in the third codon position of protein
coding sequences, which indicates mutational cause
of this bias (McLean et al., 1998); (Mackiewicz
et al., 1999a); (Tillier and Collins, 2000a); (Lobry
and Sueoka, 2002). The leading strand is usually rich
in guanine and thymine whereas the lagging strand
shows excess of cytosine and adenine. It is assumed
that the mutation C–>T, which is the most com-
mon substitution observed in the leading strand, is
the main factor responsible for this bias (Frank and
Lobry, 1999) although analysis of several bacterial
genomes revealed that similar compositional biases
may result from different mutational patterns (Rocha
et al., 2006). The effect of the mutational pressure
is to some extent accepted by selection because the
DNA asymmetry is also visible in the codon usage of
genes and amino acid composition of coded proteins
(McInerney, 1998); (Lafay et al., 1999); (Mackiewicz
et al., 1999b); (Rocha et al., 1999).
It was also found that the distribution of genes be-
tween the differently replicated strands is not random.
51
Bła
˙
zej P., Mackiewicz P. and Cebrat S..
SIMULATION OF BACTERIAL GENOME EVOLUTION UNDER REPLICATIONAL MUTATIONAL PRESSURES.
DOI: 10.5220/0003755900510057
In Proceedings of the International Conference on Bioinformatics Models, Methods and Algorithms (BIOINFORMATICS-2012), pages 51-57
ISBN: 978-989-8425-90-4
Copyright
c
2012 SCITEPRESS (Science and Technology Publications, Lda.)
Genes (e.g. coding for ribosomal proteins) that are
essential for cell functioning tend to be coded in the
leading strand (Rocha and Danchin, 2003a); (Rocha
and Danchin, 2003b). Their conserved location in
the DNA strand implicates a strong constraint on
chromosomal rearrangements (see also (Mackiewicz
et al., 2001)). The location of genes on differently
replicated DNA strands is also related to their di-
vergence. Genes coded in the leading strand gen-
erally accumulate less substitutions than the lagging
strand genes whereas orthologs located on the dif-
ferently replicated strands in the compared genomes
show the highest divergence (Tillier and Collins,
2000b); (Rocha and Danchin, 2001); (Szczepanik
et al., 2001); (Mackiewicz et al., 2003b). Com-
puter simulation studies confirmed these observations
and revealed additionally that the best survival strat-
egy for the majority of genes is switching between
DNA strands to change the direction of the muta-
tional pressure from time to time (Mackiewicz et al.,
2004); (Dudkiewicz et al., 2004); (Dudkiewicz et al.,
2005); (Mackiewicz and Cebrat, 2009). Exceptions
from this tendency are genes coding for ribosomal
proteins which do not profit very much from switch-
ing the directional pressure. It is in agreement with
their extremely conserved positions on the prokary-
otic chromosomes (Mackiewicz et al., 2001); (Mack-
iewicz et al., 2003a).
The above-mentioned computer simulation in-
cluded amino acid composition as the selection con-
straint. Thus we have presented here the results of
other type of simulations in which selection for stop
codon occurrence and the algorithm for recognition of
protein coding sequences (Bła
˙
zej et al., 2010); (Bła
˙
zej
et al., 2011) were applied. This algorithm exploites a
specific way of genetic code degeneration and rela-
tions between mutational pressure and selection pres-
sure shaping the amino acid usage in the proteomes.
We used the algorithm to study how selection operat-
ing on the nucleotide level influences the elimination
of genes subjected to the directional mutational pres-
sure. We were also interested in changes of the coding
potential of genes under the mutational pressure dur-
ing simulation time.
2 METHODS
The presented simulations were performed on DNA
sequences of the Borrelia burgdorferi genome. This
genome is very suitable for studies of the directional
mutational pressure associated with replication be-
cause it shows very strong DNA asymmetry (McIner-
ney, 1998); (Mackiewicz et al., 1999c); (Lafay et al.,
1999), does not show a selection for synonymous
codon usage, and has the defined mutational pres-
sure associated with replication for both DNA strands
(Kowalczuk et al., 2001b).
We considered population composed of 72
genomes (individuals). Each genome was rep-
resented by 475 genes annotated as protein cod-
ing sequences according to the NCBI database
(www.ncbi.nlm.nih.gov) record of the B. burgdorferi
genome. These genes were divided into two subsets:
1. sequences lying on the leading DNA strand (333
genes of the total length 356, 034 nt);
2. sequences lying on the lagging DNA strand (142
genes of the total length 173, 796 nt).
One Monte Carlo step (MCS) of the simulation
consisted of two stages:
1. The mutation process of gene sequence;
2. The selection process of individuals.
During the first stage, a nucleotide of the genome
sequence was chosen for mutation according to the
Poisson process assuming one possible mutation per
genome on average. The selected nucleotide was then
substituted by another nucleotide with the probabil-
ity given in the one of two substitution matrices for
the leading or the lagging strand (see Tab. 1 and Tab.
2). The matrices describe the real mutational pressure
for the differently replicated DNA strands of the B.
burgdorferi genome. They were constructed empiri-
cally by the comparison of original genes with their
potential pseudogenes found in intergenic regions of
the B. burgdorferi chromosome (Kowalczuk et al.,
2001b).
Table 1: The substitution matrix describing mutational pres-
sure in the leading DNA strand. A nucleotide in the first
column is substituted by a nucleotide in the first row.
A T G C
A 0.81 0.10 0.07 0.02
T 0.07 0.87 0.03 0.03
G 0.16 0.12 0.71 0.01
C 0.07 0.26 0.05 0.62
Table 2: The substitution matrix describing mutational pres-
sure in the lagging DNA strand. A nucleotide in the first
column is substituted by a nucleotide in the first row.
A T G C
A 0.87 0.07 0.03 0.03
T 0.1 0.81 0.02 0.07
G 0.26 0.07 0.62 0.05
C 0.12 0.16 0.01 0.71
In our simulations, we have considered two ver-
sions of the mutational pressure acting on gene se-
BIOINFORMATICS 2012 - International Conference on Bioinformatics Models, Methods and Algorithms
52
quences. In the first possibility (direct pressure), the
genes from a given DNA strand (e.g. leading) were
subjected to the matrix of the strand on which they
were lying (i.e. leading). In the second case (reverse
pressure), the genes were under the pressure charac-
teristic of the opposite strand (i.e. lagging in this ex-
ample). It mimics the inversion of the gene in chro-
mosome.
The selection was modeled by the gene finding al-
gorithm (called PMC) for prokaryotic genomes that
was previously described by (Bła
˙
zej et al., 2010);
(Bła
˙
zej et al., 2011); (Wa
´
nczyk et al., 2011). This al-
gorithm consists of three independent homogeneous
Markov chains which describe transition probabili-
ties between nucleotides separately for each of three
codon positions in a given DNA sequence. This al-
gorithm does not require a high chain order to work
properly and uses specific correlations in the nu-
cleotide composition observed in the first, the second,
and the third codon positions, which are characteristic
of protein coding genes (Cebrat et al., 1997); (Cebrat
et al., 1998). Small sizes of matrices used by this al-
gorithm enable using only a few coding sequences for
its effective training.
If a given sequence was recognized by this algo-
rithm as a protein coding sequence in the first reading
frame, the nucleotide substitution was accepted, oth-
erwise the individual with the lost coding signal was
eliminated and replaced by another individual from
the population. Another reason for the individual re-
placement was the appearing of a stop codon inside its
gene sequence. We have recorded several parameters
during the simulations, which were finally presented
as averages calculated over all genes and individuals
in the population.
3 RESULTS
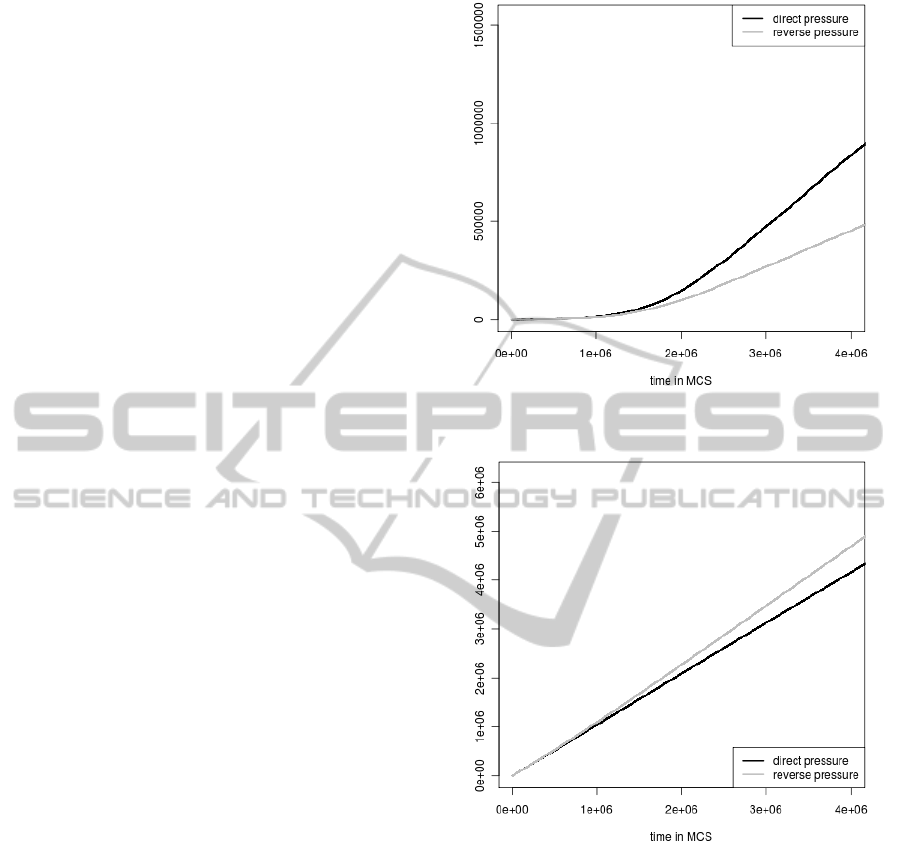
Individuals could be eliminated from the population
because of two reasons: loss of the coding potential
by one of its gene or appearance of a stop codon in
one of its gene sequence. The accumulated numbers
of individuals eliminated because of these two selec-
tions during the simulation time are shown in Fig.
1 and Fig. 2, respectively. These numbers increase
in both cases but the elimination of genomes by stop
codons generation is much more frequent than by the
loss of the coding signal. It indicates that it is easier
to introduce a stop codon to the gene sequence than
to change its coding potential described by nucleotide
composition. Moreover, the increase in the accumu-
lated number of individuals eliminated because of the
selection against stop codons begins already from the
Figure 1: The accumulated numbers of individuals elimi-
nated because of the coding signal loss in their genes.
Figure 2: The accumulated numbers of individuals elimi-
nated because of the stop codon appearance in their gene
sequence.
start of simulations whereas the number for the cod-
ing signal selection grows significantly only after 1
million MCS. Till this time, the elimination of indi-
viduals from the population by the coding signal loss
is negligible.
In addition, the frequency of elimination of in-
dividuals depends clearly on the applied mutational
pressure (Fig 1. and Fig 2). For example the accumu-
lated number of eliminated genomes because of the
coding signal loss grows faster when the direct pres-
sure (i.e. when genes are subjected to their own ma-
trix) is applied. The number is lower in the case of the
reverse pressure (i.e. when genes are under the oppo-
SIMULATION OF BACTERIAL GENOME EVOLUTION UNDER REPLICATIONAL MUTATIONAL PRESSURES
53
site matrix). If we consider the accumulated number
of genomes eliminated because of the stop codon ap-
perance we obtain the opposite situation. In this case
the number of eliminated genomes grows faster when
the reverse pressure is applied.
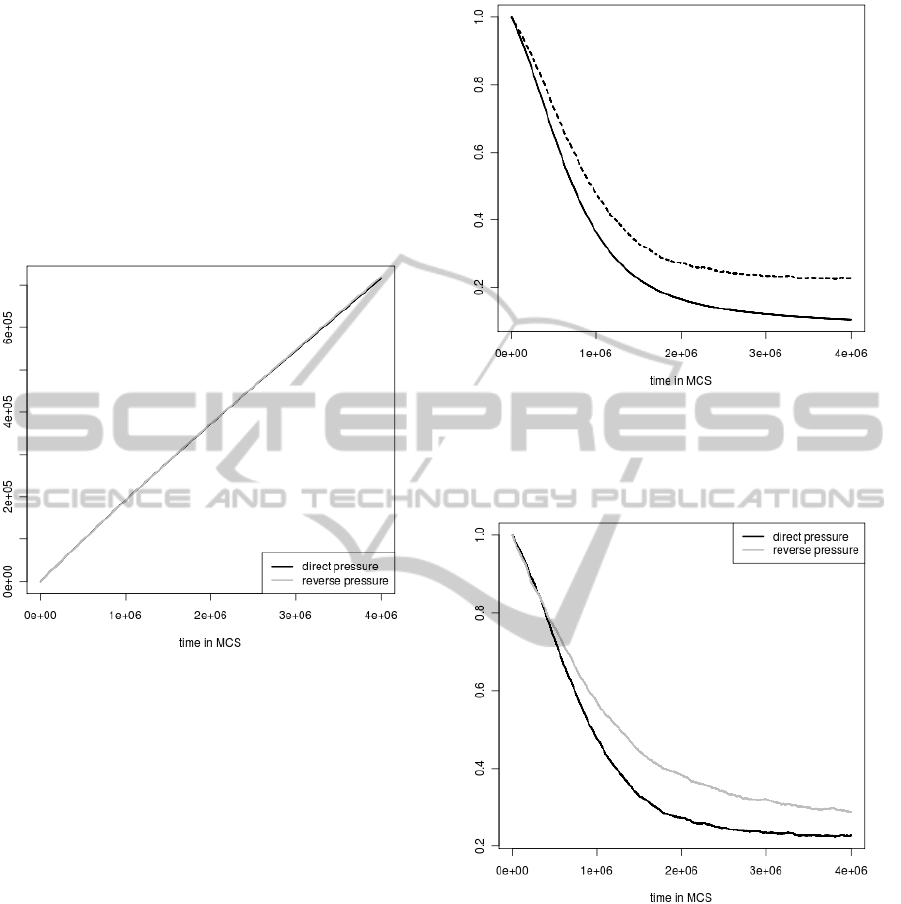
The superposition of these two differently acting
selections equalizes the potential differences between
the mutational pressures in the case of the number
of substitutions accumulated during simulations (Fig.
3). Thus the numbers are almost identical for the di-
rect and reverse mutational pressures.
Figure 3: The average numbers of mutations accumulated
during simulations.
The average protein coding signal (computed for
all individuals who were still alive in a given simu-
lation step) normalized by the average protein coding
signal at the beginning of the simulation was another
important feature which was considered during every
simulation step (Fig. 4 and Fig 5).
As one could expect the average coding signal de-
creases faster in the simulation without selection con-
straints than in the simulation when the selection was
applied (Fig 4). However, the differences are not very
large, which indicates that the applied selection keeps
the signal very poorly.
Interestingly, the similar differences in the coding
signal were observed between simulations with se-
lections when direct and reverse mutational pressures
were applied (Fig 5). Nevertheless, in the case of the
sequences subjected to the reverse pressure, the cod-
ing signal is better preserved than for the direct pres-
sure. It well agrees with the results presented in (Fig
1), which indicates that the direct pressure more often
influences the coding signal and eliminates individu-
als because of the signal loss than the reverse pres-
sure. Furthermore, it is in agreement with the com-
Figure 4: The comparison of the average coding signal in
the simulation run with selection (dashed line) and without
selection (solid line). The change of the average coding
signal was normalized by the average coding signal at the
start of the simulation.
Figure 5: The comparison of the average coding signal in
simulations with selections run under different mutational
pressures. The change of the average coding signal was
normalized by the average coding signal at the start of the
simulation.
parative genome analysis that orthologous sequences
located on the differently replicated DNA strands
evolve faster than orthologs at conserved positions
(Tillier and Collins, 2000b); (Rocha and Danchin,
2001); (Szczepanik et al., 2001); (Mackiewicz et al.,
2003b).
We also compared the accumulated number of
damaged genes subjected to different pressures for the
leading and lagging DNA strand separately (Fig. 6
BIOINFORMATICS 2012 - International Conference on Bioinformatics Models, Methods and Algorithms
54
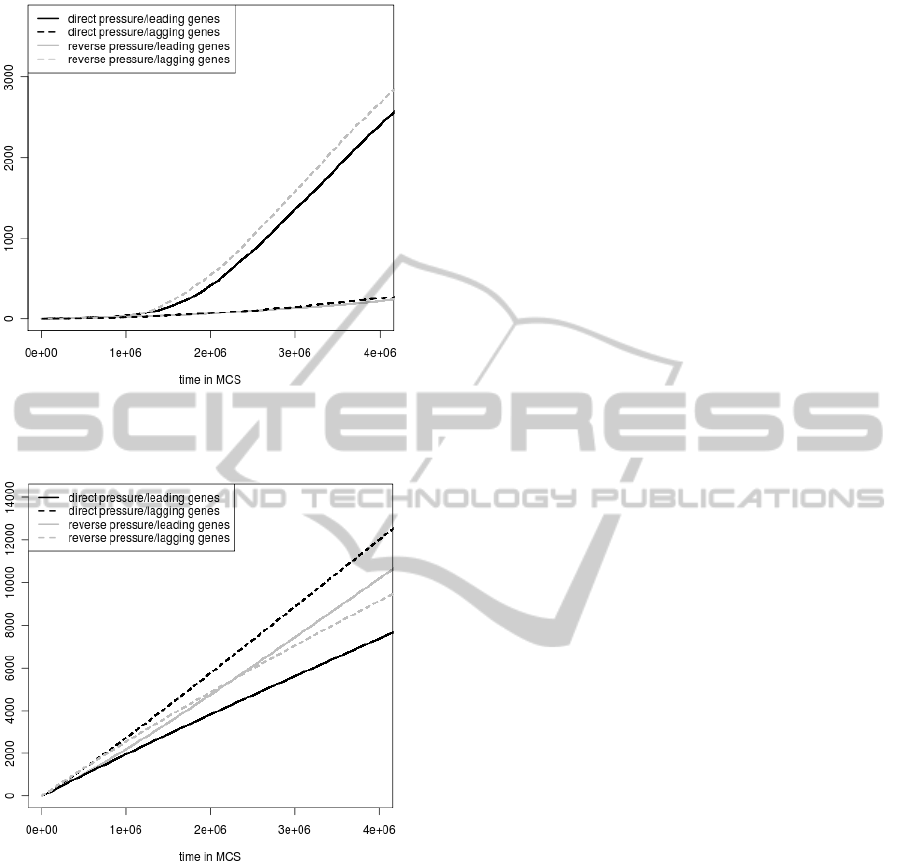
Figure 6: The accumulated numbers of genes damaged be-
cause of the coding signal loss in the leading strand and in
the lagging strand.
Figure 7: The accumulated numbers of genes damaged be-
cause of the stop codon appearance in their gene sequence
in the leading strand and in the lagging strand.
and Fig. 7). Because the leading strand genes are
more than two times numerous than the lagging ones,
we normalized the numbers of damaged genes. It is
interesting that the numbers of genes eliminated be-
cause of their coding signal loss are the highest when
genes are under the mutational pressure typical of the
leading strand (Fig 6). It is in the case when the
leading strand pressure is direct for the leading strand
genes and reverse for the lagging genes. On the other
side, the highest accumulated numbers of genes elim-
inated by stop codons are in the situation when genes
are subjected to the mutational pressure from the lag-
ging strand (Fig. 7). It is in the case when the lagging
pressure is reverse for the leading strand genes and di-
rect for the lagging genes. However, the excess is less
pronounced in this case and is visible after 2.5 mil-
lion MCS. Till this time, the accumulated numbers of
damaged lagging genes are higher when they are un-
der the leading strand pressure than the lagging strand
pressure.
4 DISCUSSION
We have considered a simulation model of bacterial
genome evolution where algorithm for finding protein
coding signal and stop codon occurrence played a role
as selection criteria. The simulations were run under
different mutational pressures which were described
by various substitution matrices. The obtained re-
sults indicate that it is not indifferent to genes from
the differently replicated DNA strands to which mu-
tational pressure and selection they are subjected. The
leading strand mutational pressure is more destructive
for coding signal and therefore is more harmful for
genes from both DNA strands when selection for the
coding signal preservation is applied. On the other
hand, the pressure typical of the lagging strand elim-
inates more genes being under the selection against
stop codons because the lagging strand substitutions
generate such codons with higher frequency. Inter-
estingly, the results are in agreement with analysis
of nucleotide usage biases in four-fold degenerated
sites in codons from bacterial genes (Khrustalev and
Barkovsky, 2010).
In general, the elimination of genomes from the
population because of stop codon appearance is more
frequent than their elimination by the loss of the cod-
ing signal which is additionally delayed in the time
of simulation. Interestingly, the average number of
accumulated mutations is very similar in the applied
mutational pressures because of the superposition of
effects of these two selections.
It seems to be important to notice, that the effect
of selection pressure used in all simulations was ex-
clusively negative. The higher robustness of coding
sequences with enhanced coding signal after substi-
tutions could be considered as some hidden no direct
positive selection. Nevertheless, it would be interest-
ing to introduce the direct positive selection effect of
the increased coding signal.
We expect that the obtained results of simulations
should be very similar to those using other selection
algorithms predicting protein coding sequences based
on other coding measures, e.g. codon or dicodon
usage, because the measures used by the algorithm
applied here are strongly correlated with the others.
SIMULATION OF BACTERIAL GENOME EVOLUTION UNDER REPLICATIONAL MUTATIONAL PRESSURES
55

The presented model of bacterial genome evolution,
which was shown in the example of B. burgdorferi,
should give similar general results for other bacte-
rial genomes because their DNA asymmetry resem-
bles that from the species analyzed here.
REFERENCES
Bła
˙
zej, P., Mackiewicz, P., and Cebrat, S. (2010). Using the
genetic code wisdom for recognizing protein coding
sequences. In Proceedings of the 2010 International
Conference on Bioinformatics & Computational Biol-
ogy (BIOCOMP 2010), pages 302–305.
Bła
˙
zej, P., Mackiewicz, P., and Cebrat, S. (2011). Algo-
rithm for finding coding signal using homogeneous
markov chains independently for three codon posi-
tions. In Proceedings of the 2011 International Con-
ference on Bioinformatics and Computational Biology
(ICBCB 2011), pages 20–24.
Cebrat, S., Dudek, M., and Mackiewicz, P. (1998). Se-
quence asymmetry as a parameter indicating coding
sequence in saccharomyces cerevisiae genome. The-
ory in Biosciences, 117:78–89.
Cebrat, S., Dudek, M., Mackiewicz, P., Kowalczuk, M.,
and Fita, M. (1997). Asymmetry of coding ver-
sus non-coding strand in coding sequences of differ-
ent genomes. Microbial and Comparative Genomics,
2:259–268.
Dudkiewicz, M., Mackiewicz, P., Kowalczuk, M., Mack-
iewicz, D., Nowicka, A., Polak, N., Smolarczyk, K.,
Kriaga, J., Dudek, M., and Cebrat, S. (2004). Simu-
lation of gene evolution under directional mutational
pressure. Physica A, (336):63–73.
Dudkiewicz, M., Mackiewicz, P., Mackiewicz, D., Kowal-
czuk, M., Nowicka, A., Polak, N., Smolarczyk, K.,
Kiraga, J., Dudek, M., and Cebrat, S. (2005). Higher
mutation rate helps to rescue genes from the elimina-
tion by selection. Biosystems, 80:192–199.
Frank, A. and Lobry, J. (1999). Asymmetric substitution
patterns: a review of possible underlying mutational
or selective mechanisms. Gene, 238:65–77.
Freeman, J., Plasterer, T., Smith, T., and Mohr, S. (1998).
Patterns of genome organization in bacteria. Science,
279:1827.
Grigoriev, A. (1998). Analysing genomes with cumulative
skew diagrams. Nucleic Acids Res., 26:2286–2290.
Khrustalev, V. and Barkovsky, E. (2010). The probability
of nonsense mutation caused by replication-associated
mutational pressure is much higher for bacterial genes
from lagging than from leading strands. Genomics,
96:173–180.
Kowalczuk, M., Mackiewicz, P., Mackiewicz, D., Now-
icka, A., Dudkiewicz, M., Dudek, M., and Cebrat, S.
(2001a). DNA asymmetry and the replicational muta-
tional pressure. J. Appl. Genet., 42:553–577.
Kowalczuk, M., Mackiewicz, P., Mackiewicz, D., Now-
icka, A., Dudkiewicz, M., Dudek, M., and Cebrat,
S. (2001b). High correlation between the turnover of
nucleotides under mutational pressure and the DNA
composition. BMC Evol. Biol., 1:13.
Lafay, B., Lloyd, A., McLean, M., Devine, K., Sharp,
P., and Wolfe, K. (1999). Proteome composition
and codon usage in spirochaetes: species-specific and
DNA strand-specific mutational biases. Acids Res.,
27:1642–1649.
Lobry, J. (1996). Asymmetric substitution patterns in the
two DNA strands of bacteria. Mol. Biol. Evol., 13:,
660–665.
Lobry, J. and Sueoka, N. (2002). Asymmetric directional
mutation pressures in bacteria. Genome Biol., 3:58.
Mackiewicz, D. and Cebrat, S. (2009). To understand nature
- computer modelling between genetics and evolution.
In J. Miekisz and M. Lachowicz (eds), From Genetics
to Mathematics (Series on Advances in Mathematics
for Applied Sciences) Vol. 79, pages 1–33. World Sci-
entific.
Mackiewicz, D., Mackiewicz, P., Kowalczuk, M., Dud-
kiewicz, M., Dudek, M., and Cebrat, S. (2003a).
Rearrangements between differently replicating dna
strands in asymmetric bacterial genomes. Acta Mi-
crobiologica Polonica, 52:245–261.
Mackiewicz, P., Dudkiewicz, M., Kowalczuk, M., Mack-
iewicz, D., Kiraga, J., Polak, N., Smolarczyk, K.,
Nowicka, A., Dudek, M., and Cebrat, S. (2004). Dif-
ferential gene survival under asymmetric directional
mutational pressure. Lecture Notes in Computer Sci-
ence, 3039:687–693.
Mackiewicz, P., Gierlik, A., Kowalczuk, M., Dudek, M.,
and Cebrat, S. (1999a). Asymmetry of nucleotide
composition of prokaryotic chromosomes. J. Appl.
Genet., 40:1–14.
Mackiewicz, P., Gierlik, A., Kowalczuk, M., Dudek, M.,
and Cebrat, S. (1999b). How does replication-
associated mutational pressure influence amino acid
composition of proteins? Genome Res., 9:409–416.
Mackiewicz, P., Gierlik, A., Kowalczuk, M., Szczepanik,
D., Dudek, M., and Cebrat, S. (1999c). Mechanisms
generating long-range correlation in nucleotide com-
position of the borrelia burgdorferi genome. Physica
A, 273:103–115.
Mackiewicz, P., Mackiewicz, D., Kowalczuk, M., Dud-
kiewicz, M., Dudek, M., and Cebrat, S. (2003b). High
divergence rate of sequences located on different DNA
strands in closely related bacterial genomes. J. Appl.
Genet., 44:561–584.
Mackiewicz, P., Szczepanik, D., Gierlik, A., Kowalczuk,
M., Nowicka, A., Dudkiewicz, M., Dudek, M., and
Cebrat, S. (2001). The differential killing of genes
by inversions in prokaryotic genomes. J. Mol. Evol.,
53:615–621.
McInerney, J. (1998). Replicational and transcriptional se-
lection on codon usage in borrelia burgdorferi. Proc.
Natl. Acad. Sci. U.S.A., 95:10698–10703.
McLean, M., Wolfe, K., and Devine, K. (1998). Base com-
position skews, replication orientation, and gene ori-
entation in 12 prokaryote genomes. J. Mol. Evol.,
47:691–696.
Mrazek, J. and Karlin, S. (1998). Strand compositional
BIOINFORMATICS 2012 - International Conference on Bioinformatics Models, Methods and Algorithms
56

asymmetry in bacterial and large viral genomes. Proc.
Natl. Acad. Sci. U.S.A., 95:3720–3725.
Rocha, E. and Danchin, A. (2001). Ongoing evolution of
strand composition in bacterial genomes. Mol. Biol.
Evol., 18:1789–1799.
Rocha, E. and Danchin, A. (2003a). Gene essentiality deter-
mines chromosome organisation in bacteria. Nucleic
Acids Res., 31:5202–5211.
Rocha, E. and Danchin, A. (2003b). Essentiality, not ex-
pressiveness, drives gene strand bias in bacteria. Na-
ture Genetics, 34:377–378.
Rocha, E., Danchin, A., and Viari, A. (1999). Universal
replication biases in bacteria. Mol. Microbiol., 32:11–
16.
Rocha, E., Touchon, M., and Feil, E. (2006). Similar com-
positional biases are caused by very different muta-
tional effects. Genome Res., 16:1537–1547.
Szczepanik, D., Mackiewicz, P., Kowalczuk, M., Gierlik,
A., Nowicka, A., Dudek, M., and Cebrat, S. (2001).
Evolution rates of genes on leading and lagging DNA
strands. J. Mol. Evol., 52:426–433.
Tillier, E. and Collins, R. (2000a). The contributions of
replication orientation, gene direction, and signal se-
quences to base composition asymmetries in bacterial
genomes. J. Mol. Evol., 50:249–257.
Tillier, E. and Collins, R. (2000b). Replication orientation
affects the rate and direction of bacterial gene evolu-
tion. J. Mol. Evol., 51:459–463.
Wa
´
nczyk, M., Bła
˙
zej, P., and Mackiewicz, P. (2011). Com-
parison of two algorithms based on markov chains ap-
plied in recognition of protein coding sequences in
prokaryotes. In Proceedings of the Seventeeth Na-
tional Conference on Applications of Mathematics in
Biology and Medicine, pages 118–123.
SIMULATION OF BACTERIAL GENOME EVOLUTION UNDER REPLICATIONAL MUTATIONAL PRESSURES
57
