
WIRELESS MESH NETWORKS PLANNING
BASED ON PARAMETERS OF QUALITY OF SERVICE
Marlon da Silva
1
, Edson Luiz França Senne
2
and Nandamudi Lankalapalli Vijaykumar
1
1
National Institute of Spatial Researches, São José dos Campos, Brazil
2
Department of Mathematics, UNESP, Guaratinguetá, Brazil
Keywords: Wireless mesh networks, QoS, Mathematical Programming, Monte Carlo simulation.
Abstract: The use of QoS parameters to evaluate the quality of service in a mesh network is essential mainly when
providing multimedia services. This paper proposes an algorithm for planning wireless mesh networks in
order to satisfy some QoS parameters, given a set of test points (TPs) and potential access points (APs).
Examples of QoS parameters include: probability of packet loss and mean delay in responding to a request.
The proposed algorithm uses a Mathematical Programming model to determine an adequate topology for
the network and Monte Carlo simulation to verify whether the QoS parameters are being satisfied. The
results obtained show that the proposed algorithm is able to find satisfactory solutions.
1 INTRODUCTION
The extensive use of portable devices, such as
laptops and mobile telephones, has contributed to a
significant increase of the use of wireless mesh
networks (WMNs). In these networks, the main
applications use multimedia (audio and video)
services. Therefore, such services must be provided
as readily as possible, in order to avoid delays which
could compromise the quality of service offered to
the clients. In order to achieve a good quality of
service, a WMN must be well planned.
The main characteristic of a WMN is the multi
hop transmission, where the data is transmitted from
one network device to other devices, extending the
network coverage its clients. Such architecture offers
Internet access at locations where it is difficult to
install an infrastructure needed to directly feed the
access points (APs) by an external network.
The planning of a WMN involves finding an
appropriate set of equipment that composes the
mesh, because an improper installation of the
network may result in either unnecessary costs or in
a structure unable to attend the clients satisfactorily.
However, beyond being well structured, a WMN
must also offer a good quality service to its clients.
Here, it is common to use some parameters to assess
if the network has a desired performance level – the
quality of service (QoS) parameters.
This paper focuses on the problem of finding, at
the lowest cost, a topology for WMNs that satisfies
all clients’ requirements within a quality of service
previously set, with the smallest possible number of
network devices.
To attend these objectives, initially a set of APs,
that has to be used and obeying network coverage
constraints, is determined by employing Mixed
Integer Linear Programming (MILP). Then, Monte
Carlo simulation (MCS) is used to determine the
values of the QoS parameters: probability of packet
loss and the average delay. If the value obtained for
a QoS parameter is not within the expected interval,
the algorithm will suggest a modification in the
WMN topology and the verification of QoS
parameters will be applied again. This process
continues until all parameters are attended.
The paper is organized as follows. In Section 2,
some related works about WMN planning, QoS
parameters, MILP and MCS are presented. Section 3
shows how the proposed algorithm is organized and
details the models used to find a satisfactory
topology for WMN (a MILP model) and to verify
the QoS parameters (a MCS model). Numerical
results are presented in Section 4. Conclusions and
future research are described in Section 5.
441
da Silva M., Luiz França Senne E. and Lankalapalli Vijaykumar N..
WIRELESS MESH NETWORKS PLANNING BASED ON PARAMETERS OF QUALITY OF SERVICE.
DOI: 10.5220/0003760104410446
In Proceedings of the 1st International Conference on Operations Research and Enterprise Systems (ICORES-2012), pages 441-446
ISBN: 978-989-8425-97-3
Copyright
c
2012 SCITEPRESS (Science and Technology Publications, Lda.)

2 DEFINITIONS
2.1 Network Topology Problem
WMNs (Akyildiz et al., 2005; Silva et al., 2010) are
networks composed by APs (Access Points) and TPs
(Test Points or Clients). APs, which compose the
main structure of the WMN, are classified as: routers
– responsible only for sending data to TPs – and
gateways – responsible for feeding the network,
using external data sources. These APs usually are
installed in places with high visibility.
Figure 1 shows an example of a WMN, showing
the main elements that compose it (Figure 1a) and
one AP installed on the top of a building located at
UFPA (Federal University of Pará, Belém, Brazil)
(Figure 1b), where the router is inside the box in the
center of antenna that amplifies the signal for
increasing the coverage ratio.
(a) (b)
Figure 1: (a) Wireless mesh network sample (Silva et al.,
2010) and (b) a mesh antenna.
WMNs (Lee et al., 2006) are being intensively
used in residences, buildings, universities,
companies and vehicles and can deal with
applications that cannot be supported by other
wireless technologies, because they have as main
advantages the extended coverage, strength, self-
configuration, easy maintenance and low cost and
may be installed in areas with large coverage, where
it is difficult to install cables and conductors, as in
locations found in emergency services.
The functional characteristics of a WMN are
illustrated in Díaz and Díaz (2006), where
difficulties that can be found in a wireless network,
such as transmission capacity that decreases in
function of the distance between the router and the
client; channel interferences, where only three
channels can overlap in a region; and objects that
may interfere in the wireless transmission.
The installation of a WMN requires a good
planning, so that the network can serve all customers
as best as possible, avoiding lack of quality in the
network and a possible waste of equipment.
WMN planning is studied in Benyamina et al.
(2008), Amaldi et al. (2008) and Cabral and Mateus
(2009) differently from other networks, because
WMNs are planned geographically, where the
position and the configuration of APs depend only
on the conditions of local connectivity between
clients and closer network devices. Given a set of
candidate points to install APs and a set of clients,
some MILP models were proposed, whose objective
was to minimize the total cost of installation, taking
into account both the requirements of location and
multihop connectivity.
2.2 Evaluating QoS Parameters
Some QoS parameters, such as the capacity of
assuring service for some traffic types, by means of
some available technologies are defined in Abelém
et al. (2007). The main characteristics of QoS in a
WMN are listed, which are adopted as metrics to
measure how good the service is provided by the
network.
Performance measures are applied primarily to
attend demands for multimedia packages (audio and
video). In Saade et al. (2007) and Abelém et al.
(2007), some communication protocols in WMNs
are presented, which are basically divided into two
types: proactive (routes previously determined) and
reactive (on demand). Other protocols have been
used, such as adaptive and hybrid, combining main
characteristics of proactive and reactive protocols,
and are ideal for large networks containing a large
amount of devices, such as a WMN.
In a network planning where the metrics of QoS
must be considered, it is necessary to verify the
quality of the services offered. To do this,
computational or mathematical models can be used
to measure QoS parameters. Simulation is one of the
most used techniques to represent and evaluate a real
scenario.
2.3 Monte Carlo Simulation
Monte Carlo Simulation (MCS) (Mun, 2006) is
often used to predict possible risks that a system
may suffer. It is more efficient than other methods
because it uses the initial parameters that direct the
system behavior. By the occurrence of events which
behave according to probability distributions
(Rubinstein and Kroese, 2007), it is possible to
easily extract measures of a high complex real
model. Random demands, based on the probability
distribution that best represents its operation,
ICORES 2012 - 1st International Conference on Operations Research and Enterprise Systems
442

stimulate the functioning of the system and provide
some performance measures.
An example of this type of application is shown
in Atkinson et al. (2008), where the authors
proposed an algorithm for MCS applied to a system
of emergency service.
3 THE PROPOSED ALGORITHM
The algorithm discussed in this paper seeks a low
cost topology of a WMN, provided that QoS
parameters – loss probability (p
loss
) and average
delay (D) – are satisfied. These values must be less
than or equal to expected values for the network
(p
expec
and D
expec
).
Figure 2 illustrates the steps of the algorithm
proposed to obtain a network topology which
minimizes installation cost and satisfies QoS
parameters.
Figure 2: The proposed algorithm.
Given the set P = {1, 2, …, n} of candidate APs
and the set C = {1, 2, …, m} of TPs, it is possible to
calculate the matrices of distances from AP to TP
and from AP to AP. These matrices will be used to
guarantee the network coverage.
3.1 Network Topology Problem
Initially, one solution must be found to the network
topology problem by solving a MILP model adapted
from ideas presented in Benyamina et al (2008) and
Amaldi et al. (2008). The difference presented in
this work is in constraints that reduce the amount of
variables and in establishing a minimum of
gateways.
Given the values to the parameters previously
established (Table 1), the solution of this model
shows a network topology with lowest cost, through
the values of active APs (z
j
), gateways (g
j
), links
between APs (y
jl
), links between TPs and APs (x
ij
)
and flow variables to links between APs (f
jl
) and
gateways (F
j
), with i
∈
C and j,l∈ P.
Table 1: MILP parameters.
Description Parameter
AP instalation cost S
j
Additional installation cost of a gateway K
j
Covering between APs (= 1, if j covers l) b
j
l
Covering TP-AP (= 1, if j covers i) c
i
j
Initial demand of a TP i h
i
Link capacity between APs u
j
l
Service capacity of AP v
j
Traffic capacity of a gateway M
Initial number of gateways G
The MILP model is as follows:
Minimize
∑
=
+
n
j
jjjj
gKzS
1
)(
(1)
Subject to
1
1
=
∑
=
n
j
ij
x
Ci ∈∀
(2)
ijjij
czx ≤
Pj,Ci ∈∀∈∀
(3)
0)(
11
=−−+
∑∑
==
n
l
jjllj
m
i
iji
Fffxh
Pj ∈∀
(4)
jljljl
yuf ≤
Pl,j ∈∀
(5)
j
m
i
iji
wxh ≤
∑
=1
Pj ∈∀
(6)
jj
MgF ≤
Pj ∈∀
(7)
Gg
n
j
j
≥
∑
=1
(8)
)(2
ljjljl
zzby +≤
Pl,j ∈∀
(9)
jj
zg ≤
Pj ∈∀
(10)
3)(
1
≤+
∑
=
n
l
ljjl
yy
Pj ∈∀
(11)
}1,0{,,, ∈
jjjlij
gzyx
Pl,j,Ci ∈∈∀
(12)
In this model, the objective function (1)
minimizes the cost of installation of APs (Sj) and the
additional cost of installation of gateways (Kj) in the
WMN. The guarantee that a TP has been linked in a
AP is described in constraint (2). Inequation (3)
guarantees coverage between AP j and TP i.
Constraint (4) defines the flow balance of each AP.
There are constraints to flow capacity on each link
(5), on each AP (6) and each gateway (7) on the
network. The minimum number of gateways
GivencandidatesAPsandTPs
Repeat
Findasolutiontothenetworktopologyproblem
Verifythequalityofserviceparameters
If((p
loss
<p
expec
)and(D<D
expec
))then
ThetopologysatisfiestheQoSparameters
Elseif(p
loss
>p
expec
)
Add1gatewaytotheminimumnumberofgateways
Elseif(D>D
expec
)
Disablethegatewaywhichthebiggestflow
End
UntilQoSparametersaresatisfied.
WIRELESS MESH NETWORKS PLANNING BASED ON PARAMETERS OF QUALITY OF SERVICE
443

(denoted by G) required in the network is described
in constraint (8). Constraint (9) ensures that there is
at least one link between two active APs, since these
points are covered together. Inequation (10) ensures
that a gateway must be an active AP of the network.
An AP must contain at the most three links, due to
maximum amount of channels in a wireless network,
described in constraint (11) (Díaz and Díaz, 2006).
The optimal solution to this Mathematical
Programming model shows the values of binary
variables of links between AP and TP (x
ij
), links
between APs (y
jl
), state of AP activity (z
j
) and use of
gateways (g
j
).
3.2 Verification of QoS parameters
Results obtained from Mathematical Programming
model are used to verify QoS parameters of the
network. This is obtained by Monte Carlo simulation
based on Atkinson et al. (2008). The objective of
Monte Carlo simulation is to obtain values of loss
probability and average delay for three data types –
common data, audio and video. Some rates are used
to represent the traffic of network.
The difference to original model is in the
addition of multihop application over behavior of the
system and in evaluating system response delay
within the simulation.
Let λ
di
be the demand rate to data, λ
ai
the demand
rate to audio and λ
vi
the demand rate to video, for all
TP i
∈C and μ
j
the service rate of AP j
∈
P. Let
ξ = [ξ
1
, ξ
2
, …, ξ
n
] be the vector to control the amount
of packets within of each candidate AP. If candidate
AP j has been disabled, then its respective value for
ξ
j
is equal to 0. Otherwise, either ξ
j
maybe is greater
than zero or less than the maximum capacity of
service queue, denoted by Γ
j
.
Let Θ
(k)
be the total service rate of all calls in the
system at the event k, initialized by 0 and
Λ =
∑
=
++
m
i 1
viaidi
)(
λλλ
the total of demand rates
across network.
To obtain values for p
loss
and D, the simulation
algorithm follows steps below, given T = (d, a or v),
where d represents data, a represents audio and v
represents video packets:
1) Simulate random variable ω
∈ [0, 1].
2) If
)(
)(k
ΘΛΛω
+≤ , then enter a request in a
network,
1
)()1(
+=
+ k
T
k
T
γγ
if there is a request of
type T. Simulate random variable σ
∈C, whose
probability is equal to
Λλ
σ
T
for every type T. If
σσ
Γξ
≤
)(k
, then request enters the queue and
1
)()1(
+=
+ kk
σσ
ξξ
at the random instant ψ
(k)
. Else,
packet has been lost,
1
)(
,
)1(
,
+=
+ k
lossT
k
lossT
γγ
if lost packet
is a request of type T.
3) If
)(
)(k
ΘΛΛω
+> , then simulate random
variable δ
∈
P, with probability
)(
)(
k
k
Θθ
δ
, such
that
)(k
δ
θ
=
)(k
δ
ξ
×μ
i
if
)(k
δ
ξ
> 0. Then,
1
)()1(
−=
+ kk
δδ
ξξ
and, for the next AP of the route
φ
∈
P, 1
)()1(
−=
+ kk
ϕϕ
ξξ
. But, if φ is a gateway,
then packet is attempted and, for η is the number
of hops that packet used to travel until a gateway
to be attempt, average delay is given as
ηψψ
)(
)1()()( −
−=
k
T
k
T
k
T
D for every type T.
4) For some j
∈
P, then calculate
∑
>
+
=
0:
)1(
ji
j
j
k
ξ
μΘ
and
ψ
(k+1)
= ψ
(k)
+ 1. Repeat step 1 until N iterations.
Once simulation is completed, QoS parameters
are estimated, loss probability is equal to
)()(
,,
k
T
k
lossTlossT
p
γγ
= and average delay is equal to
NDD
N
k
k
TT
∑
=
=
1
)(
for every type of information T.
Values obtained in the simulation are compared
with ideal values for loss probability (p
expec
) and
average delay (D
expec
).
If p
loss
is less than p
expec
and D is less than D
expec
,
then the topology found by MILP model is good and
algorithm is finished. Else if p
loss
is greater than
p
expec
then one gateway will be added to the
minimum amount of gateways G (constraint (8) of
the model) and will find a new solution for network
topology. Else if D is greater than D
expec
, then the
higher value of flow variable F
j
, j∈P will be
examined. For gateway j that has the largest flow to
external network, a constraint will be added that
determines this point will not be a gateway anymore:
0
)1(
≤
+k
j
g . (13)
The MILP model with added constraint will be
providing a new topology to network.
4 COMPUTATIONAL RESULTS
The algorithm is coded in C programming language
and all the experiments were carried out on a AMD
2.6 GHz. MILP run by CPLEX 12.1 and MCS is
implemented 100 times, whose result is based on
arithmetic mean. Two scenarios with these
configurations were tested.
ICORES 2012 - 1st International Conference on Operations Research and Enterprise Systems
444
4.1 Scenario 1
The algorithm to solve the problem of WMN
planning was implemented on a scenario based on a
residential area located at Pindamonhangaba, Brazil.
The points used are distributed based on the problem
studied in Benyamina et al. (2008).
This scenario, Scenario 1, has a square area of
360000 m², with n = 49 AP candidate points,
disposed on a grid and m = 150 TPs, with random
coordinates. Figure 3 shows the location of all
points. Initial values are as follows: (h
i
:2Mb/s,
u
jl
:54Mb/s, w
j
:54Mb/s, M:128Mb/s, S
j
:200, K
j
:8*S
j
,
G:3) and service rates (μ
i
: 2Mb/s) and demand rates
are random.
The expected QoS parameters to the network are:
5% for data, 1% for audio and 1% for video. The
average delay allowed for the network is 100 ms for
audio and 100 ms for video.
Figure 3: Instance of points map.
Table 2 illustrates, for each algorithm iteration,
the values of objective function, represented by
network installation cost, the amount of APs used in
the network and QoS values for loss probability and
average delay.
Table 2: Results found during algorithm execution.
It. Cost APs G
p
loss
D (ms)
d a v a v
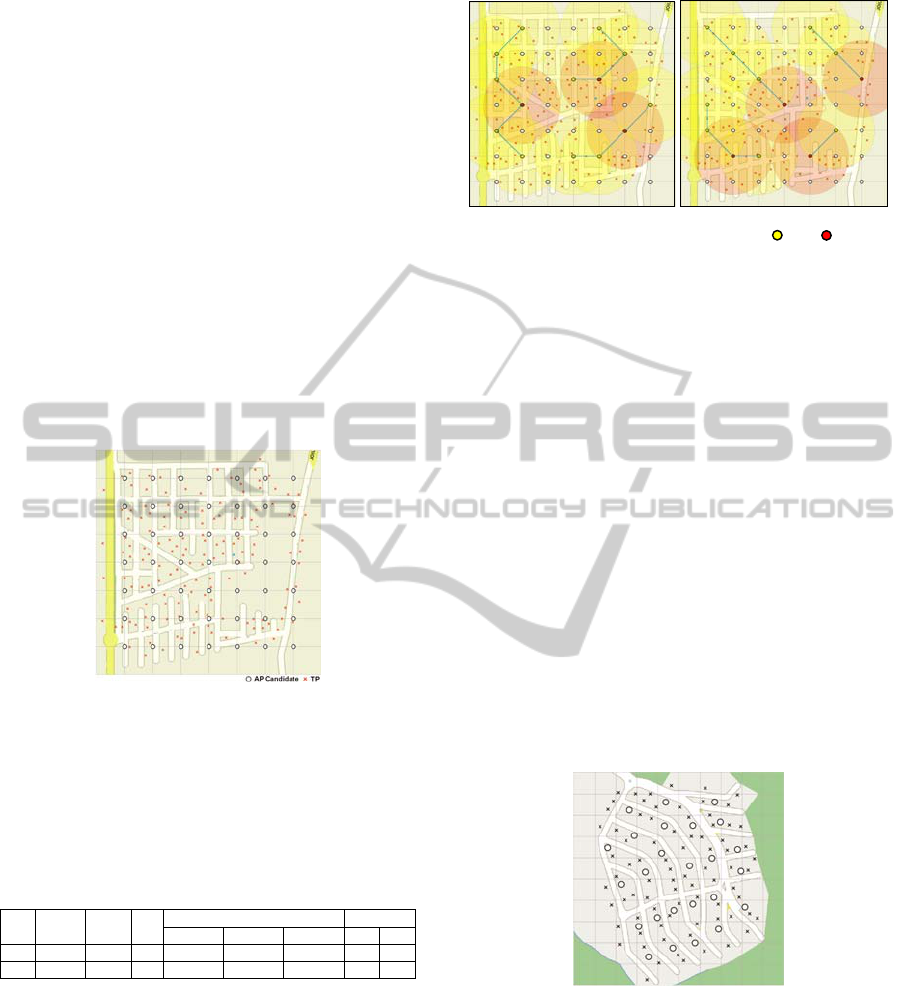
1 7600 13 3 0.0759 0.0167 0.0162 81 79
2 9000 13 4 0.0069 0.0000 0.0002 19 65
Note that in the first iteration, the loss probability
for data, audio and video for the topology found by
Mathematical Programming model (Figure 4a) are
low values, close to those tolerable by the network,
but still above the allowed values.
After adding one gateway to the network, the
values of QoS parameters loss probability and
average delay have significantly decreased, mainly
for audio loss packet, which decreased to 0. Figure 5
can be seen as the network topology that attends the
QoS parameters.
(a) (b)
Router Gateway
Figure 4: (a) Initial solution from MP model and (b) final
solution for Scenario 1.
Computational time of MILP decreases from
6445.65 to 72.54 s. This occurs due to increase in
the minimum number of gateways, which allows the
program to find quickly the optimal solution.
Computational time of MCS decreases from 379 to
219 s.
4.2 Scenario 2
Scenario 2 has a square area of 160000 m², with n =
25 AP candidate points, with random coordinates
and m = 80 TPs, with random coordinates. Figure 5
shows the location of all points. The initial values
adopted by Benyamina et al. (2008) and used to
solve the network coverage problem and to QoS
verification are as follows: (h
i
:2Mb/s, u
jl
:54Mb/s,
w
j
:54Mb/s, M:128Mb/s, S
j
:200, K
j
:8*S
j
, G:1, μ
i
:
2Mb/s, λ
di
: 0~300 kb/s, λ
ai
: 0~700 kb/s, λ
vi
: 0~1
Mb/s).
Figure 5: Instance of points map.
Table 3 illustrates, for every iteration of the
algorithm, the values of objective function (network
installation cost), the amount of APs used in the
network and QoS values for loss probability and
average delay where expected QoS parameters to the
network are: 15% for data, 10% for audio and 10%
for video and average delay allowed for the network
is 150 ms for audio and 150 ms for video.
WIRELESS MESH NETWORKS PLANNING BASED ON PARAMETERS OF QUALITY OF SERVICE
445
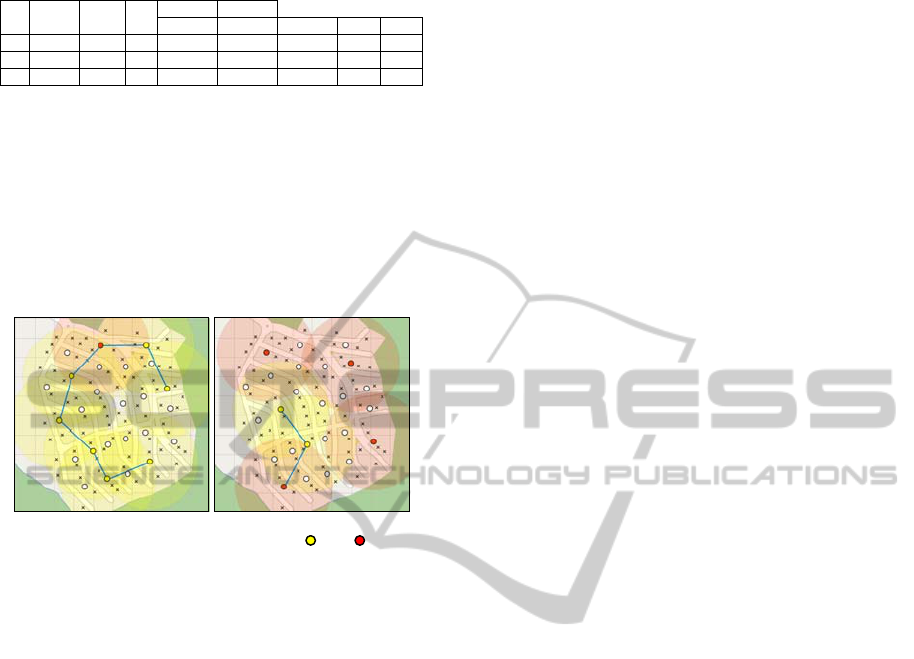
Table 3: Results found during algorithm execution.
It. Cost APs G
p
loss
D (ms)
d a v a v
1 1600 8 1 0.2754 0.2330 0.2286 134 142
2 2400 8 2 0.1212 0.0699 0.0654 147 152
3 3100 7 2 0.0671 0.0116 0.0076 142 148
In the first iteration, the model found a topology
that covers the area totally (Figure 6a), but it is not
ideal. Note in the second iteration, the loss
probability for data, audio and video for the
topology found by MCS obtain allowed values.
However, the average delay to network for video is
not satisfied and, reallocating the gateway with
biggest flow, the algorithm obtained a good
topology in the third iteration (Figure 6b).
(a) (b)
Router Gateway
Figure 6: Initial solution from MP model.
Computational time of MILP decreases from
76.69 to 10.02s, while the time of MCS does not
change, maintaining 130s per iteration.
5 CONCLUSIONS
This paper presented an alternative method for
WMN planning which aims to find a low cost
topology satisfying some QoS values for the
network. Simulation of the operation of WMNs
through MCS is a very effective method to preview
the network performance.
It is intended, as a future work, to apply other
methods to evaluate network performance, besides
using some heuristic to find a satisfactory solution to
Mathematical Programming model, as well as a
comparison of this model and other models, such as
Queuing Networks and Stochastic Programming.
ACKNOWLEDGEMENTS
M. Silva acknowledges Brazilian Council for
Scientific and Technological Development (CNPq)
for the financial support.
REFERENCES
Abelém, A. J. G., Albuquerque, C. V. N., Saade, D. C. M.,
Aguiar, E. S., Duarte, J. L., Fonseca, J. E. M.,
Magalhães, L. C. S., 2007. Redes Mesh: mobilidade,
qualidade de serviço e comunicação em grupo.
Minicourses Book of SBRC 2007. Belém: cap. 2.
Akyildiz, I. F., Wang, X., Wang, W., 2005. Wireless mesh
networks: a survey, Computer Networks, vol. 47, pp.
445–487.
Amaldi, E., Capone, A., Cesana, M., Filippini, I.,
Malucelli, F., 2008. Optimization Models and
Methods for Planning Wireless Mesh Networks.
Computer Networks, vol. 52, pp. 2159-2171, 2008.
Atkinson, J. B., Kovalenko, I. N., Kuznetsov, N.,
Mykhalevych, K. V., 2008. A hypercube queueing
loss model with customer-dependent service rates.
European Journal of Operational Research, vol. 191,
pp. 223-239.
Benyamina, D., Hafid, A., Gendreau, M., 2008. On the
Design of Bi-connected Wireless Mesh Network
Infrastructure with QoS Constraints, IEEE
GLOBECOM, pp. 5307-5312.
Cabral, G. A., Mateus, G. R., 2009. A approach based on
simulation to wireless mesh networks planning,
Proceedings of XLI Brazilian Simposium of
Operational Research (SBPO), Porto Seguro:
UNIFACS.
Chase, R. B., Jacobs, F. R., Aquilano, N. J., 2004.
Operations Management for Competitive Advantage.
10 ed. New York: McGraw Hill.
Díaz, L. E. N., Díaz, J. A. P., 2006. A Model for designing
WLAN’s 802.11 for VoIP. Proceedings of
Electronics, Robotics and Automotive Mechanics
Conference, Guernavaca: IEEE.
Lee, M. J., Zheng, J., Ko, Y. B., Shrestha, D. M., 2006.
Emerging standards for wireless mesh technology.
IEEE Wireless Communications, v. 13, n.2, p. 56-63.
Mun, J., 2006. Modeling risk: applying Monte Carlo
simulation, real options analysis, forecasting, and
optimization techniques. New York: John Wiley &
Sons.
Rubinstein, R. Y., Kroese, D. P., 2007. Simulation and the
Monte Carlo method. New York: John Wiley Inc.
Saade, D. C. M., Albuquerque, C. V. N., Magalhães, L. C.
S., Passos, D. Duarte, J., Valle, R., 2007. Mesh
networks: lower cost solution to popularization of
Brazilian Internet access. Proceedings of Brazilian
Simposium of Telecommunications (XXV SBrT).
Recife.
Silva, M., Senne, E. L. F., Vijaykumar, N. L., 2010.
Wireless mesh networks planning with Hypercube
queueing model to verifying of QoS parameters.
Proceedings of XLII Brazilian Simposium of
Operational Research, Bento Gonçalves: UFSM.
ICORES 2012 - 1st International Conference on Operations Research and Enterprise Systems
446
