
EVALUATION OF STEREO MATCHING COSTS ON
CLOSE RANGE, AERIAL AND SATELLITE IMAGES
Ke Zhu
1
, Pablo d’Angelo
2
and Matthias Butenuth
1
1
Remote Sensing Technology, Technische Universit
¨
at M
¨
unchen, Arcisstr 21, M
¨
unchen, Germany
2
The Remote Sensing Technology Institute, German Aerospace Center, Oberpfaffenhofen, Germany
Keywords:
Dense stereo matching, Cost function, Performance, Observation constrain.
Abstract:
In the last years, most dense stereo matching methods use evaluation on the Middlebury stereo vision bench-
mark datasets. Most recent stereo algorithms were designed to perform well on these close range stereo
datasets with relatively small baselines and good radiometric behaviour. In this paper, different matching costs
on the Semi-Global Matching algorithm are evaluated and compared using the common Middlebury datasets,
aerial and satellite datasets with ground truth. The experimental results show that the performance of dense
stereo methods for datasets with larger baselines and stronger radiometric changes relies on even more robust
matching costs. In addition, a novel matching cost based on mutual information and Census is introduced
showing the most robust performance on close range, aerial and satellite data.
1 INTRODUCTION
The performance of dense stereo matching methods
depends on all components, this includes prepro-
cessing, matching costs, aggregation, disparity opti-
mization and postprocessing steps. Most work on
dense stereo uses well known cost functions such
as absolute differences or Birchfied-Tomasi (Birch-
field and Tomasi, 1998), as these perform well on the
Middlebury datasets (Scharstein and Szeliski, 2002;
Scharstein and Szeliski, 2011). The most intuitive
cost assumes the consistency between intensities of
two corresponding pixels. Using different matching
costs, like Absolute Differences (AD), Mutual Infor-
mation (MI) (Viola and Wells, 1997; Chrastek and
Jan, 1997) or Census (Zabih and Woodfill, 1994) on
the same stereo matching method can generate very
different results (Hirschm
¨
uller and Scharstein, 2009;
Neilso and Yang, 2008).
Dense stereo algorithms are typically evaluated
with a small baseline configuration, artificial and
often ambient light sources. Radiometric changes
due to vignetting, gamma changes etc. were of-
ten simulated by modifying these small baseline im-
ages (Hirschm
¨
uller and Scharstein, 2009; Neilso and
Yang, 2008). These simulations do not capture all
effects such as non-lambertian reflectance. In the
evaluation of stereo matching costs using the Middle-
bury data (Hirschm
¨
uller and Scharstein, 2009): Cen-
sus shows the best and the most robust overall perfor-
mance. Mutual information performs very well with
global methods. On radiometrically distorted Mid-
dlebury datasets, and datasets with varying illumina-
tion, Census and Mutual Information outperform AD
clearly. But we are not aware of matching cost per-
formance evaluation for images with larger baselines
and remotely sensed images.
In this study, the Semi-Global Matching (SGM)
method (Hirschm
¨
uller, 2008) is selected as the stereo
algorithm for evaluating different matching costs be-
cause of its robustness, speed and accuracy. Four
matching costs are evaluated: a parametric match-
ing cost (AD), a non-parametric matching cost (Cen-
sus), a matching cost based on Mutual Information
(MI), and in addition, a new combined matching
cost MI-Census (MIC). In contrast to previous stud-
ies (Hirschm
¨
uller and Scharstein, 2009; Neilso and
Yang, 2008), we do not use synthetically modified
datasets for performance evaluation, but use the stan-
dard Middlebury datasets as examples for close range
datasets, and aerial and satellite images as examples
for datasets with large baselines and stronger radio-
metric differences.
We focus on a fundamental question in our work:
given a currently outperformed stereo method, how
important is the matching cost for stereo methods on
real data? We found that the performance of match-
ing costs on the Middlebury dataset cannot be extrap-
379
Zhu K., d’Angelo P. and Butenuth M..
EVALUATION OF STEREO MATCHING COSTS ON CLOSE RANGE, AERIAL AND SATELLITE IMAGES.
DOI: 10.5220/0003764203790385
In Proceedings of the 1st International Conference on Pattern Recognition Applications and Methods (PRARSHIA-2012), pages 379-385
ISBN: 978-989-8425-98-0
Copyright
c
2012 SCITEPRESS (Science and Technology Publications, Lda.)

olated to images with larger baselines and stronger
radiometric changes, and it strongly depends on the
matching cost function used. A novel matching cost,
linearly merged of MI and Census (MIC), shows the
most robust performance during increasing length of
baseline on real data.
The remainder of this paper is organized as fol-
lows: Section 2 describes the evaluated match-
ing costs and the basics of SGM. The experiments
on Middlebury datasets, airborne optical image se-
quences and satellite datasets are evaluated and com-
pared in Section 3. Conclusions and the future work
are presented in the last section.
2 MATCHING COSTS AND
SEMI-GLOBAL MATCHING
2.1 Matching Costs
Generally, the matching costs in this work are defined
on intensity, instead of color. Color channels are av-
eraged, if they are available. Three typical matching
costs are selected: a parametric matching cost (AD), a
non-parametric cost (Census) and a cost based on MI.
In addition, we combine linearly MI and Census with
different weights to build a new matching cost (MIC).
The simplest cost function is AD, which as-
sumes constant intensities for corresponding pixels
and, thus, lambertian reflectance and good radiomet-
ric calibration. In 1, I
L
(p) and I
R
(p,d) denote the in-
tensity of pixel p in the left image and the intensity
of its matched pixel at disparity d in the right image
separately:
C
AD
(p,d) =
|
I
L
(p) − I
R
(p − d)
|
(1)
In contrast to AD, Census is a non-parametric
cost. It is invariant to monotonic gray value changes
and thus can tolerate a large class of global and lo-
cal radiometric changes. It encodes the local image
structure within a transform window and defines a bit
string where each bit describes the relative ordering
between the computing pixel and its local neighbor.
A bit is set if a pixel inside the window has a lower
intensity than the center pixel. The distance between
two bit strings is computed using the Hamming dis-
tance. In our work, a 9 × 7 window is used and sup-
ports the matching costs in the range of 0 to 63. ξ
denotes a Census transform within a window W .
N
computes the Hamming distance:
C
Census
(p,d) =
O
(ξ
W
(p), ξ
W
(p − d)) (2)
For easier combination with other costs, we rescale
the matching costs into a range from 0 to 1023.
MI combines individual entropies H
l
, H
r
and the
joint entropy H
l,r
of a stereo pair. This enables reg-
istering of images with complex radiometric relation-
ships (Viola and Wells, 1997). In this paper, we use
the Hierarchical MI (HMI) for an efficient iterative
learning (Hirschm
¨
uller, 2008).
MI(p, d) = H(p) + H(p − d) − H(p, p − d) (3)
The mutual information cost is also rescaled to a
range from 0 to 1023.
Due to the fixed local support, the disparity im-
ages generated using Census show slightly blurred
object boundaries (Brockers, 2009). Hence, a new
matching cost in this paper is a merging of MI and
Census. This combination uses the advantages of both
costs: the intuitive consistency and the local structure,
linearly summated with different weights.
C
MIC
(p,d) = w
MI
×C
MI
(p,d)+
(1 − w
MI
)×C
Census
(p,d).
(4)
2.2 Semi-Global Matching
The Semi-Global Matching (SGM) method approxi-
mates a global, 2D smoothness constraint by combin-
ing many 1D constraints from different aggregation
directions for pixelwise matching. The global energy
for the disparity image is defined as E(D):
E(D) =
∑
P
(C(p,D
p
) +
∑
q∈N
p
P
1
D
p
− D
q
= 1
+
∑
q∈N
p
P
2
D
p
− D
q
> 1
.
(5)
The first term sums the costs of all pixels in the im-
age with their particular disparities D
p
. The next two
terms penalize the discontinuities with penalty factors
P
1
and P
2
, which differ in small or large disparity dif-
ference within a neighbourhood q of the pixel p. This
minimization approximation is realized by aggregat-
ing S(p,d) of path wise costs into a cost volume:
S(p,d) =
∑
r
L
r
(p,d). (6)
L
r
(p,d) in 6 represents the cost of pixel p with
disparity d along one direction r. It is described as
following:
L
r
(p,d) = C(p,d) + min(L
r
(p − r,d),
L
r
(p − r,d − 1) + P
1
,L
r
(p − r,d + 1) + P
1
,
min
i
L
r
(p − r,i) + P
2
) − min
i
L
r
(p − r,i).
(7)
This regularisation term function favores planar
and sloped surfaces, but still allows larger height
ICPRAM 2012 - International Conference on Pattern Recognition Applications and Methods
380
jumps in the direction of cost aggregation. The dispar-
ity at each pixel is selected as index of the minimum
cost from the cost cube. In addition, P
2
is adapted to
the local intensity gradient:
P
2
=
P
2
o
1 + |I(p) − I(p − 1)|/W
P
2
(8)
Here, W
P
2
is a parameter that controls the reduction of
the penalty.
3 EVALUATION
In this section, we test the four matching costs
with SGM on Middlebury images without radiometric
changes, on an aerial image sequence with increasing
length of the baseline and on satellite images repre-
senting different typical object classes. In addition,
we tuned the smoothness parameters of SGM for all
four costs in order to get the best performance. This
tuning allows concentrating on the performance of
matching costs rather than the stereo method. Dur-
ing the evaluation, all parameters are kept constant for
Middlebury images. For the airborne image sequence,
an 1.7 meter resolution LIDAR 3D point cloud is used
as the ground truth. A 3D point cloud acquired by the
Institut Cartogr
`
afic de Catalunya (ICC) with airborne
laser scanning is used as reference data for the satel-
lite data. The density of the point cloud is approxi-
mately 0.5 points per square meter. The data is part
of the ISPRS matching benchmark (Reinartz et al.,
2010).
3.1 Results on the Middlebury Stereo
Benchmark Datasets
We apply the evaluation using on the Middlebury
data. After the parameter tuning, our experimen-
tal results on the Middlebury data shown in Fig-
ure 1 are similar like the original implementa-
tions (Hirschm
¨
uller, 2008; Scharstein and Szeliski,
2011). Our post-processing steps are not tuned to the
Middlebury datasets and thus our results are slightly
worse results then the official SGM entry. The best
parameter combinations are P
1
= 16 and P
2
= 29 for
AD, P
1
= 432 and P
2
= 480 for Census and P
1
= 750
and P
2
= 1450 with a P
2
adaptive factor W
P
2
= 45 for
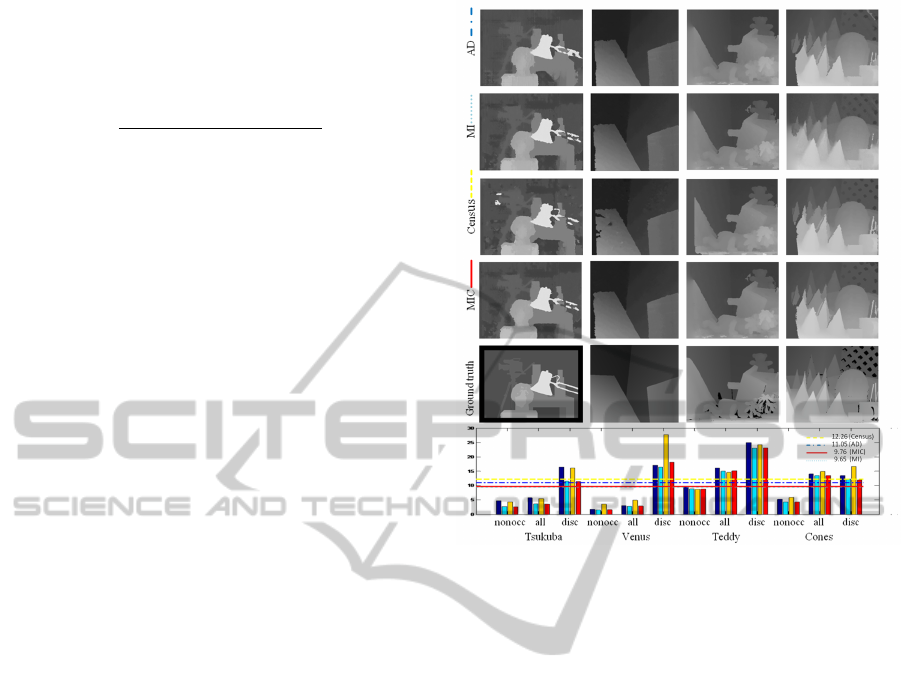
MI. Figure 1 shows the computed disparity images
and the ground truth. The disparity images generated
with AD have visually clean edges.
The specific error analysis is illustrated in Figure 1
bottom. The performance of MI is generally the best
for all four datasets with an average percentage of
bad pixels e=9.65 bei Error Threshold et = 1. Unlike
Figure 1: Results on the Middlebury Datasets for SGM with
varying matching costs. Top: Depth images obtained after
parameter tuning. Bottom: Bad pixel percentages for non
occluded pixels, all pixels and pixels near discontinuities.
in the previous study (Hirschm
¨
uller and Scharstein,
2009), the results using Census (e=12.67) are wore
then using AD (e=11.05), possibly due our basic post-
processing. We observed that the boundaries of AD
are cleaner compared to Census, because of the fixed
window size of Census. The MI reaches similar
but more accurate results as AD. On the Middlebury
datasets, MIC performs similar as MI with e = 9.76.
The bast parameters for MIC are P
1
= 750, P
2
= 1450
and W
P
2
= 50. The cost of MI has a weight of 0.9.
This combination is better as AD, worse as MI in our
study on the Middlebury data. But it outperforms the
other matching costs using aerial and satellite images
shown in the next subsection.
3.2 Results on Aerial Image Sequence
A continually recorded airborne optical image se-
quence is used to follow the impacts of matching costs
on the performance during a changing baseline and
stereo angles. The images are provided by the 3K
camera system, consisting of 3 Canon EOS 1D Mark
II cameras with a 50 mm lens (Kurz et al., 2007).
Only the nadir views are used in this evaluation. The
flight altitude is approximately 1500 meters above
ground. The distance between each recorded obser-
EVALUATION OF STEREO MATCHING COSTS ON CLOSE RANGE, AERIAL AND SATELLITE IMAGES
381
vation is about 35 meters. The largest baseline we
present in this work is about 250 meters.
Figure 5 visualizes the impact of larger baselines
on the matching performance clearly: although the re-
sults computed on images with small baselines per-
form well using all four matching costs, the errors of
AD rise quickly with increasing baseline and stereo
angle, possibly due to the non-lambertian reflectance.
Hierarchical MI (HMI) does perform slightly better
than AD for small baselines, and the disparities in the
street are smoother and show less noise, c.f. Figure 3.
For small baselines, Census does produce a noise dis-
parity map, but shows the most robust behaviour for
larger baselines, as visible on the church roof in Fig-
ure 5.
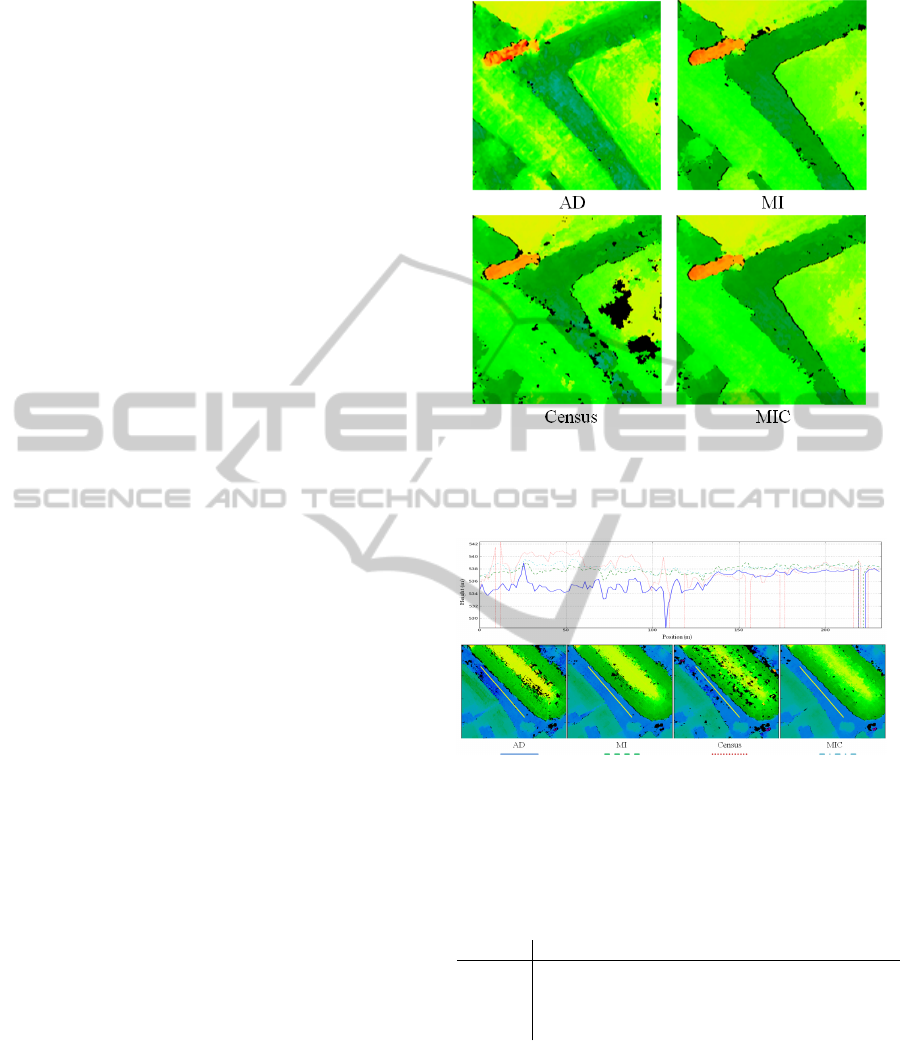
In addition, we observed that the results using MI
have sharper edges at discontinuities. In contrast, the
fixed local support of Census causes slightly blurred
edges. In Figure 2, the comparison on details between
disparity images using different matching costs are
shown. The smoothness on surfaces of the results us-
ing MI is generally better compared to AD and Cen-
sus. A visual analysis is illustrated in Figure 3.
Because of the advantages of MI for sharp edges
and smoothness on surfaces, and the robustness of
Census, we combine MI with Census to generate
matching the cost MIC. It performs similar to MI
at object discontinuities, but keeps the robustness of
Census for larger baselines.
3.3 Results on Satellite Data
We evaluated the matching costs on a Worldview-1
stereo image pair with a ground sampling distance
of 50 cm, and a relatively large stereo angle of 35
◦
.
The data is part of the ISPRS matching benchmark
(Reinartz et al., 2010). A small cutout of the stereo
data and the reconstruction results for an urban area
(Terrassa in Spain, Barcelona) are shown in Fig. 4.
The full dataset covers mountainous, agricultural, for-
est, industrial and residential areas. The figure indi-
cates that these images cannot be matched success-
fully using MI, while Census and the MIC perform
reasonably well on this challenging dataset. The large
black background in the MI image was incorrectly
filled using this data. Table 1 shows the results of
evaluating the city area shown in Fig. 4 and two other
test areas (hilly forest and industrial area) against the
LIDAR reference data. It is clearly visible that MIC
performs slightly better than Census and that MI does
produce the largest errors. Experiments with various
values for P
1
, P
2
and W
P
2
indicated that performance
depends mostly on the cost function and not on the
exact parametrisation of the stereo algorithm.
Figure 2: Comparison on details of disparity images using
different matching costs: MI and MIC show better object
boundaries and less noise. Different colour codifications
denote different disparities of corresponded pixels.
Figure 3: Comparison of smoothness for AD, MI, Census
and MIC results on a flat street. The diagram shows the
height values along the profile indicated by the yellow line.
Table 1: Evaluation of Matching results in three test areas
against ground truth LIDAR Data. NMAD is the normal-
ized median deviation and BP (Bad Pixels) is the percentage
of pixels with an absolute height error > 2 m.
Cost P
1
P
2
W
P
2
w
MI
NMAD BP(%)
MIC 700 1400 200 0.3 0.72 15.8
Census 600 1300 200 - 0.74 16.8
MI 700 1400 200 - 1.10 25.8
4 CONCLUSIONS AND FUTURE
WORK
In this work, three typical matching costs (AD,
MI and Census) and a novel matching cost (MIC)
are evaluated using SGM on the Middlebury stereo
ICPRAM 2012 - International Conference on Pattern Recognition Applications and Methods
382
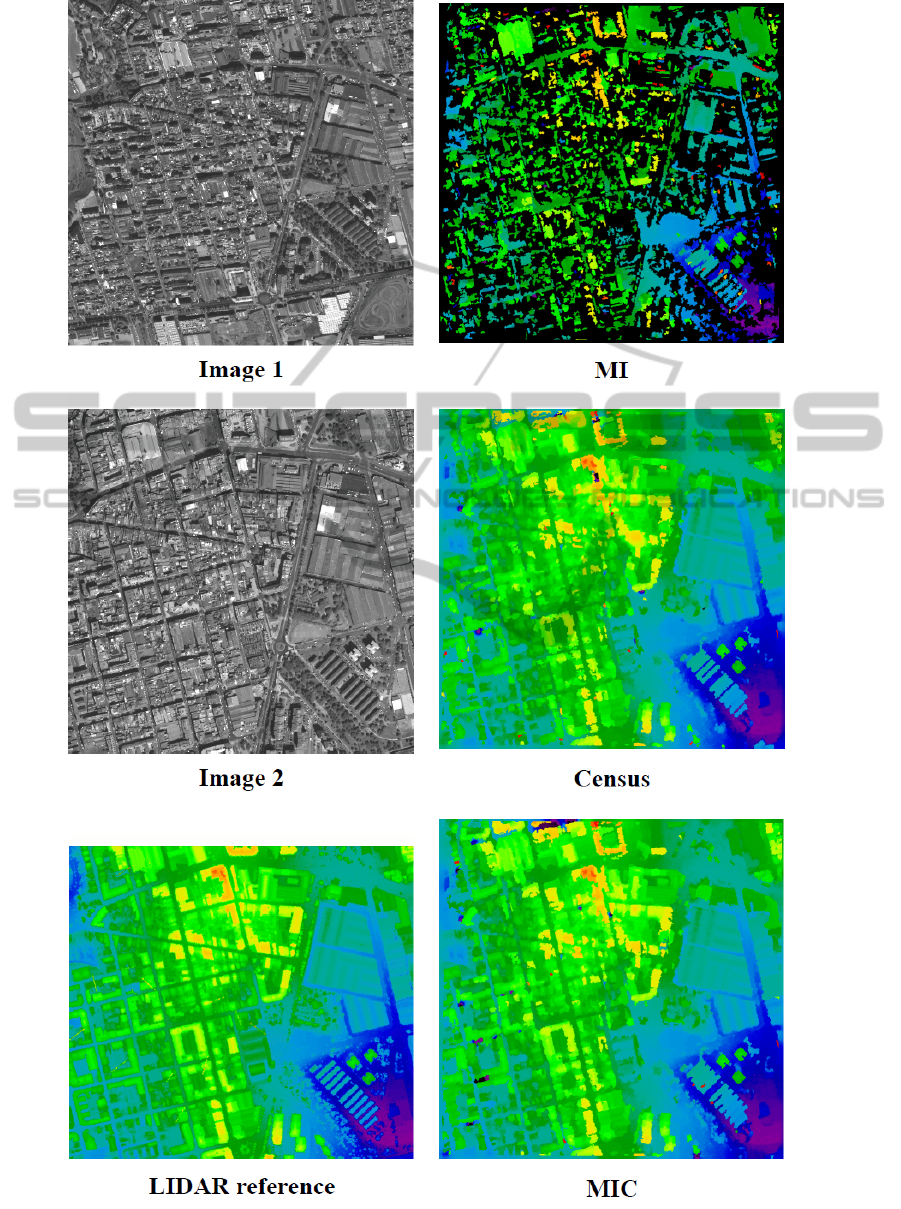
Figure 4: Small cutout of the Worldview-1 Stereo pair. First row: stereo pair and LIDAR reference data. Second row: Results
after stereo matching with different cost functions, orthographic reprojection and discontinuity preserving interpolation.
EVALUATION OF STEREO MATCHING COSTS ON CLOSE RANGE, AERIAL AND SATELLITE IMAGES
383
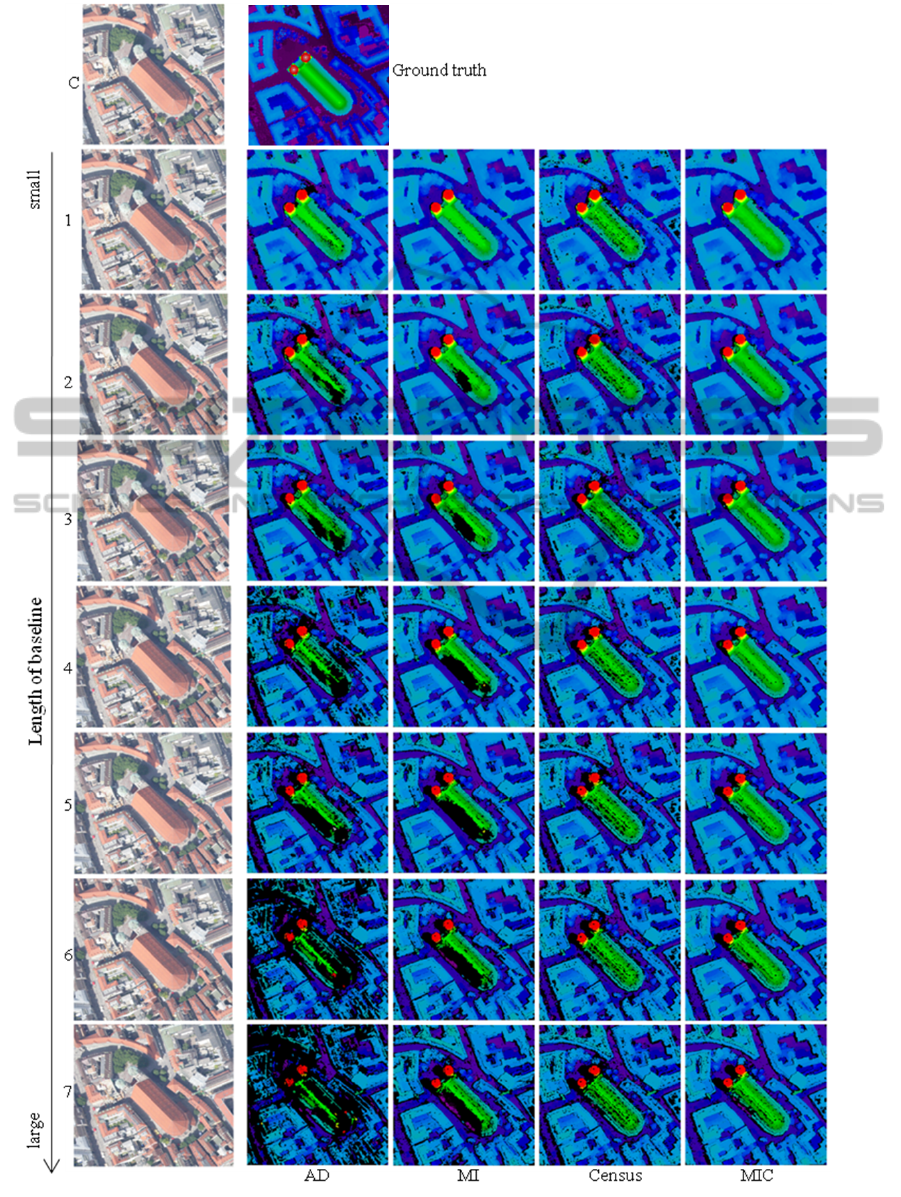
Figure 5: Disparity maps for stereo pairs with increasing baseline. The images 1 to 7 are matched with the centre image C.
The results for AD, MI, Census and MIC are shown in columns 2-5. The black areas indicate failures of the left-right check.
The ground truth DSM (Digital surface model) from laser scanning is shown next to the centre image.
ICPRAM 2012 - International Conference on Pattern Recognition Applications and Methods
384

benchmark, aerial and satellite images with ground
truth. In summary we found that the performance of
dense stereo methods for datasets with larger base-
lines and stronger radiometric changes strongly re-
lies on robust matching costs. The experimental re-
sults on different data sets show, AD works well for
scenes with a small baseline and a good radiometric
calibration. MI performs slightly better than Cen-
sus in case of low radiometric changes and stereo
pairs with small baselines, but fails in areas with local
radiometric changes. MI keeps sharp edges at dis-
continuities and results in less noisy disparity maps
when compared to Census. Census performs well
for larger baselines, but results in slightly blurred ob-
ject boundaries. For large baseline satellite stereo im-
agery Census performs significantly better than MI.
The weighted sum of MI and Census (MIC) unifies
the advantages of MI and Census and outperforms
AD, MI and Census on remote sensing datasets.
Topics for future work include developing a
methodology for evaluation of remotely sensed im-
ages against LIDAR ground truth. The main chal-
lenges for this task are changes due to multi-temporal
data acquisition and different resolution and be-
haviour of the sensors. The influence of different
stereo algorithms on the performance of the matching
cost functions will be evaluated in further work.
ACKNOWLEDGEMENTS
Special thanks are given to the data providers for the
provision of the stereo data namely: Digital Globe for
the Worldview-1 data and ICC Catalunya for the ref-
erence data.
REFERENCES
Birchfield, S. and Tomasi, C. (1998). A pixel dissimilarity
measure that is insensitive to image sampling. IEEE
Transactions on Pattern Analysis and Machine Intel-
ligence, 20(4):401–406.
Brockers, R. (2009). Cooperative stereo matching with
color-based adaptive local support. Computer Anal-
ysis of Images and Patterns.
Chrastek, R. and Jan, J. (1997). Mutual information as a
matching criterion for stereo pairs of images. Analysis
of Biomedical Signals and Images, 14:101–103.
Hirschm
¨
uller, H. (2008). Stereo processing by semi-global
matching and mutual information. IEEE Transac-
tions on Pattern Analysis and Machine Intelligence,
30(2):328–341.
Hirschm
¨
uller, H. and Scharstein, D. (2009). Evaluation of
stereo matching costs on image with radiometric dif-
ferences. IEEE Transactions on Pattern Analysis and
Machine Intelligence, 31(9):1582–1599.
Kurz, F., M
¨
uller, R., Stephani, M., Reinartz, P., and
Schroeder, M. (2007). Calibration of a wide-angle
digital camera system for near real time scenarios.
ISPRS Workshop High Resolution Earth Imaging for
Geospatial Information.
Neilso, D. and Yang, Y. (2008). Evaluation of constructable
match cost measures for stereo correspondence using
cluster ranking. IEEE Conference on Computer Vi-
sion and Pattern Recognition.
Reinartz, P., d’Angelo, P., Krauß, T., Poli, D., Jacobsen, K.,
and Buyuksalih, G. (2010). Benchmarking and qual-
ity analysis of dem generated from high and very high
resolution optical stereo satellite data. ISPRS Sympo-
sium Commission I.
Scharstein, D. and Szeliski, R. (2002). A taxonomy and
evaluation of dense two-frame stereo correspondence
algorithms. International Journal of Computer Vision,
47(1):7–42.
Scharstein, D. and Szeliski, R. (2011). Middlebury stereo
vision research page. http://vision.middlebury.edu/
stereo/.
Viola, P. and Wells, W. M. (1997). Alignment by maximiza-
tion of mutual information. International Journal of
Computer Vision, 24(2):137–154.
Zabih, R. and Woodfill, J. (1994). Non-parametric local
transforms for computing visual correspondancen. In
Proc. European Conference of Computer Vision.
EVALUATION OF STEREO MATCHING COSTS ON CLOSE RANGE, AERIAL AND SATELLITE IMAGES
385
