
INDOOR EVALUATION OF CROP ROW AND GRID DETECTION
System for an Automated Transplanter
J. Reumers
1
, F. De Smedt
2
, J. Anthonis
1
, H. Ramon
1
and T. Goedem
´
e
2
1
Department for Agro-Engineering and Economics, K.U. Leuven, Kasteelpark 30, 3001 Leuven, Belgium
2
EAVISE, Lessius Mechelen, Association K.U.Leuven, De Nayerlaan 5, 2860 Sint-Katelijne-Waver, Belgium
Keywords:
Agriculture, Crop detection, Vehicle guidance, Transplanter.
Abstract:
If crops with considerable spacing can be arranged in a precise rectangular pattern, mechanical weeding can
become an alternative to chemical methods by enabling treatment in two perpendicular directions. Realisation
of such a pattern requires innovation of seedling transplanters. A computer vision-based sensing system was
developed for detecting a transplanters posture relative to the crop. A method for indoor evaluation of the
systems accuracy is proposed, using an experimental cart on a set of rails to control the vehicle’s posture. The
method was successful in evaluating the estimates of the lateral offset and the heading angle, but the reliability
of the validation values for the longitudinal distance is limited. Tests results showed that the maximum error
on the measurements of the lateral offset is 1.5cm and that the standard deviation is smaller than 0.6cm. The
maximum error on the angle measurements is 2.1
◦
. The standard deviation of the error is smaller than 0.65
◦
.
The standard deviation of the error on the estimates of the longitudinal distance is typically 0.7cm.
1 INTRODUCTION
An integrated approach could promote mechanical
weed control to become an efficient, adequate alter-
native to traditional chemical treatment in crops with
considerable spacing. If the crop can be arranged in a
regular rectangular planting pattern, the applicability,
working rate and effectiveness of inter-row weeding
increases and mechanical treatment becomes possi-
ble in a second, perpendicular direction. This would
circumvent the problem of weed removal in the rows
and would considerably increase the percentage area
treated (Schoenfish and Billingsley, 1993),(Søgaard
and Olsen, 2003). Arrangement of the crop according
to a precise rectangular grid is currently not possible.
In (Reumers et al., 2005a) a vision-based sensing sys-
tem for an automated seedling transplanter was pre-
sented. This crop detection system provides the pos-
ture information (two-dimensional position and ori-
entation relative to the crop) required to control the
transplanter for realisation of regular grid pattern. It
might also be applied in early growth stages for guid-
ance of mechanical weeders to improve the qual-
ity and working rate of the treatment. Automation
of transplanting and weeding will improve operator
comfort as well, by relieving him from the repetitive
and tiring low-level tasks, enabling him to concentrate
on supervising functions, multitasking, the working
performance of the implement and machine safety.
Plant specific treatment in early stages of crop devel-
opment is another possible application domain (Tillet
et al., 2002).
The computer vision system measures three pa-
rameters that define the posture of the vehicle or im-
plement: the heading angle relative to the crop rows,
the lateral offset O relative to the crop row next to the
vehicle and the distance N along the driving direction
to the next plant position. (Reumers et al., 2005b)
conducted outdoor trials of the system. It was capa-
ble of detecting and tracking the crop grid under real
field conditions with natural illumination, but the ac-
curacy of measurements could be evaluated only for
the lateral offset. In this paper an indoor evaluation
procedure is presented and test results are analysed.
2 METHODOLOGY
2.1 Vision System Hardware
A commercially available RGB/CIR camera was se-
lected (DuncanTech MS-2150). This 3 CCD camera
acquires images consisting of 4 colour planes: NIR
(768-832 nm), red (640-680 nm), green (520-560 nm)
and blue (438-482 nm).
559
Reumers J., Smedt F., Anthonis J., Ramon H. and Goedemé T. (2012).
INDOOR EVALUATION OF CROP ROWAND GRID DETECTION - System for an Automated Transplanter.
In Proceedings of the 1st International Conference on Pattern Recognition Applications and Methods, pages 559-563
DOI: 10.5220/0003764505590563
Copyright
c
SciTePress

A spatial calibration method was reported in
(Reumers et al., 2005b) is used for the construction
of a transformation table for fast conversion of image
coordinates to real world coordinates. The displace-
ment between successive images is used to accelerate
the image processing algorithms and to provide more
robustness to illumination variations and to weeds.
2.2 Crop Detection Program
The crop detection system we propose is robust to
a wide range of natural conditions, highly variable
in intensity and spectral content, both over time and
space. A large range of soil and crop types (both
green and non-green) can be dealt with. Soil cover-
age by the seedlings is very small upon transplanting,
sometimes less than 1%. In horicultural applications,
the space between plants can be large, which forms
an extra objective (Southall, 1999). The image anal-
ysis algorithms are developed specifically to exploit
the contextual information of this situation.
The main features of the image-processing loop
are segmentation, line or grid fitting and determina-
tion of search region positions. The segmentation is
based on the normalised difference vegetation index
(De Smedt et al., 2011). This technique combines the
red and near-infrared information. Over monochrome
NIR images, the use of the NDVI offers the advantage
of much higher robustness to changes in illumination
intensity. The use of automatic thresholding is suffer-
ing from the low percentage of soil coverage by the
crop. Therefor at program initiation, a fixed empirical
threshold level is used. Once sufficient plants are de-
tected, search regions are constructed. The increased
soil coverage inside the search regions allows the use
of automatic thresholding. This unique approach in-
troduces exceptional robustness to changes in illumi-
nation intensity and even spectral content.
The plants within the field of view should not
touch or overlap each other and the size of the weeds
close to the crop must be smaller than the size of the
crop for a correct segmentation. Upon transplanting
of seedlings and during early crop development stages
these conditions are met.
Plant positions in a new image are predicted based
on their previous position and vehicle displacement.
The predicted positions determine the search regions
locations. New search regions are defined at the lo-
cation where new plants will enter the side of view.
This approach prevents the need to process the entire
image and analyse only the relevant information.
In the binary image resulting from the segmenta-
tion step, individual plants are identified based on size
and position. The plant centres are chosen to repre-
sent plant positions. The detected plant positions are
used to fit lines marking crop row positions. Both a
line fit method and a grid fit method are implemented,
based on least squares to minimise the distance be-
tween the fitted line/grid and the plant positions.
The line method fits a line for each row separately
and then integrates this information by the calculation
of parameter averages, weighed according to the num-
ber of plants in each row. The equations of the fitted
lines allow the calculation of the desired output values
O, θ and N. The grid fit technique increases robust-
ness and accuracy by integrating all two-dimensional
information of plant positions in a single optimisa-
tion. Still it is possible to perform a trade-off between
the accuracy importance of the longitudinal rows and
the accuracy importance of the lateral rows. The grid
fit method needs to be initialised by a previous grid
position estimate, which can be provided by the line
fit method. Note that both fit methods are performed
in the real world coordinate system. Some of the out-
put signals show high frequency noise, probably due
to camera vibrations and the nature of the application.
This can be solved by the use of a low-pass filter.
2.3 Indoor Evaluation Tests
For our experiments, we use a setup of two rails (18m)
on which an experimental vehicle is able to ride. In
between these rails soil was spread and two rows of
lettuce were planted (32 plants), according to a rect-
angular grid. This setup allows a very accurate valida-
tion of the measurement data. Two different camera
mountings where applied on the vehicle (figure 1).
During a test the vehicle was pushed manually
in order to move the vision system along the crop
rows. All experiments were conducted at four dif-
ferent driving speeds named slow (0.4 to 0.5m/s),
medium (0.7 to 1.0m/s), fast (1.3 to 1.6m/s) and very
fast (2.1 to 2.3m/s). To prevent motion blur, six halo-
gen lights (500W) where used to decrease integration
time. These are mounted on the vehicle.
To obtain validation data, the following proce-
dures were followed. Since the orientation of the cam-
era relative to the rails, and hence relative to the crop
rows, is constant during a test, the validation value of
the heading angle θ is constant for a certain camera
mounting as well. Moreover, both the crop rows and
the calibration pattern are placed parallel to the rails.
Consequently the validation value of the heading an-
gle θ is equal to 0, as during spatial calibration the
coordinate system is defined parallel to the pattern.
Note that the camera need not be aligned with the
rails. This is a big advantage, since perfect alignment
is hard to achieve. The point of interest for which
ICPRAM 2012 - International Conference on Pattern Recognition Applications and Methods
560
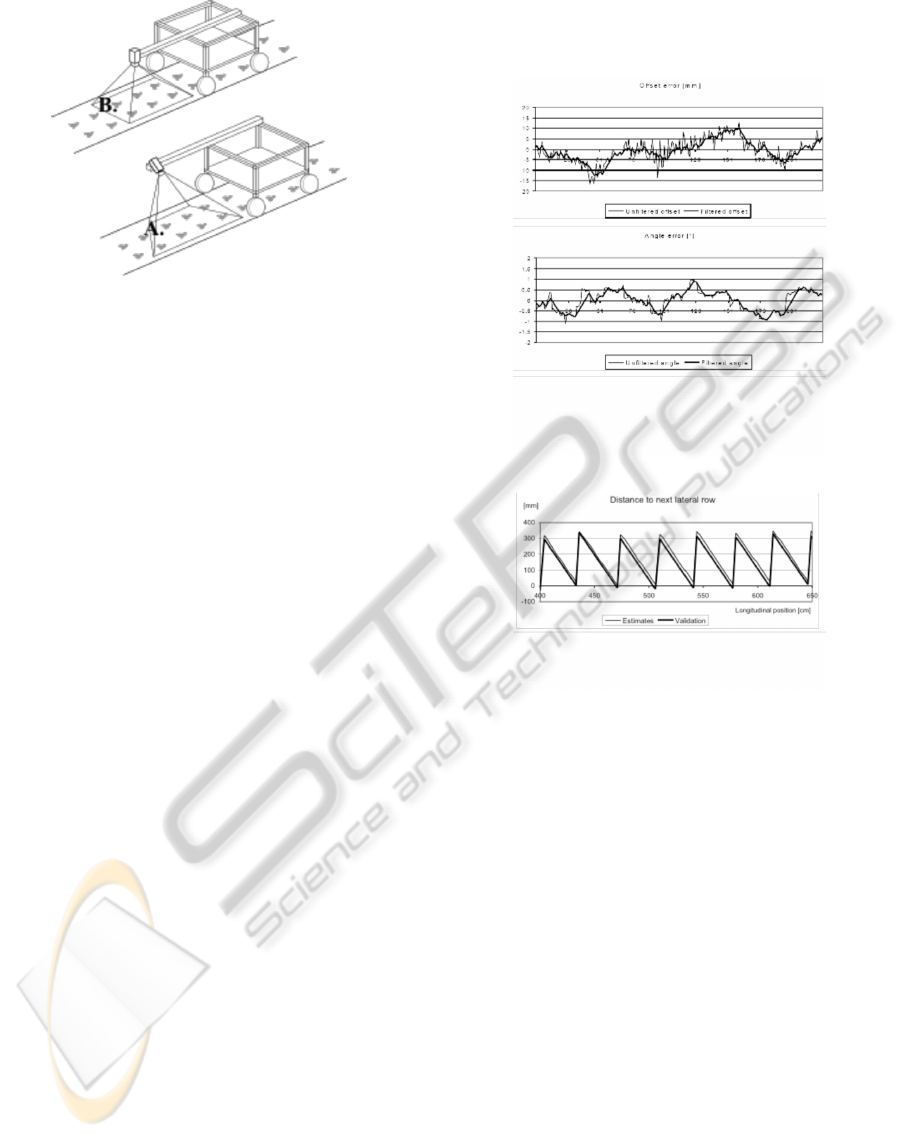
Figure 1: Camera mountings: A. Vertical, B. Sidewards.
the posture estimates are calculated was chosen to be
the centre of the field of view (the point of projec-
tion of the optical axis of the camera). The validation
value of the lateral offset O of the camera is a con-
stant for a certain mounting as well. It is the distance
between the centre of the field of view and the longi-
tudinal reference crop row. This distance is equal to
the difference between the measured distances of the
centre of the field of view and the reference row, both
relative to the left rail. As the validation values for
O and θ are constants, problems with linking or syn-
chronisation of measurements and validation data are
not an issue. For validation purposes, the longitudinal
position of the vehicle is measured using an optical
sensor. This sensor measures the distance from the
starting point based a strip of paper on the floor with
alternating black and white stripes. The accuracy of
the position measurement is 1cm. The system proved
to be very reliable.
Relative to the same starting point, the longitudi-
nal positions of the plants were measured manually,
using the strip with black and white stripes as a ruler.
For evaluation, each of the distances N to the next
lateral row computed by the crop detection program
was logged together with corresponding counter val-
ues. These counter values are read prior to locking the
most recent frame for processing. During a validation
test, the vehicle is driven across the rails. Starting
from the first black line on the paper strip, the counter
starts monitoring the longitudinal position of the ve-
hicle. For each processed image the longitudinal po-
sition measured by the optical sensor and the posture
parameters calculated by the vision system are saved
to a log file. Validation can be done by comparing the
calculated and measured values.
3 RESULTS AND DISCUSSION
The accuracies of O, N and θ were analysed for a side-
ways camera moved at medium speed.Figure 2 shows
the results from the comparison of the crop detection
estimate to the validation data.
Figure 2: Sample of the course of the unfiltered and filtered
offset error (above) and the angle error (below) as a func-
tion of the number of images processed (sidewards camera
mounting, grid fit method, medium speed).
Figure 3: Comparison of the estimated distance to the next
lateral row N and the corresponding validation values as
a function of the longitudinal position (sidewards camera
mounting,grid fit method, medium speed).
Figure 3 compares the estimated distances to the
next lateral row N to their corresponding validation
values. The estimates are shifted to the right due to a
potential systematic error of the system and the time
delay between acquisition of the validation data and
the corresponding images.
The statistics of the errors on estimates of O and
θ are given in table 1 and table 3. We will present
the results for filtered values obtained by the grid fit
method, since these gives the best results. The given
results for N are taken on unfiltered data.
Table 1 present the statistics of the filtered off-
set estimates. Both the standard deviation and the
maximum error are considerably smaller than those of
the unfiltered data. The systematic deviations remain
generally unchanged. There is no clear influence of
camera mounting.
The accuracy of the angle measurements can be
judged with the help of table 3. We can observe that
the influence of the driving speed is minimal. Side-
wards camera mounting is slightly better than verti-
cal mounting using the grid fit method. Table 2 sum-
INDOOR EVALUATION OF CROP ROWAND GRID DETECTION - System for an Automated Transplanter
561
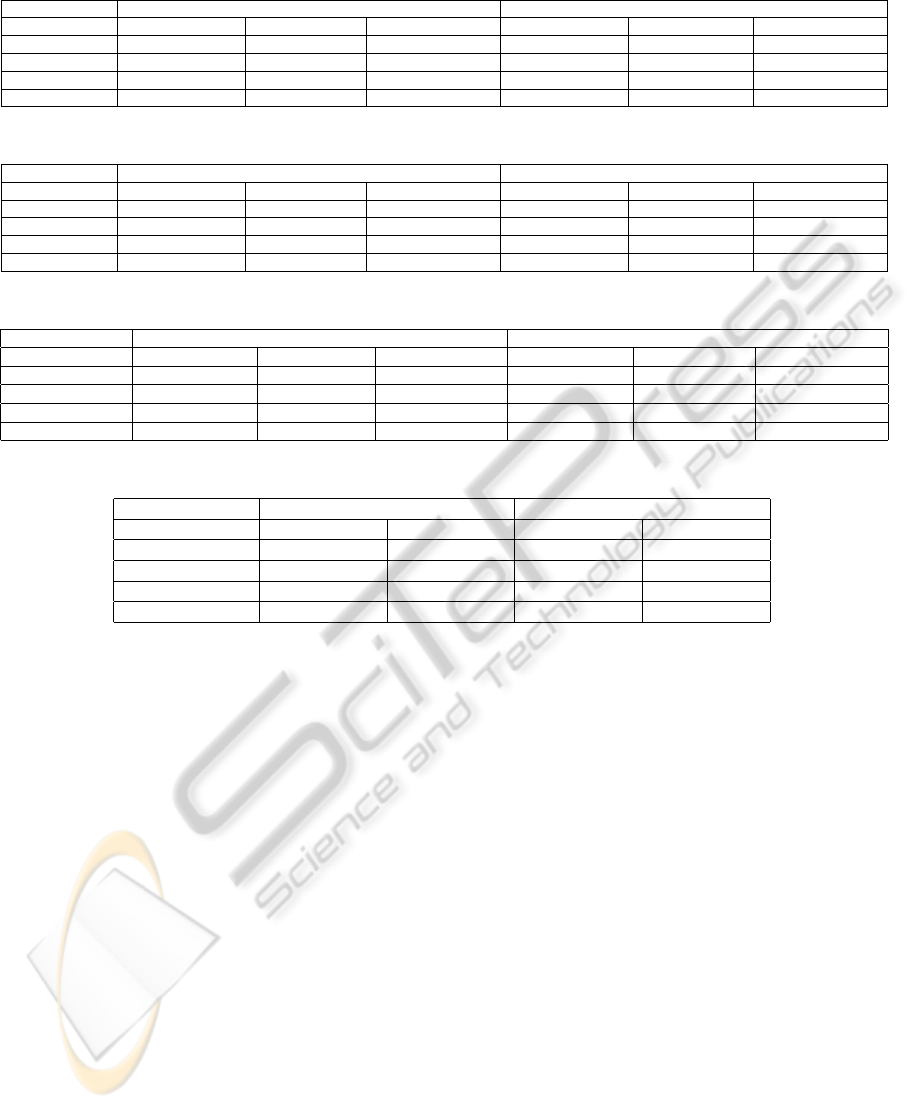
Table 1: Offset, grid method, filtered data.
Camera mounting Vertical Sidewards
Driving speed Average error [mm] St. Devation [mm] Max Abs error [mm] Average error [mm] St. Deviation [mm] Max abs. error [mm]
Slow 8.5 10.9 40.0 17.9 7.2 37.5
Medium 21.7 10.2 51.6 23.2 7.3 51.4
Fast 38.0 10.0 65.5 48.7 7.1 68.6
Very fast 58.4 14.6 95.3 72.9 11.3 101.6
Table 2: Distance to next lateral row, grid fit method.
Camera mounting Vertical Sidewards
Driving speed Average error [mm] St. Devation [mm] Max Abs error [mm] Average error [mm] St. Deviation [mm] Max abs. error [mm]
Slow -0.42 0.65 2.11 -0.19 0.56 1.58
Medium -0.38 0.63 1.85 -0.21 0.52 1.49
Fast -0.39 0.52 1.54 -0.22 0.45 1.08
Very fast -0.26 0.61 1.28 -0.15 0.39 0.93
Table 3: Angle, grid fit method, filtered data.
Camera mounting Vertical Sidewards
Driving speed Average error [
◦
] St. Devation [
◦
] Max Abs error [
◦
] Average error [
◦
] St. Deviation [
◦
] Max abs. error [
◦
]
Slow -4.3 5.3 14.4 -2.8 5.8 15.2
Medium -3.5 5.0 14.8 -2.4 5.5 14.6
Fast -3.2 4.4 12.8 -2.5 4.6 13.0
Very fast -2.1 3.2 8.4 0.5 4.4 9.9
Table 4: Compensated maximum errors on the distance to the next lateral row[mm].
Camera mounting Vertical Sidewards
Driving speed Grid fit method Line fit method Grid fit method Line fit method
Slow 31.5 31.3 24.2 25.9
Medium 3.4 34.3 24.8 20.8
Fast 27.5 31.7 20.8 18.9
Very fast 36.9 39.8 28.7 27.4
marise the results of the distance estimates N to the
next lateral row. The systematic deviations and maxi-
mum errors are considerably increasing with increas-
ing driving speed. This is due to the lack of synchro-
nisation of the acquisition of images and the retrieval
of counter values. This can lead to a difference up
to 10cm between the measured position by the opti-
cal sensor and the real position. This combined with
the absence of a real-time operating system can lead
to very big errors. These extreme outliers have been
removed for the calculation of the statistics.
As the experimental vehicle was driven manually,
speed was never constant during a test. Especially at
the highest speed a large part of the posture estimates
are generated while accelerating or braking. Conse-
quently, the difference between validation value and
real position at the moment of image acquisition is not
constant during execution of a test. This increases the
standard deviations, as can be seen in table 2. With
proper synchronisation these will be smaller. The
systematic deviations will be eliminated for the most
part. This can be simulated by compensating the max-
imum errors for the systematic deviation. This is done
by subtracting the average errors from the maximum
errors. The compensated maximum errors (table 4)
are considerably smaller than the non-compensated
values.
4 CONCLUSIONS
A vision-based posture system has been developed for
the detection of crop row and grid detection, which
can be used for many applications. We proposed a
line fit method and a grid fit method. We evaluated
these on a indoor setup at different speeds. During
the evaluation tests the system never lost track of the
crop pattern. We observed better results from the use
of the grid fit method, while no performance differ-
ence is observed. This indicates the higher stability
and inherent accuracy of the grid fit method. The
(unfiltered) estimates of the longitudinal distance of
both methods are equivalent. The influences of cam-
era mounting and vehicle speed on system accuracy
were not clear.
The posture measurements by the vision system
are sufficiently accurate in general, especially when
the grid fit method is applied and the output signals
are filtered. The use of a real-time operating system
and decent synchronisation might probably reduce the
ICPRAM 2012 - International Conference on Pattern Recognition Applications and Methods
562

maximum error to less than 2.5cm to improve the re-
sults even more.
ACKNOWLEDGEMENTS
This research was funded by the Institute for the Pro-
motion of Innovation through Science and Technol-
ogy in Flanders (IWT Vlaanderen), N.V. Agriplant
and the Interuniversity Attraction Poles Programme
Belgian Science Policy. Jan Anthonis is funded as a
Post-doctoral Fellow by the Fund for Scientific Re-
search Flanders (Belgium) (FWO Vlaanderen).
REFERENCES
De Smedt, F., Billiauws, I., and Goedeme, T. (2011). Neural
networks and low-cost optical filters for plant segmen-
tation. In International Journal of Computer Informa-
tion Systems and Industrial Management Applications
(IJCISIM), volume 3/4.
Reumers, J., Anthonis, J., Bruyninckx, H., and Ramon, H.
(2005a). Detection of crop rows with low soil cover-
age using computer vision. In Computers and elec-
tronics in agriculture.
Reumers, J., Anthonis, J., Van Gool, L., and Ramon, H.
(2005b). llumination independent tracking of individ-
ual plants with low soil coverage using computer vi-
sion. In Computers and electronics in agriculture.
Schoenfish, M. and Billingsley, J. (1993). A comparison
of automated guidance systems for a variety of opera-
tions in the growing of cotton. In Proceedings inter-
national advanced robotics programme 3rd workshop
on robotics in agriculture and the food industry, pages
8–16.
Søgaard, H. and Olsen, H. (2003). Determination of crop
rows by image analysis without segmentation. In
Computers and electronics in agriculture, volume 38,
pages 141–158.
Southall, J. (1999). The development and evaluation of
computer vision algorithms for the control of an au-
tonomous horticultural vehicle. PhD thesis, Univer-
sity of London.
Tillet, N., Hague, T., and Miles, S. (2002). Inter-row vi-
sion guidance for mechanical weed control in sugar
beet. In Computers and electronics in agriculture, vol-
ume 33, pages 163–177.
INDOOR EVALUATION OF CROP ROWAND GRID DETECTION - System for an Automated Transplanter
563
