
GIS-SAPIO
Automated Aedes Aegypti Web-based Analysis and Prevention Monitor
Georges D. A. Nze
1
, Lourdes M. Brasil
1
, Josiane S. A. Souza
1
and Marco A. B. Rodrigues
2
1
Engineering and Innovation Laboratory, University of Brasilia – UnB/FGA, Gama, Brazil
2
Biomedical Engineering Course, Federal University of Pernanbuco - UFPE, Recife, Brazil
Keywords: Dengue, Public health, GIS-SAPIO, Aedes aegypti, Web.
Abstract: This work proposes the creation of a fully automated and dynamic web platform to analyze and prevent the
Aedes aegypti mosquito's proliferation in Brazil. The Web Based Geographic Information System for
SAPIO (GIS-SAPIO) is part of a project denominated: System Acquisition and Image Processing Ovitraps
(SAPIO) for obtaining and processing ovitraps – traps where the mosquito’s eggs are deposited – and
algorithms are used for the automation of eggs counting. The data obtained from image processing is
processed thru an automated script and sent to SAPIO´s database, and finally displayed on a web platform.
This technique should help for monitoring and prevent Dengue overall Brazil dynamically.
1 INTRODUCTION
Aedes aegypti mosquito’s proliferation is increasing
all over Brazil. A large amount of cases having the
disease spread by the mosquito (known as dengue
fever) has been reported by the Brazilian Health
Ministry and to revert present scenario, efforts are
been made to prevent and control in old fashion, the
proliferation of dengue (Ministério da Saúde, 2010).
This old fashion prevention aims to report, door
to door, the implication of having containers that
could retain water for a long period of time, and
being a vector for the mosquito to lay its eggs in it.
Nonetheless, this prevention technique is useless
because not all citizens really understand the
problems that could imply in having stagnant water
containers at or near their houses, even being really
small quantities of water in any kind of recipient.
The Brazilian Health Ministry is doing a great
effort for the publication of online and printed
document that shows how citizens should protect
their surroundings from this mosquito on a daily
basis but the proliferation scenario is still maintained
since 2007 (Dengue, 2011).
In recent work, different Web-based application
proposals using relational database and analysis
(Sucaet, 2008) for monitoring the mosquito
population has been presented but do not treat the
current effect of dengue proliferation. Other Web-
based application for climate information resources
for Malaria control is proposed in (Emily, 2006) but
their main purpose is to reveal current precipitation,
temperature, relative humidity or general climate
conditions suitable for Malaria transmission and
nothing about the proliferation of the disease
dynamically with substantial data.
In (Dengue, 2011) is presented a public health
platform based on web application to follow the
proliferation of Dengue. Their proposal isn’t based
on real time data base acquisition but on stored data
from previous event collected in old fashion. Some
data as shown in Table 2 lack of data from previous
years and there is no explanation about it.
All these works demonstrate that it is a great deal
of using geographical and database processing
principles, and this work being part of the SAPIO
project propose another but simple and efficient free
Web-based application to monitor and analyze the
proliferation of dengue dynamically. The use of
Geographic Information System (GIS) is of great
interest because of collecting, storing, analyzing and
integrating it with different kind of database (Sucaet,
2008). This database is to be maintained by statistics
data collected by human health expert, thru GPS,
and automatic data processing. Doing so would be
easier to deployed general information of the virus
proliferation in a daily based technique for all kind
of users: government to general society.
366
D. A. Nze G., M. Brasil L., S. A. Souza J. and A. B. Rodrigues M..
GIS-SAPIO - Automated Aedes Aegypti Web-based Analysis and Prevention Monitor.
DOI: 10.5220/0003765803660369
In Proceedings of the International Conference on Health Informatics (HEALTHINF-2012), pages 366-369
ISBN: 978-989-8425-88-1
Copyright
c
2012 SCITEPRESS (Science and Technology Publications, Lda.)
2 METHODS
The methods herein explained are part of SAPIO´s
Public health research group. This project is divided
in two actions: (1) Putting ovitraps in region having
a dense concentration of dengue, and counting the
amount of eggs using System Acquisition and Image
Processing techniques (Mello, 2008) and (
Andrade,
2010); (2) Mapping the results on a website to show
the mosquito’s proliferation statistic as to prepare
the government and society in taking proper actions
in real time (Amvame, 2011).
2.1 Trapping Technique
Plastic buckets are filled of stained water with a
wood slide on the edge, Figure 1. This bucket and
slide (ovitrap) is currently used as a trap for the
mosquito. A smell from the wood slide is used to
attract the Aedes aegypti into the trap and lay the
larva on it: this is the ovitrap technique.
2.2 Counting Technique
A human health specialist collects the wood slides
and manually counts the eggs deposited by the
mosquito. The first part of this project, automates
using a special algorithm the eggs counting by
image processing techniques, and compares it with
the manual technique, Figure 1. All counting are
saved with respect to their localization.
2.3 Data Acquisition and Database
The resulting data collection obtained from the
Counting Technique, Table 1, goes thru SAPIO´s
XML script for correct translation of data into a free
relational database, Figure 1. The database is
dynamically maintained, using a 5 second refresh
time rate, as data comes from image processing.
Table 1: Example of Pernanbuco´s reported infection
cases from 2000 to 2004.
State
UF
ReportedInfectionCases
Pernanbuco00 01 02 03 04
AFLITOS PE 10 28 43 0 0
AFOGADOS PE 8 8 39 0 0
AGUAFRIA PE 51 63 591 14 22
ALTODO
MANDU
PE 132 81 468 7 19
ALTOJOSE
BONIFIACIO
PE 5 2 181 1 3
2.4 Web-based Monitoring
After data acquisition, Table 2, a web-based is use to
show mapping and statistic information collected
from the first stage as shown in Figure 1. Google
Maps (Google, 2010) API are used to support
current implementation and phpMyAdmin
(PhpMyAdmin, 2010) is used for database
acquisition.
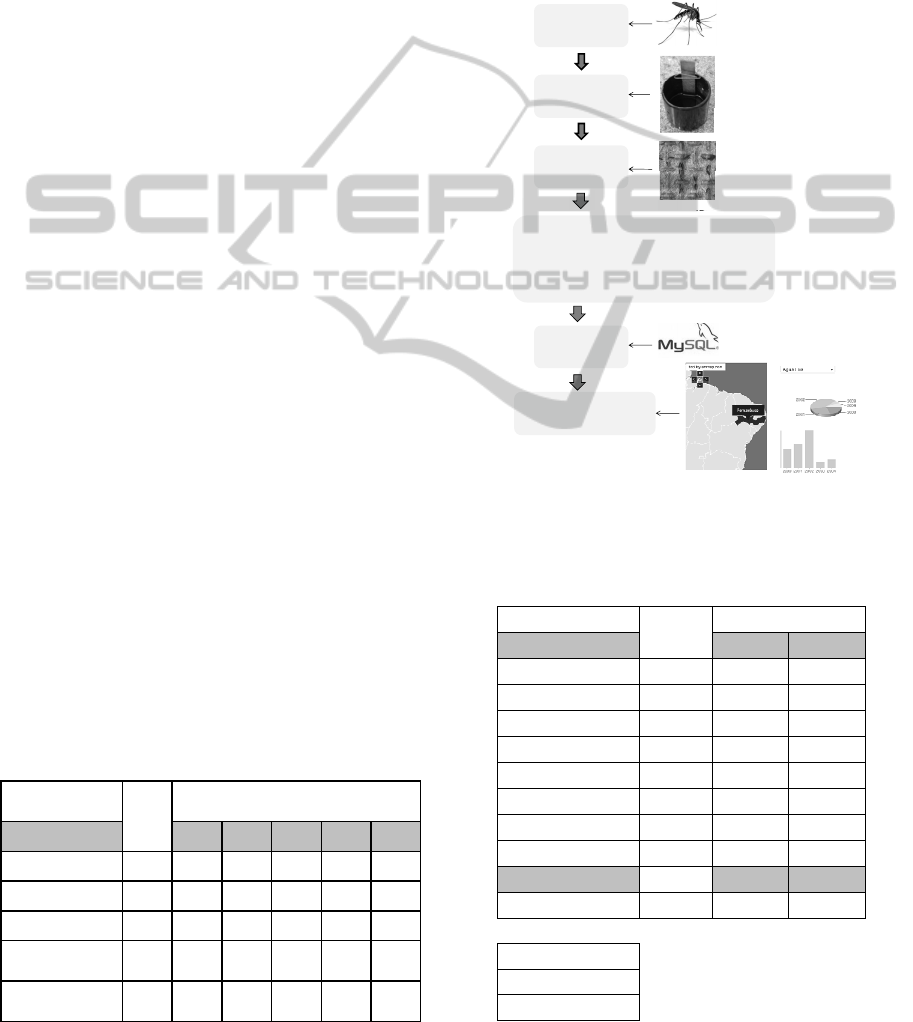
Figure 1: Diagram showing the methodology leading from
egg counting to web-based monitoring.
Table 2: Infection incidence related to Pernanbuco and
Brasília from 2009 to 2010.
StateorTerritory UF InfectionIncidence
Pernanbuco 2009 2010
IGARASSU PE ‐ noinfo.
GARANHUNS PE 2.1 2.3
ITAPISSUMA PE ‐ 0.8
FLORESTA PE ‐ 5.7
OLINDA PE 1.3 1.1
OURICURI PE ‐ 7.2
PETROLINA PE 0.8 0.9
RECIFE PE 1.6 1.9
DistritoFederal 2009 2010
BRASÍLIA DF 1.7 0.6
Satisfactory <1.0%
Alert 1.0%‐3.9%
Epidemyrisk >3.9%
Dataare stored
intoaDatabase
Eggsare counted
byimage
processing
Themosquitolay
theeggsintothe
ovitrap
Aedesaegypti
carryingdengue’s
virus
Awebserver retrievesthe
statisticsfromthedatabase
andputitonlinefor analysis
While(true)
xmlSAPIO =[DBname_root,'.xml'];
Listen Ovitrapsdata;
xmlwrite(xmlSAPIO,docNode);
Map XMLtoSQL=edit(xmlSAPIO);
SIG‐SAPIODBread =SQLread;
GIS-SAPIO - Automated Aedes Aegypti Web-based Analysis and Prevention Monitor
367
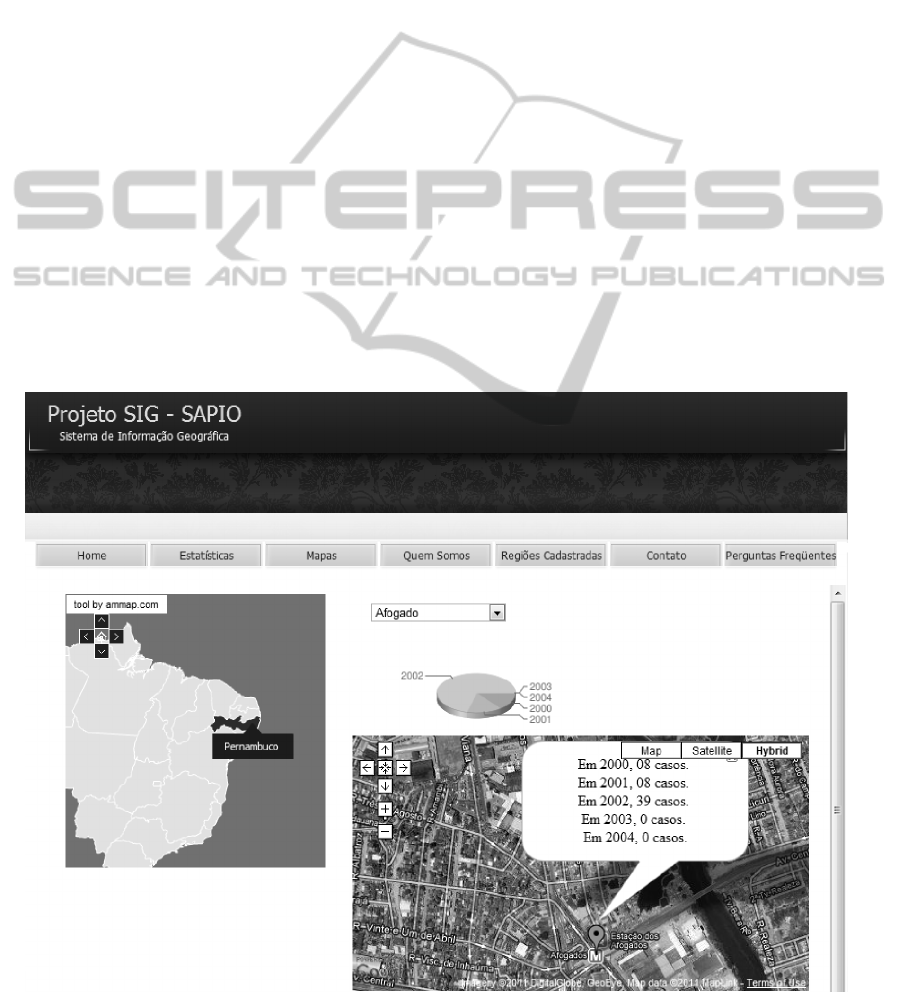
The prototype shown in Figure 2 demonstrates
how dengue monitoring would be displayed for web
users. A general map is presented for the user to
have direct statistic information from any state, and
in need of more detailed information from that state,
a link calls Google Maps to provide accurate
positioning of the dengue proliferation.
3 RESULTS
The results here by far obtained are very satisfactory
because of the difficulty in integrating Google APIs
with other open source applications. The present
work shows a great integration between the two
stages of the SAPIO project, and now can have a
simple but still great techniques and data acquisition
shown visually thru Web for monitoring the
proliferation of dengue, Figure 2.
As it is really important to reach the entire
population for a daily prevention and alert, it should
be remembered that the access to the internet is still
a challenge in poor region of Brazil, and if not the
computers technologies and data speed rates used in
those areas are of poor performance. The idea is to
have the web-platform being accessible for those
having equipment working at transmission data rate
of at least 256 Kbps.
The Brazilian Ministry of Communication is
actually implementing the PNBL (National Plan of
High Speed Internet Connexion in Brazil) for
Internet access purpose overall Brazil for people
having small savings.
The web platform would permit users to surf
around the Brazilian map, top-left in Figure 2
showing the Pernanbuco State as an example, and
look at current or past statistic about dengue in their
region, top-right of Figure 2. This is important to
have as quickly as possible without having to
navigate thru many unnecessary links. Another
accurate information than the one displayed in the
top-right, would display their current localization.
The map shown at Figure 2 would bring the local
position of the treat were the disease is suppose to
occur or appeared, and the drop down box would
make available access to other cities in current or
other state.
Not seen in Figure 2 yet, would be multiple sort
of data displayed for better understanding of what is
going on in the area selected for analysis, and it all
would depend on what type of information is been
collected from the database. Figure 3 shows, as an
example, a static spatial data displaying 2008
Figure 2: SAPIO´s prototype Web Platform for Real Time Dengue Proliferation Analysis.
HEALTHINF 2012 - International Conference on Health Informatics
368

Dengue Fever throughout Brazil, (Dengue, 2011).
This visualization technique will be implemented for
a real time analysis for SAPIO.
Figure 3: Dengue Fever incidence by State in Brazil, 2008.
All Data retrieve from the expert would be
uploaded thru a special link, in SAPIO´s web
platform, into the Database Server in real time with
their GPS coordinates.
As future work, the idea is to work with the
Brazilian National Climate Institute as to having a
more robust, detailed and statistical analysis scenario
were dengue is to be monitored before it causes
more damages throughout Brazil.
4 CONCLUSIONS
This work has shown the development of a web-
based application that can provide the monitoring
and analysis of dengue proliferation in real time. Its
database is filled with data coming from an
automated Aedes aegypti image processing egg
counting from ovitraps. This platform should be
used for monitoring and prevention of the disease as
an alert for all citizens. At this current stage, the
work herein proposed shows how important is it to
make all data collected from SAPIO been visualized
by anyone, and to fight and prevent dengue into a
web illustrated format.
ACKNOWLEDGEMENTS
This research is partially sponsored by FINEP-Brazil
and CNPq-Brazil.
REFERENCES
Amvame, G., Brasil, L., Rodrigues, M., 2011. Sistema
WEB para Monitoração e Análise de Proliferação do
Aedes aegypti. In Pan American Health Care
Exchanges. Rio de Janeiro, Brazil. PAHCE 2011.
Andrade, M., Brasil, L., 2010. Automatic Identification of
Aedes Aegypti Eggs Deposited in Ovitraps Slides
Using Image Processing Techniques. In Congresso
Brasileiro de Engenharia Biomédica. São João Del
Rei. CBEB 2010.
Mello, B., Santos, P., Rodrigues, M., 2008. Image
Segmentation of Ovitraps for Automatic Counting of
Aedes aegypti Eggs. In 30th Annual International
Conference Of The IEEE Engineering In Medicine
And Biology Society. Vancouver, Canada.
Dengue., 2011: Programa nacional de controle da Dengue.
In http://www.dengue.org.br/.
Ministério da Saúde. “Programa nacional de controle da
Dengue. Brazil”. http://portal.saude.gov.br/saude/area.
cfm?id_area=920. Brazil 2010.
Sucaet, Y., Van Hemert, J., 2008. Web-based relational
database for monitoring and analyzing mosquito
population dynamics. In J Med Entomol.
Emily, K., Pietro, Ceccato., Stephen, J., 2006. Web-based
climate information resources for malaria control in
Africa. In Malaria Journal 2006, 5:38.
Google Maps., 2010. In http://www.google.com.br/.
PhpMyAdmin., 2010. In http://www.phpmyadmin.net.
GIS-SAPIO - Automated Aedes Aegypti Web-based Analysis and Prevention Monitor
369
