
OPTIC DISC DETECTION IN RETINAL IMAGES BY PATTERN
DISTANCE MINIMIZATION
Marcy A. Dias and Fernando C. Monteiro
Polytechnic Institute of Braganc¸a, Campus Santa Apol´onia, Apartado 1134, 5301-857 Braganc¸a, Portugal
Keywords:
Earth Mover’s Distance, Gabor Wavelet Transform, Optic Disc Detection, Retinal Images.
Abstract:
The retinal fundus photograph is widely used in the diagnosis and treatment of various eye diseases such as
diabetic retinopathy and glaucoma. On the research work leading to automatic analysis of retinal images, the
knowledge of the optic disc (OD) location is essential, and a new method to locate the optic disc automatically
is proposed. We propose an algorithm for the detection of OD in the retina which takes advantage of the
powerful preprocessing techniques such as the contrast enhancement, Gabor wavelet transform, mathematical
morphology and Earth Mover’s distance as the matching process. Forty images of the retina from the DRIVE
database were used to evaluate the performance of the method.
1 INTRODUCTION
The retina is the inner-most layer of the eye where the
earliest pathological changes are seen. It is composed
of various anatomical structures which indicate many
diseases, such as hypertension, diabetic retinopathy
and glaucoma. Retinopathy is one of the main causes
of blindness in the working age population. Analysis
of retinal images is considered essential for diagnosis
and treatment of many diseases affecting the retina.
These images must be accurately segmented to extract
sensitive objects in the retina such as the blood vessel
tree, the optic disc, the macula and the region between
the optic disc and the macula.
Retinal or fundus images provide information
about the blood supply system to the retina. The op-
tic disc is a bright area within a retinal image and is
the exit point of retinal nerve fibers from the eye and
the entrance and exit point for retinal blood vessels
(See Fig. 1(a)). Optic Disc detection is a reference
to locate the various anatomical features in the retinal
images.
Several OD detection techniques make use of
anatomical structures among the OD, macula, and
retinal blood vessels (Youssif et al., 2008). For exam-
ple, some methods are based on the anatomical struc-
ture that all major retinal blood vessels radiate from
the OD. Some other methods make use of the relative
position between the OD and the macula that often
varies within a small range. Compared with the im-
age characteristics, the anatomical structures are more
reliable under the presence of retinal lesion and imag-
ing artifacts. However, the extraction of either retinal
blood vessels or the macula is often a nontrivial task
by itself.
This paper presents a automatic method for optic
disc detection which takes advantage of the power-
ful preprocessing techniques such as the contrast en-
hancement, Gabor wavelet transform, mathematical
morphology and Earth Mover’s distance for matching
pattern. The methods include the design of a bank of
directionally sensitive Gabor filters for several values
of the scale and elongation parameters as proposed by
Soares et al. (Soares et al., 2006). Forty images of the
retina from the DRIVE database (Staal et al., 2004)
were used to evaluate the performance of the method.
The rest of this paper is organized as follows. Sec-
tion 2 describes the proposed OD detection technique.
Experimental results are then described and discussed
in Section 3. Some concluding remarks are finally
drawn in Section 4.
2 MATERIALS AND METHODS
The DRIVE database consists of 40 images (seven of
which present pathology), compressed in JPEG for-
mat of size 565 ×584 pixels, eight bits per colour
channel, obtained from a diabetic retinopathy screen-
ing program. The images are acquired using a Canon
CR5 nonmydriatic 3CCD camera at 45
0
field of view.
356
A. Dias M. and C. Monteiro F..
OPTIC DISC DETECTION IN RETINAL IMAGES BY PATTERN DISTANCE MINIMIZATION.
DOI: 10.5220/0003766103560359
In Proceedings of the International Conference on Bio-inspired Systems and Signal Processing (BIOSIGNALS-2012), pages 356-359
ISBN: 978-989-8425-89-8
Copyright
c
2012 SCITEPRESS (Science and Technology Publications, Lda.)
The 40 images were divided into two sets, a test set
and a training set, each containing 20 images. The
images have been manually segmented by three ob-
servers to be used as references for comparing the
computer-generated segmentations.
2.1 Contrast Adjustment
After converting each pixel in the image to a vec-
tor of colour components and normalizing each com-
ponent (dividing by 255), the result was converted
to the luminance component Y , computed as Y =
0.299R+0.587G+0.114B,where R, G, and B are the
red, green, and blue components, respectively, of the
colour image. Several other works on the detection of
retinal vessels have used the green channel only; in
the present work, the Y channel was used in order to
reduce noise by averaging the three colour component
images and obtain an image with positive contrast for
the vessels. The artifacts present in the DRIVE im-
ages at the edges were removed by applying morpho-
logical erosion with a disc-shaped structuring element
of diameter 10 pixels.
As the contrast between the blood vessels (fore-
ground) and the retinal tissue (background) is gener-
ally poor in the retinal images, an effective technique
called contrast-limited adaptive histogram equaliza-
tion (CLAHE) is utilized for contrast enhancement
by limiting the maximum slope in the transformation
function. Instead of applying the histogram equal-
ization on the entire image, it is applied only on
small non-overlapping regions in the image. Then,
the neighboring tiles are combined using bilinear in-
terpolation to reduce induced boundaries. Figure 1(b)
shows the contrast enhancementproducedby CLAHE
approach.
2.2 Blood Vessel Segmentation
In many applications of image processing in ophthal-
mology, the most important step is to detect the blood
vessels in the retina (Hoover et al., 2000),(Foracchia
et al., 2004). In our case, we decided to choose
the Soares et al. method (Soares et al., 2006) due
to his high performance in blood vessel segmenta-
tion (≈ 96%). The method produces segmentations
by classifying each image pixel as vessel or non-
vessel, based on the pixel’s feature vector. Feature
vectors are composed of the pixel’s intensity and two-
dimensionalGabor wavelet transformresponses taken
at multiple scales. Gabor wavelets are sinusoidally
modulated Gaussian functions that have optimal lo-
calization in both the frequency and space domains,
thus allowing noise filtering and vessel enhancement
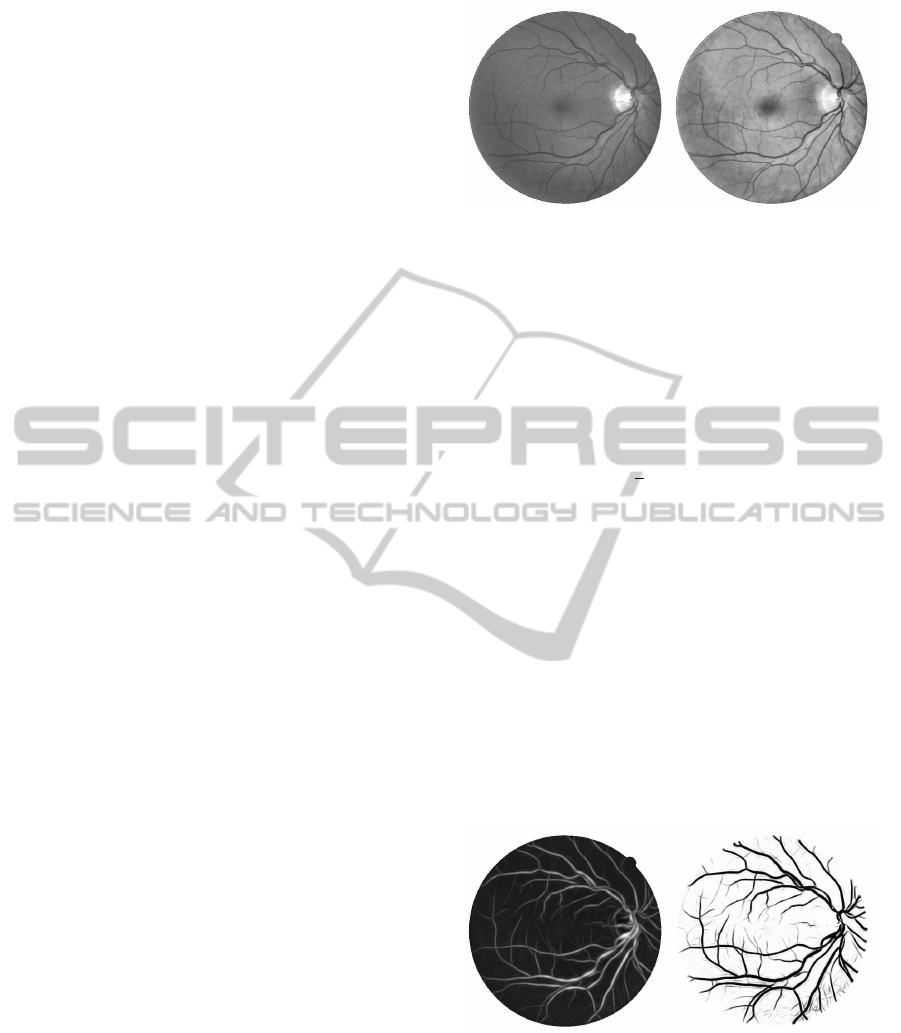
(a) (b)
Figure 1: (a) Green channel of image, (b) Result of contrast
enhancement with CLAHE.
in a single step. The wavelet is capable of detecting
directional structures and of being tuned to specific
frequencies, which is specially important for filtering
out the background noise present in retinal images.
The 2-D Gabor wavelet is defined as
ψ
G
(x) = exp( jk
0
x)exp
−0.5|Ax|
2
(1)
where A = diag
1
√
ε, 1
is a 2×2 diagonal matrix
that defines the anisotropy of the filter, i.e., its elon-
gation in any desired direction. The Gabor wavelet is
actually a complex exponential modulated Gaussian,
where k
0
is a vector that defines the frequency of the
complex exponential.
The Gabor wavelet transform is computed for
spanning from 0 up to 170 degrees at steps of 10 de-
grees. The maximum moduli of the wavelet trans-
form over all angles for various scales are then taken
as pixel features (Fig. 2(a)). In the tests performed,
the elongation parameter was set to ε = 4 and k
0
= 3.
The contrast enhancement image is inverted before
the application of the wavelet transform to it, so that
the vessels appear brighter than the background.
(a) (b)
Figure 2: (a) Maximum modulus response of Gabor wavelet
transform over 18 Gabor filters with scale value of a = 4. (b)
Segmentation of blood vessels.
The blood vessel segmentation is obtained using
a Bayesian classifier with class conditional probabil-
ity density functions, including a Gaussian mixture
model, where each pixel is classified as a vessel or
non-vessel pixel, as shown in Fig. 2(b). To reduce
OPTIC DISC DETECTION IN RETINAL IMAGES BY PATTERN DISTANCE MINIMIZATION
357

the computational burden, pattern matching is applied
only to candidate pixels picked from the fundus im-
age. The binary vessel/nonvessel image is thinned by
applying a morphologic algorithm that reduces all ob-
jects in the binary image to the pixel dimension keep-
ing in the new image only the central pixels of the
vessels. The number of candidates is even more re-
duced by considering only the ones which are within
an image area with 2.5% of the pixels with the highest
intensity of the contracted image as showed in Fig. 3.
Figure 3: Thinned candidate vessels.
2.3 Optic Disc Detection
A distinguishing feature of the optic disc is that it
is the region of convergence for the blood vessel
network. The shape, colour, and size of the OD
showed large variance especially in the presence of
retinopathies, and therefore, detection methods based
on these properties were shown to be weak, and im-
practical.
As stated by Hoover et al. (Hoover et al., 2000),
”A matched filter describes the expected appearance
of a desired signal, for purposes of comparative mod-
eling”. Thus, in order to detect the OD, a simple ves-
sels’ direction matched filter is proposed to roughly
match the direction of the vessels at the OD vicin-
ity. Based on the retinal vasculature orientations we
define a 11×11 pattern formed by two opposite para-
bles. The distance between the pattern and the thinned
vessel map is obtained using the Earth Mover’s dis-
tance (EMD) approach.
Rubner et al. (Rubner et al., 2000) introduced the
EMD to measure perceptual similarity between im-
ages for the purpose of image retrieval. EMD evalu-
ates dissimilarity between two distributions or signa-
tures in some feature space where a distance measure
is given. Intuitively, given two distributions, one can
be seen as a mass of earth properly spread in space,
the other as a collection of holes. Then, the EMD
measures the least amount of work needed to fill the
holes with earth. Here, a unit of work corresponds to
transporting a unit of earth by a unit of ground dis-
tance. The EMD between two distributions is given
Figure 4: Matching pattern.
by the minimal sum of costs incurred to move all the
individual points between the signatures.
Let P = {(p
1
, w
p
1
), ..., (p
m
, w
p
m
)} be the first sig-
nature with m pixels, where p
i
is the pixel represen-
tative and w
p
i
is the weight of the pixel; the sec-
ond signature with n pixels is represented by Q =
(q
1
, w
q
1
), ..., (q
n
, w
q
n
)
; and D = [d
ij
] the distance
matrix where d
ij
is the distance between two points’
image coordinates p
i
and q
j
. The flow f
ij
is the
amount of weight moved from p
i
to q
j
. The EMD
is defined as the work normalized by the total flow
f
ij
, that minimizes the overall cost:
EMD(P, Q) =
∑
i
∑
j
f
ij
d
ij
∑
i
∑
j
f
ij
(2)
As pointed by Rubner et al. (Rubner et al., 2000),
if two weighted point sets have unequal total weights,
EMD is not a true metric. It is desirable for ro-
bust matching to allow point sets with varying total
weights and cardinalities. In order to embed two sets
of contour features with different total weights, we
divide the blood vessel image in several overlapping
tiles and simulate equal weights by adding the appro-
priate number of points, to the lower weight set, with
a penalty of maximal distance. As a measure of dis-
tance for the EMD, we use
d
ij
= 1−e
−
k
p
i
−q
j
k
α
(3)
where
p
i
−q
j
is the Euclidean distance between p
i
and q
j
and α is used in order to accept some defor-
mation of the matching pattern. The exponential map
limits the effect of large distances, which otherwise
dominate the result.
3 RESULTS AND DISCUSSION
The proposed method was tested with fundus images
of the retina from the DRIVE database which contains
40 images (20 for training and 20 for testing).
BIOSIGNALS 2012 - International Conference on Bio-inspired Systems and Signal Processing
358
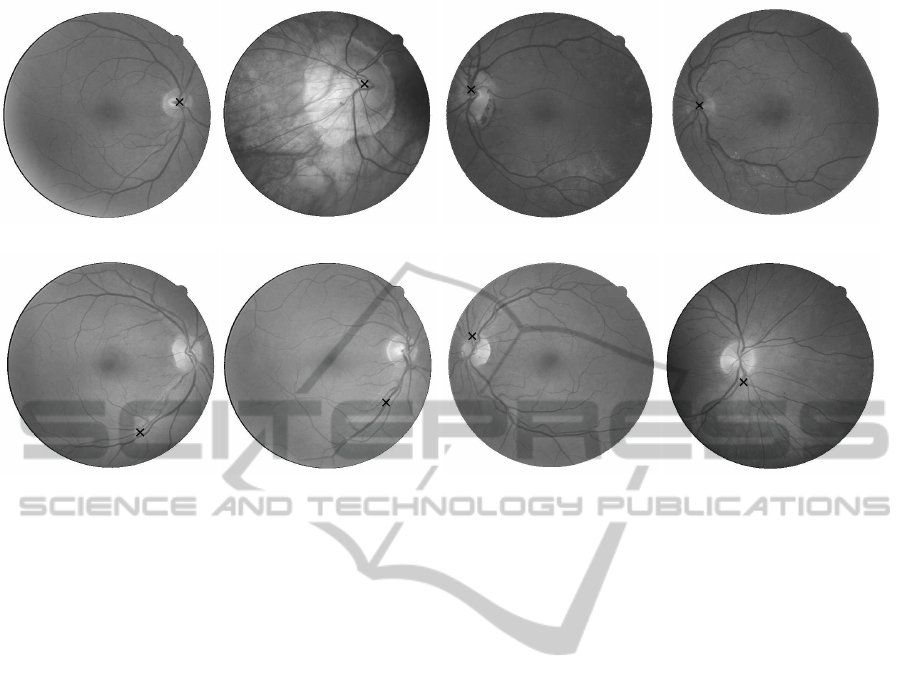
(a) (b) (c) (d)
(e) (f) (g) (h)
Figure 5: OD detection examples (black mark represents the estimated OD centre). The first row shows the best four results.
The second row shows the worst four results. Images (e) and (b) of second row are the only two failed detections.
Figure 5 shows some illustrative OD detection re-
sults. First row shows the best four results and the
second row shows the worst detections.
The proposed method achieved a success rate of
95% (i.e., the OD was detected correctly in 38 out of
the 40 images contained in the DRIVE database). The
estimated centre is considered correct if it was posi-
tioned within 60 pixels of the manually identified cen-
tre, as proposed in (Foracchia et al., 2004),(Hoover
et al., 2000),(Youssif et al., 2008). The average dis-
tance (for the 38 successful images) between the es-
timated OD centre and the manually identified center
was 24.3 pixels. The only two cases in which the OD
was not correctly detected (Images (e) and (f) of Fig.
5) were due to uneven crescent-shaped illumination
joint with crossed vessels that biased the OD candi-
dates and affected the vessel candidate selection.
4 CONCLUSIONS
In this paper, a simple and computationally effi-
cient algorithm for automatic OD detection has been
presented. The proposed algorithm takes advan-
tage of the powerful preprocessing techniques such
as the contrast enhancement, Gabor wavelet trans-
form, mathematical morphology and Earth Mover’s
distance as the matching process. The performance
of the proposed algorithm has been evaluated using
DRIVE database images. Good results have been
achieved, failed the OD detection only in two of the
forty images.
REFERENCES
Foracchia, M., Grisan, E., and Ruggeri, A. (2004). Detec-
tion of optic disc in retinal images by means of a geo-
metrical model of vessel structure. IEEE Transactions
on Medical Imaging, 23(10):1189–1195.
Hoover, A., Kouznetsova, V., and Goldbaum, M. (2000).
Locating blood vessels in retinal images by piecewise
threshold probing of a matched filter response. IEEE
Transactions on Medical Imaging, 19(3):203–210.
Rubner, Y., Tomasi, C., and Guibas, L. (2000). The earth
mover’s distance as a metric for image retrieval. Inter-
national Journal of Computer Vision, 40(2):99–121.
Soares, J., Leandro, J., Jr., R. C., Jelinek, H., and Cree,
M. (2006). Retinal vessel segmentation using the 2-
d gabor wavelet and supervised classification. IEEE
Transactions on Medical Imaging, 25(9):1214–1222.
Staal, J., Abramoff, M., Niemeijer, M., Viergever, M., and
van Ginneken, B. (2004). Ridge-based vessel segmen-
tation in color images of the retina. IEEE Transactions
on Medical Imaging, 23(4):501–509.
Youssif, A., Ghalwash, A., and Ghoneim, A. (2008). Optic
disc detection from normalized digital fundus images
by means of a vessels’ direction matched filter. IEEE
Transactions on Medical Imaging, 27(1):11–18.
OPTIC DISC DETECTION IN RETINAL IMAGES BY PATTERN DISTANCE MINIMIZATION
359
