
FLYBOW IMAGE SEGMENTATION
For Tracing Neuron Circuits in Drosophila Brain
Hao-Chiang Shao
1
, Wei-Yun Cheng
1
, Yung-Chang Chen
1
and Wen-Liang Hwang
2
1
Department of Electrical Engineering, National Tsing Hua University, Hsinchu City, Taiwan
2
Institute of Information Science, Academia Sinica, Taipei, Taiwan
Keywords:
Flybow, Image segmentation, Tracing, Confocal microscope image.
Abstract:
Recently developed were the Brainbow and Flybow techniques that can image and visualize a large number
of neurons at a time. These techniques provide a way for imaging multiple neurons at the same time, and
ideally, neurons can then be differentiated from each other according to their color information. However, due
to dozens of neuron fibers spreading spatially in a very intricate structure, it is time-consuming to label them
by hand and also difficult to trace them by using existing algorithms designed for tracing a single neuron. We
proposed a prototype scheme based on grayscale morphological operations for segmenting Flybow imagery.
The proposed method can provide segmentation results semi-automatically, and thus it would be useful for
biologists to identify the neuro-circuits and develop the ground truth as well.
1 INTRODUCTION
One of the formidable challenges in neuroscience re-
search is to understand howthe information travel, en-
code, decode, and compute in the brain. Drosophila is
a widely used genetic model system for understanding
human biology because of its rapid generation time
and the ease with which it can be handled in the lab-
oratory (Bier, 2005). Simple brain circuits for intri-
cate behaviors, most sophisticated genetic tool box
and complete genomics and proteomics information
make Drosophila an idea model system for studying
basic mechanisms underlying the brain’s operation. A
key step towards understanding the development and
function of the central nervous system is by character-
izing the connections among neurons, which are ex-
ceedingly complex and yet precise in the central ner-
vous system.
Recently developed were the Brainbow (Livet et
al., 2007) and Flybow (Hadjieconomou et al., 2011)
techniques that can image and visualize a large num-
ber of neurons at a time. Based on the combinatorial
and stochastic expression of multiple fluorescent pro-
tein variants—for example, AcGFP for green fluores-
cent protein, CFP for cyan, mKO for orange, and YFP
for yellow—from a single transgene, each neuron can
be randomly assigned to a color via multi-copies re-
porters while being imaged. This kind of techniques
not only lights the way to discriminate different neu-
rons in a defined group of cells, but also provides an
opportunity of tracing neural circuits in a single cell
level. However, it is difficult to separate and trace the
neurons due to the local denseness of neuron fibers
and the signal crosstalk at imaging stage, and hence
reconstructing the neuro-circuits becomes a burden-
some task.
In this paper, we propose a prototype procedure
for segmenting the neurons from the Flybow image
stack of the Drosophila brain. The rest parts of this
paper are organizedas follows. In Section 2, the back-
ground and the related work about Flybow are briefly
depicted; then in Section 3, the proposed method is
described. We demonstrate the experimental results
in Section 4, and finally we draw our conclusion and
discuss the possible future improvements in Section
5.
2 BACKGROUND
Flybow technique provides a way for imaging mul-
tiple neurons at the same time, and ideally, neurons
can then be differentiated from each other accord-
ing to their color information. As shown in Fig. 1,
each neuron—including its cell body and its fibers—
is represented by a certain color, and therefore the
neuron connections are hopefully traceable. There
are many works studying how to trace neuron-fibers
365
Shao H., Cheng W., Chen Y. and Hwang W..
FLYBOW IMAGE SEGMENTATION - For Tracing Neuron Circuits in Drosophila Brain.
DOI: 10.5220/0003767403650369
In Proceedings of the International Conference on Bio-inspired Systems and Signal Processing (BIOSIGNALS-2012), pages 365-369
ISBN: 978-989-8425-89-8
Copyright
c
2012 SCITEPRESS (Science and Technology Publications, Lda.)

Figure 1: Top view of the image stack acquired by using
Flybow technique. This image is obtained by projecting all
slices to the XY-plane, and one of the cell bodies is pointed
out with the arrow.
(Lee et al., 2009; Rodriguez et al., 2009; Peng et
al., 2011), but few literatures address how to seg-
ment and trace the neuro-circuits acquired by Fly-
bow/Brainbow techniques. So far as we know, only
Bas et al. (2010) proposed a cylinder-shape-based
method to trace a bundle of neuron fibers from Brain-
bow imagery. However, as to the case of dozens of
neuron fibers spreading spatially in a very intricate
structure, it not only seems impossible to segment
neural circuits via cylinder-shape-based method, but
also difficult and time-consuming to trace them man-
ually. As the example shown in Fig. 2, it would
be very laborious to identify each independant neu-
ron in regions where the neuron fibers are dense be-
cause the voxel chrominance/luminance may be con-
tributed from all nearby neurons. Furthermore, since
the wavelengthes of green light, produced by GFP,
and yellow light, produced by YFP, are so close, the
resulting crosstalk in G-channel would also lead to
color shifts. Therefore, it is not as intuitive as we an-
ticipated to segment each individual neuron cell from
Flybow image stacks. Our goal here is to develop
a plain and easy-implemented prototype scheme for
Flybow imagrey segmentation, and we expect to de-
velop a robustunsupervised method after further stud-
ies.
3 SEGMENTING NEURONS
The key concept of the proposed method is to identify
the locations of neuron cell bodies first and to trace the
neural pathway from each of them afterward. There
Figure 2: Two axial slices showing that some regions are
dense with neuron fibers.
are two reasons for adopting this strategy. First, it
is tough to recognize each individual neuron by con-
sidering color information since fluorescence of dif-
ferent wavelength may crosstalk and also attenuate
over time and depth. Second, a neuron fiber is usually
nothing more than a thin line/curve or a small spot on
2D image slices, whereas a cell body is often a round-
/oval-shaped disk or a torus. Accordingly, it would be
more feasible and systematic to find the cell bodies at
the beginning and then to segment the neuron fibers
thereof.
The proposed segmentation procedure is per-
formed in somewhat divide-and-conquer style.
Specifically, each of the R-, G- and B- channel is
processed separately, and for a given channel, the
location of every cell body is identified first, and the
fiber of each neuron is traced independently in the
next place. An additional consideration of adopting
this strategy is that the segmentation result of a
channel, e.g. R-channel, can be used to validate that
of another, e.g. G-channel. It is because of that fibers
in the channel, which suffers from crosstalk, is hard
to be traced, and the proposed scheme can at least
provide a circuitous solution to this kind of problem.
In the following subsections, we will first describe
the algorithm overview and then state how to prepro-
cess the source images. Succeedingly, introduced are
the ways to extract cell bodies and to trace neuron
fibers.
3.1 Algorithm Overview
Step-0: Separate the source images into R-, G- and
B-channel images, and perform preprocessing.
Step-1: Erode each of the three channel, and then re-
construct the obtained masks images.
Step-2: Subtract the reconstructed images from the
original ones.
Step-3: Label the obtained segmentaion masks, and
then remove the irrational ones.
Step-4: Based on the original image and the results of
Step-3 and Step-0, perform grayscale morphological
BIOSIGNALS 2012 - International Conference on Bio-inspired Systems and Signal Processing
366

reconstruction again, and then trace the neuron fibers
from each cell body via the just reconstructed images.
3.2 Preprocessing
The source images have to be preprocessed so that
the edges of neuron fibers can be enhanced and the
halation effect can be reduced. It is straightforward to
enhance the pathway of neuron fibers by using high-
boost filtering, but the high-boost operation may mag-
nify the halation effect. The halation effect results
from the fact that the fluorescence emitted by the neu-
ron cells may halo the neighboring areas, as what can
be observed in Fig. 1 and Fig. 2. Accordingly, we
apply white top-hat transform, defined as the differ-
ence bwteen the input image and its morphological
opening result, to reduce the halation. Notice that
since the white top-hat transform can extract voxels
brighter than their surroundings, the obtained result
of this step is conceptually a skelonized image stack
that would be a suitable input for trancing stage.
Remind that both high-boost filtering, also known
as unsharp masking, and top-hat transform are con-
ventional operations in image processing. Further, the
details of these two operations can be found in (Gon-
zalez and Woods, 2007).
3.3 Extracting Cell Body
This step is primarily accomplished by morpholog-
ical operations because cell body regions are likely
to survive after several times of erosion, but neuron
fibers are not. This step consists of three components,
they are (1) erosion, (2) labelling, and (3) reconstruc-
tion. All proceduresin these components are operated
three-dimensionally,and the aim here is to find the 3D
segmentation masks for cell bodies.
3.3.1 Erosion
Instead of general binary erosion, we adopt grayscale
erosion which can gradually darken the input images
so that it is advantageous not only to remove the neu-
ron fibers, but also to locate the cell bodies. As illus-
trated in Fig.1, the fluorescence intensity of cell body
region is usually over-saturated; therefore the inten-
sity difference between original input images and the
morphological reconstructed images can be used to
indicate the positions of cell bodies.
3.3.2 Labelling
In this substep, the connected-component labelling is
performed. The goals of labelling here are twofold:
(1) remove the segmentation masks that are too small
Figure 3: Illustration of the intensity decrement after
grayscale erosion and reconstruction. The original figure
is downloaded from Mathwork’s website (Mathwork).
to denote cell bodies, and (2) discard the segmenta-
tion masks that contain cavities inside, as the arrowed
area in Fig.2. The first case may happen when the
segmentation is associated with dendrite or synapse,
and the second case may related to the region where
the neuron fibers are dense.
3.3.3 Reconstruction
Based on the previous steps, the segmentation mask
can be reconstructed by using grayscale morphology
reconstruction. Then, the cell bodies can be located
according to the intensity decrements obtained by
subtracting the reconstructed images from the origi-
nal ones. Additionally, the reconstruction result can
also be used as a reference to evaluate the threshold
for tracing neuron fibers, since it provides a feasible
minimal intensity value for the given object, as illus-
trated in Fig.3.
3.4 Tracing Neuron Fibers
Based on the location of cell body, we then can trace
its fiber by considering the spatial connections. Since
each of the R-, G-, and B-channel is processed inde-
pendently, the color information can be disregarded
and only the spatial connectivity is considered. The
proposed strategy is to start tracing from a cell body
and then to connect recursivelyall the 26-neighborsin
three-dimensional space until there is no more voxel
can be connected. In other words, it is exactly the
concept of region-growing. The threshold required
for deciding whether a voxel should be connected is
a user-specified parameter, although it can also be es-
timated from the morphological reconstruction result
as we just described in the Subsection 3.3.3.
FLYBOW IMAGE SEGMENTATION - For Tracing Neuron Circuits in Drosophila Brain
367

4 EXPERIMENT RESULT
The source image stack we used consists of 131 image
slices of dimension 1024 × 1024, and the sampling
resolutions along x-, y- and z-direction are respec-
tively 0.35, 0.35 and 1.0 µm. Based on the amount
of cell bodies that were extracted in our experiments,
there are about more than 100 neurons successfully
imaged and visualized in this image stack. Also, ac-
cording to the biologists, almost all of neurons in this
area—theoretically about 70000 neurons—are likely
to be interconnected. Consequently, our goal is to ex-
tract and isolate independent neurons and their fibers
from the flybow imagery as possible as we can. The
proposed method is applied on the downsampled im-
age stack with dimension 512 × 512× 131, and parts
of our segmentation results are demonstrated in the
following figures.
(a) (b)
(c) (d)
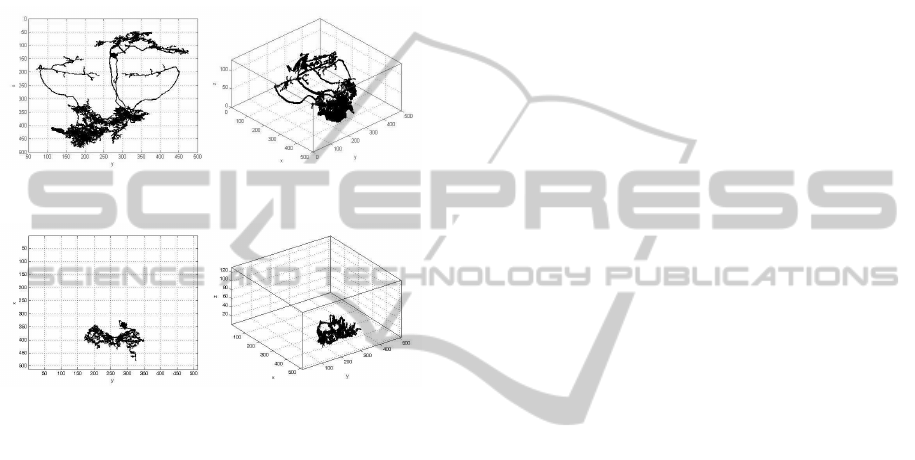
Figure 4: Different views of two independent neuron cells
and the fibers thereof.
In Fig.4, two neurons are segmented success-
fully, and the segmentation result can then be used to
picture how neuron fibers route in Drosophila brain
in a single cell level. Take the neuron shown in
Fig.4(a) for example. Its cell body locates approx-
imately on (225, 130, 117); its neuron fiber is ini-
tially extended toward the position (199, 208, 95) and
then turns to extend horizontally toward the place
(206, 374, 95); finally, one of its branches moves to-
ward (161, 423, 51), whereas the other keeps length-
ening horizontally. In Fig.5, two neurons are seg-
mented and traced well via the proposed method, even
though fibers of two independentneuronsare spatially
entangled with each other. Comparing Fig.1 and 6 re-
spectively with Fig.5(a) and (b) and Fig.5(c) and (d),
it is easy to find that the neurons shown in Fig.5 are
visualized in dissimilar colors, and hence they could
be seperated according to their color information.
(a) (b)
(c) (d)
Figure 5: Different views of other two neurons. Note that
the cell body of the neuron shown in (a) and (b) is exactly
the one arrowed in Fig.1, whereas (c) and (d) is the one
highlighted by label-2 in Fig.6.
Figure 6: Label-1 indicates the neuron shown in Fig.4(c)
and (d), and label-2 points towards the neuron shown in
Fig.5(c) and (d).
Finally, Fig.7(a), (b) show two or three neurons
that cannot be differentiated due to crosstalk or im-
proper tracing threshold; meanwhile, Fig.7(c), (d) il-
lustrated one another neighboring neuron which is vi-
sualized in different color and hence segmented suc-
BIOSIGNALS 2012 - International Conference on Bio-inspired Systems and Signal Processing
368
cessfully. Fig.7 represents that even if the neurons,
which are spatially close and randomly assigned to
similar colors, cannot be clearly separated, the pro-
posed algorithm can at least provide a reference to as-
sist biologists identifying the neural circuits in a cell-
to-cell level. In short, the experimental results show
that the proposed scheme can segment the Flybow im-
agery well, even though there are still some improve-
ments needed to be carried out.
(a) (b)
(c) (d)
Figure 7: Neurons that cannot be separated from each other.
Though terminals of the neuron fibers of at least 2 neuron
cells are interlaced, the segmentation result can also provide
a reference to biologists for identifying different neurons.
5 CONCLUSIONS
We proposed a prototype scheme based on grayscale
morphological operations for segmenting Fly-
bow/Brainbow imagery. It is time-consuming to label
the neural circuits from Flybow/Brainbowimagery by
hand and also difficult to trace them by using existing
algorithms designed for tracing a single neuron. The
proposed method can provide segmentation results
semi-automatically, and consequently it would be
useful for biologists to identify the neuro-circuits.
Besides, in order to develop a sound and robust
algorithm for this kind of data, it is inevitable to es-
tablish a ground truth first. Thus, our segmentation
results need to be verified by biologists repeatedly un-
till a well-accepted ground truth is constructed. We
will start this task by first segmenting some neurons
well-known in biological literatures and then extend
the algorithm to other neurons. Moreover, there is at
least one another reachable future improvement for
this prototype scheme. That is, design a distance met-
ric which can integrate color information into exist-
ing tracing algorithms or clustering methods so that
it is able to seperate neighboring neurons assigned
to similar colors. By completing the possible im-
provements, we are looking forward to establishing a
more robust segmentation/tracing scheme for Brain-
bow/Flybow imagery in the future.
ACKNOWLEDGEMENTS
This research work is supported by Academia Sinica,
Taiwan. The authors also want to thank Prof. Ann-
Shyn Chiang, the Program Director of the Brain Re-
search Center at National Tsing Hua University, and
his team for providing the experiment image sets and
their enthusiastic support.
REFERENCES
Bas, E. and Erdogmus, D. (2010). Piecewise linear cylinder
models for 3-dimensional axon segmentation in brain-
bow imagery. In Proceedings of ISBI, 1297–1300.
Bier, E. (2005). Drosophila, the golden bug, emerges as a
tool for human genetics. Nature Rev. Genet., 6:9–23.
Gonzalez, R. C. and Woods, R. E. (2007). Digital image
processing. Prentice Hall, 3rd edition.
Hadjieconomou, D., Rotkopf, S., Alexandre, C., Bell, D.,
Dickson, B., and Salecker, I. (2011). Flybow: genetic
multicolor cell labeling for neural circuit analysis in
drosophila melanogaster. Nature Methods, 8:260–
266.
Lee, P. C., Chang, H. M., Lin, C. Y., Chiang, A. S., and
Ching, Y. T. (2009). Constructing neuronal structure
from 3D confocal microscopic images. Journal of
Medical and Biological Engineering, 29:1–6.
Livet, J., Weissman, T. A., Kang, H., Draft, R. W., Lu,
J., Bennis, R. A., Sanes, J. R. , and Lichtman, J. W.
(2007). Transgenic strategies for combinatorial ex-
pression of fluorescent proteins in the nervous system.
Nature, 450:56–62.
Mathwork. http://www.mathworks.com/help/toolbox/
images/f18-16264.html
Peng, H., Long, F., and Myers, G. (2011). Automatic 3D
neuron tracing using all-path pruning. In Proceedings
of Bioinformatics [ISMB/ECCB], 239–247.
Rodriguez, A., Ehlenberger, D., Hof, P., and Wearne,
S. (2011). Three-dimensional neuron tracing by
voxel scooping. Journal of Neuroscience Methods,
184:169–175.
FLYBOW IMAGE SEGMENTATION - For Tracing Neuron Circuits in Drosophila Brain
369
