
INTEGRATING PATHWAY ENRICHMENT AND GENE
NETWORK ANALYSIS PROVIDES ACCURATE DISEASE
CLASSIFICATION
Maysson Al-Haj Ibrahim
1, 2
, Sabah Jassim
1
, Michael A. Cawthorne
2
and Kenneth Langlands
2
1
Department of Applied Computing, Buckingham University, Buckingham, U.K.
2
Clore Laboratory, Buckingham University, Buckingham, U.K.
Keywords: Disease classification, Biomarker discovery, Pathway enrichment, Gene network analysis, Microarray data
analysis.
Abstract: At present, a range of clinical indicators are used to gain insight into the course a newly-presented
individual’s disease may take, and so inform treatment regimes. However, such indicators are not absolutely
predictive and patients with apparently low-risk disease may follow a more aggressive course. Advances in
molecular medicine offer the hope of improved disease stratification and personalised treatment. For
example, the identification of “genetic signatures” characteristic of disease subtypes is facilitated by high-
throughput transcriptional profiling techniques (microarrays) in which gene expression levels for thousands
of genes are measured across a range of biopsy samples. However, the selection of a compact gene set
conferring the most clinically-relevant information from complex and high-dimensional microarray datasets
is a challenging task. We reduced this complexity using a Pathway Enrichment and Gene Network Analysis
(PEGNA) method, which integrates gene expression data with prior biological knowledge to select a group
of strongly-correlated genes providing accurate discrimination of complex disease subtypes. In our method,
pathway enrichment analysis was applied to a microarray dataset in order to identify the most impacted
biological processes. Secondly, we used gene network analysis to find a group of strongly-correlated genes
from which subsets of genes were selected to use for disease classification with a support vector machine
classifier. In this way, we were able to more accurately classify disease states, using smaller numbers of
genes, compared to other methods across a range of biological datasets.
1 INTRODUCTION
The identification of disease biomarkers from
genetic data, notably high-throughput transcriptional
profiling screens, has attracted a great deal of recent
interest due to their importance in diagnosis and
prognostication. Biomarker discovery can be
modelled as a feature selection problem that aims to
find the most discriminating features (genes) for
accurate disease classification (Ibrahim, Jassim,
Cawthorne and Langlands, 2011b).
Gene selection methods can be broadly
categorized into two main groups (Asyali, Colak,
Demirkaya and Inan, 2006): gene-based methods,
and group-based methods (also known as filter
methods and wrapper methods). Typical gene-based
prediction methods rank genes individually
according to pre-defined criteria such as t-test,
relative entropy, and Wilcoxon test. The disease-
discriminating power of each gene in such methods
is considered separately.
Group-based methods aim to identify a small
subset of genes r out of n genes that minimize the
classification error where
n
r
. A straightforward
approach to select the best r features out of n is to
try all possible combinations C where:
(1)
However, this approach involves an exhaustive
search problem, which is computationally
intractable. For example, selecting the most
informative group of 10 genes out of 100 genes,
with a minimum classification error requires more
than
13
10 1.731
attempts. However, genes in a
typical microarray experiments number in the tens of
thousands, so such methods are very
!)(!
!
rnr
n
C
n
r
156
Al-Haj Ibrahim M., Jassim S., A. Cawthorne M. and Langlands K..
INTEGRATING PATHWAY ENRICHMENT AND GENE NETWORK ANALYSIS PROVIDES ACCURATE DISEASE CLASSIFICATION.
DOI: 10.5220/0003767901560163
In Proceedings of the International Conference on Bioinformatics Models, Methods and Algorithms (BIOINFORMATICS-2012), pages 156-163
ISBN: 978-989-8425-90-4
Copyright
c
2012 SCITEPRESS (Science and Technology Publications, Lda.)

computationally-demanding. Well-known traditional
approximation solutions of exhaustive search
problems such as Branch-and-bound-search,
sequential forward/ backward selection and
sequential forward/ backward floating search have
been proposed to enhance the efficiency of group-
based methods (Jain, Duin and Mao, 2000; Jain and
Zongker, 1997; Simon, 2003). However, the gene
groupings for these and similar algorithms are based
on statistically-derived clusters, not on biological
knowledge. In this paper we describe an alternative
solution based on limiting the search space to a
group of correlated genes of greatest biological
relevance to the disease type. This rationale is
informed by the importance of combining gene
expression data with prior biological knowledge to
achieve better disease classification and provide
additional contextual biological information
compared to other methods. The complexity of
biological systems has necessitated the
categorisation of genes in the context of discrete
biological processes (pathways), generating a vast
repository of information curated in publicly-
available databases. This classification has taken
different forms, including categorizing genes
according to narrowly defined descriptive terms
(specifically cellular component, biological process
and molecular function) by the Gene Ontology (GO)
consortium (Ashburner, Ball, Blake, Botstein,
Butler, Cherry, Davis, Dolinski, Dwight, Eppig and
others, 2000), or by grouping genes using pathways,
such as in the database maintained by KEGG (The
Kyoto Encyclopaedia of Genes and Genomes
database) (Kanehisa and Goto, 2000).
These initiatives have facilitated new approaches
for disease classification and biomarker discovery
by combining gene expression data with
standardised functional annotations. Guo, Zhang, Li,
Wang, Xu, Yu, Zhu, Wang, Wang, Topol, Wang and
Rao (2005) used an arithmetic mean and median of
all the gene expression values in each category
defined by GO to capture the activity of that
category, represented as a vector. Rapaport,
Zinovyev, Dutreix, Barillot and Vert (2007) and
Chen and Wang (2009) relied on Principal
Component Analysis (PCA) to summarize all genes
in every pathway in a compact representation. Su,
Yoon and Dougherty (2009) computed the log-
likelihood ratio comparing different disease
phenotypes based on the expression level of each
gene. The activity of a given pathway was inferred
by combining the log-likelihood ratios of the
constituent genes. Tai and Pan (2007) used all genes
in a pathway with no transformation. Others have
applied a greedy search algorithm to find subsets of
discriminating genes in each pathway summarized
using the mean (Chuang et al., 2007) or sum of z-
scores (Hwang and Park, 2009). These algorithms
output gene sets able to provide disease
classification accuracies that are comparable to
conventional gene selection methods. However,
while summarizing a set of genes using one or more
of the values described above might provide
accuracy in disease classification, they do not
necessarily facilitate the identification of those genes
germane to disease pathogenesis (Ibrahim et al.,
2011b).
The Gene Expression Network Analysis Tool
(GXNA) described by Nacu et al., (2007) uses
interaction data to build small networks of
mammalian genes. Yousef et al., (2009), described a
method that ranked microarray genes individually
using t-test criteria before selecting a subset of genes
to be subjected to gene network analysis with
GXNA. However this method did not strive to
identify the smallest number of strongly-correlated
genes, and a pre-filtering step may more effectively
identify compact sets of biologically-relevant
targets.
Ibrahim et al., (2011b) described a gene selection
method that exploited pathway enrichment analysis
to identify the most relevant pathways perturbed in a
given microarray dataset. From this a set of
differentially-expressed genes (DEGs) was isolated
for disease classification. Although this approach
involves pathway enrichment analysis, the critical
problem remains the selection of the smallest
number of genes correlating with outcomes.
Pathways may contain hundreds of genes (as shown
in Table 1, which presents the number of expressed
genes (nGene) in the top 10 most perturbed
pathways in a dataset derived from patients with
leukaemia). However, while the selection of
biomarkers from pathway-enriched datasets
performed well, an additional step to increase
biological relevance could more effectively identify
those genes correlating most strongly with disease
subtypes.
Herein we describe a Pathway Enrichment and
Gene Network Analysis (PEGNA) method to
facilitate more accurate disease classification.
PEGNA integrates gene expression data with prior
biological knowledge at two levels to select a group
of correlated genes able to accurately discriminate
complex as well as simple disease traits. Initially,
PEGNA applies pathway enrichment analysis to a
microarray dataset, followed by the selection of the
top active (impacted) pathways most relevant to the
INTEGRATING PATHWAY ENRICHMENT AND GENE NETWORK ANALYSIS PROVIDES ACCURATE DISEASE
CLASSIFICATION
157

disease type before merging their genes into one
common group. Secondly, the common genes are
fed into gene network analysis (using GXNA) to
construct a gene network of a given size, thereby
enriching for a group of genes most relevant to the
disease under study.
2 PATHWAY ENRICHMENT AND
GENE NETWORK ANALYSIS
Figure 1 illustrates the PEGNA method for enriching
microarray data. Datasets are randomly split into
training and testing sets of equal size, with an equal
representation of disease subtypes and correlated
genes identified as described below. Median
expression values for different disease states were
determined across arrays within the sets.
i. Pathway Enrichment Analysis. Pathways are sets
of correlated genes interacting together to perform
specific biological tasks, thus pathway enrichment
analysis is more informative for biologists compared
to unsorted lists of genes (Tian, Greenberg, Kong,
Altschuler, Kohane and Park, 2005). Such analysis
helps to identify the most relevant pathways to the
phenotype. A number of statistical methods have
been described for pathway enrichment; including
Fisher exact and Chi-squared tests to calculate the
probability of obtaining the observed number of
significantly altered genes in a pathway by chance
(Curtis et al., 2005). Others methods, such as gene
set enrichment analysis (GSEA) (Subramanian et al,
2005) and z-score (Cheadle et al., 2003), assign each
pathway a statistical score representing its
contribution to the phenotype under analysis.
Several tools such as GenMapp (Dahlquist et al.,
2002), Gene-Sifter (GeneSifter® Analysis Edition),
and Pathway Miner (Pandey et al., 2004) use z-
scores in evaluating either GO term or pathway
enrichment (reviewed in (Curtis et al., 2005)).
In this paper, we use the z-score for pathway
enrichment analysis as it is straightforward to
implement, although any pathway enrichment
method could be used. The z-score is a statistical test
under the hypergeometric distribution, and herein we
use it as a measure of significance of the 108
predefined signalling pathways imported from
KEGG after superimposing expression data. We
chose to focus on signalling pathways due to their
relevance to cancer and relative ease in removing
redundancies, a process described in (Ibrahim et al.,
2011a). The z-score of a pathway p (p=1, 2, .., 108)
is given by the following formula:
(2)
Where N is the total number of expressed genes
detected by the microarray, R is the total number of
significant genes (i.e. genes that meet the criteria for
fold change above threshold, and p-value below
threshold), n is the total number of expressed genes
in the pathway p, and r is the number of significant
genes in the pathway p.
ii. Pathway Ranking. Pathway enrichment analysis
assigns a score to each predefined pathway based on
perturbations in gene expression. Ranking pathways
by descending score readily allows identification of
those most relevant to the phenotype.
iii. Isolation of Significant Genes from k High
Scoring Pathways to Create a Gene Cluster p. We
selected the top 10 most relevant pathways (k=10) as
this provides the best compromise between
identifying informative genes and redundancy.
iv. Creation of Gene Networks with GXNA. The
genes in group p might number in hundreds as
mentioned earlier. Therefore, we used GXNA (Nacu
et al., 2007) to build gene networks of strongly
correlated genes. In addition to prior biological
information obtained from the KEGG database,
GXNA relies on statistical measures for scoring
networks and uses a search algorithm to output m
user defined networks with high scores.
v. Identification of Networks with the Lowest
Classification Error Rate. We assigned a score for
each of the m networks based on classification error
rates obtained using the training set achieved with a
Support Vector Machine (SVM) classifier. The gene
network giving the lowest classification error was
selected.
vi. Identification of N Discriminating Features
(Genes). As illustrated in Figure 1, steps 4, 5, and 6
are repeated for different sizes of gene networks. In
this paper, we selected N= 2, 4, 6, ... 24 genes.
To evaluate the performance of the PEGNA
algorithm, we used the test dataset to calculate
disease classification accuracy achieved with the
SVM classifier, based on the N genes from the
selected network, using a K-fold cross-validation
testing strategy.
)
1
1
1)(1)((
)(
N
n
N
R
N
R
n
N
R
nr
zscore
p
BIOINFORMATICS 2012 - International Conference on Bioinformatics Models, Methods and Algorithms
158
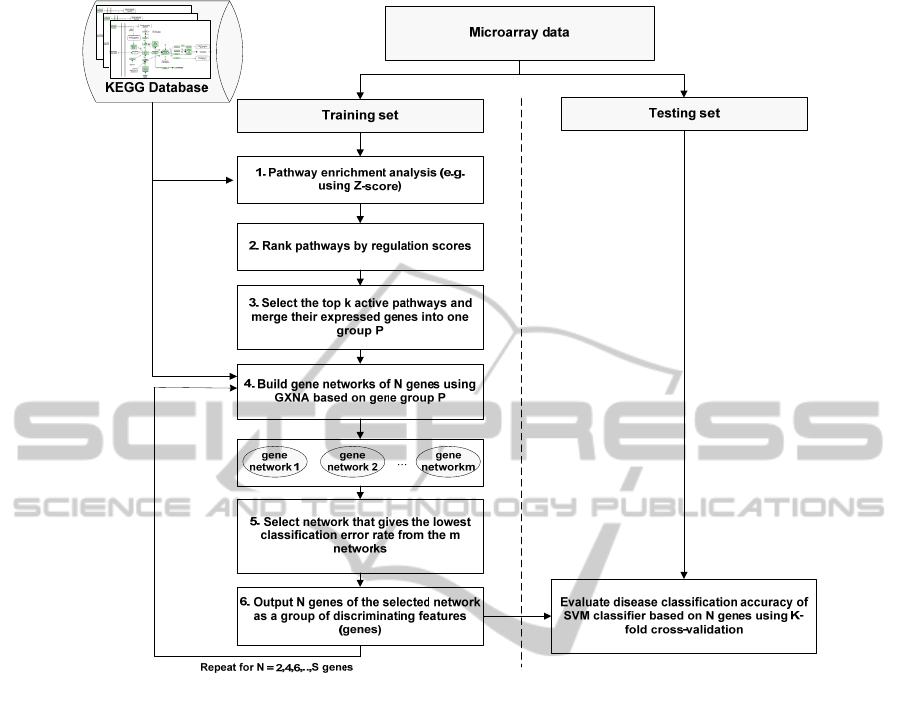
Figure 1: A flowchart of the Pathway Enrichment and Gene Network Analysis (PEGNA) method.
3 RESULTS
3.1 Datasets
3.1.1 AML
Acute Myeloid Leukaemia (AML) is a
haematopoietic malignancy resulting from the
deregulated proliferation of myeloid precursor cells
(or blasts). Microarray studies have been used to
identify gene expression changes that are unique to
AML blasts in order to identify those genes whose
expression profile differentiates leukaemic cells
from normal cells in order to generate effective
therapeutic targets.
We reanalysed an AML dataset that compared 38
myeloid cell samples derived from healthy donors
and 26 samples of blasts from AML patients
(Stirewalt, Meshinchi, Kopecky, Fan, Pogosova-
Agadjanyan, Engel, Cronk, Dorcy, McQuary and
Hockenbery, 2008). RNA from these tissues was
analysed using an Affymetrix GeneChip U133A
platform (GEO (Gene Expression Omnibus
database) accession GSE9476). Typical output of the
first stage of our analysis pipeline, pathway
enrichment, is shown in Table 1. A number of
critical pathways are identified, as previously
discussed (Ibrahim et al, 2011a).
3.1.2 Psoriasis
Psoriasis is a common skin disease that causes
enhanced epidermal cell division resulting in red,
dry patches of thickened skin. Understanding the
pathogenesis of this disease and identification of its
potential mediators has been investigated through
profiling genome-wide transcriptional changes with
microarray technology.
We reanalysed a dataset containing matched
samples of uninvolved and lesional skin from 28
psoriatic patients (Yao, Richman, Morehouse, de
Los Reyes, Higgs, Boutrin, White, Coyle, Krueger,
Kiener and others, 2008). The Affymetrix® whole
INTEGRATING PATHWAY ENRICHMENT AND GENE NETWORK ANALYSIS PROVIDES ACCURATE DISEASE
CLASSIFICATION
159

genome U133 plus v2.0 array platform (GEO
accession GSE14905) was used to profile genes
expression in the different groups. In our analyses,
we focused on identifying the list of genes best able
to differentiate lesional from non-lesional samples.
3.1.3 Breast Cancer
The histological grade of invasive breast carcinoma
(designated 1, 2 or 3) provides clinically-important
prognostic information. Grades 1 and 3 are
associated with low and high risk of recurrence
respectively, while grade 2 is associated with an
intermediate risk of recurrence.
We studied a previously reported breast cancer
dataset (Sotiriou, Wirapati, Loi, Harris, Fox, Smeds,
Nordgren, Farmer, Praz, Haibe-Kains and others,
2006) consisting of 189 samples in total (67 grade 1,
59 grade 2, 46 grade 3, and 17 unknown) analysed
using Affymetrix U133A platform (GEO accession
GSE2990). We focused on discriminating Types 1
and 3 in this report.
Table 1: Top 10 AML pathways ranked by z-score.
rank pathway z-score nGene
1 Osteoclast differentiation 4.67
126
2
Antigen processing and
presentation
4.09
76
3
Natural killer cell mediated
cytotoxicity
4.06
127
4 Acute myeloid leukemia 3.87
58
5 T cell receptor signaling pathway 3.69
105
6 Malaria 3.69 50
7 Systemic lupus erythematosus 3.54 120
8 Staphylococcus aureus infection 3.35 54
9 Endocytosis 3.29 183
10
Bacterial invasion of epithelial
cells
2.89 66
3.2 Performance
We compared the performance of the PEGNA
algorithm with two other pathway enrichment based
approaches: Pathway Enrichment with
Differentially-Expressed Genes (PE_DEGs,
(Ibrahim et al., 2011b) and Pathway Enrichment
with Principal Component Analysis (PE_PCA) using
a support vector machine (SVM) classifier. The
three approaches share the first three steps illustrated
in Figure 1 and differ in the selection of gene groups
from the k most impacted pathways. PE_DEGs
ranks the genes according to their fold change and p-
value in a descending manner and selects a group of
size N from the top ranked genes, which are used
without further network enrichment. Alternatively, it
is attractive to use a dimension reduction technique
to produce a compact representation of the data.
PCA has been used extensively in the area of
microarray-based disease classification to effectively
reduce the dimensionality of microarray data
(Rapaport et al., 2007; Chen and Wang, 2009). In
the PE_PCA method, we applied PCA on the genes
identified by pathway analysis to extract a summary
of N transformed metaGenes. Importantly, PEGNA
and PE_DEGs have an advantage over PE_PCA in
as much as they output a group of identifiable genes
rather than metaGenes, with implications for
understanding pathogenic mechanisms and creating
diagnostic assays.
For all methods, raw array data extracted from
GEO were normalized by the Robust Multichip
Average (RMA) method using built-in functions in
Matlab 7.10.0, and the significant genes
discriminating normal and disease tissue, or disease
sub-types were detected using criteria of fold
change>=1.5 and p-value<0.05 prior to pathway
enrichment.
Experimental results in this paper are achieved
using a SVM classifier applied to the test data using
K-fold cross validation (k=10). Test samples are
divided into k subsets so the SVM is trained on k-1
subsets and tested on the remaining subset. The
process is then repeated 10 times as each subset is
taken to be a test set in turn (leave-one-out method).
Figure 2 illustrates the increased accuracy
achieved with PEGNA compared to alternative
methods in the AML dataset. PEGNA achieves the
highest disease classification accuracy across a
range of gene group sizes. Moreover, PEGNA
achieves 100% classification accuracy using a group
of 8, 14, 16, 18, and 20 genes.
Figure 2: AML classification accuracies achieved with
PE_DEGs, PE_PCA and PEGNA using gene groups of
different sizes [2, ... 24].
70
73
76
79
82
85
88
91
94
97
100
24681012141618202224
PE_DEGs PE_PCA PEGNA
numberofgenes /metaGenes
Accuracy(%)
BIOINFORMATICS 2012 - International Conference on Bioinformatics Models, Methods and Algorithms
160
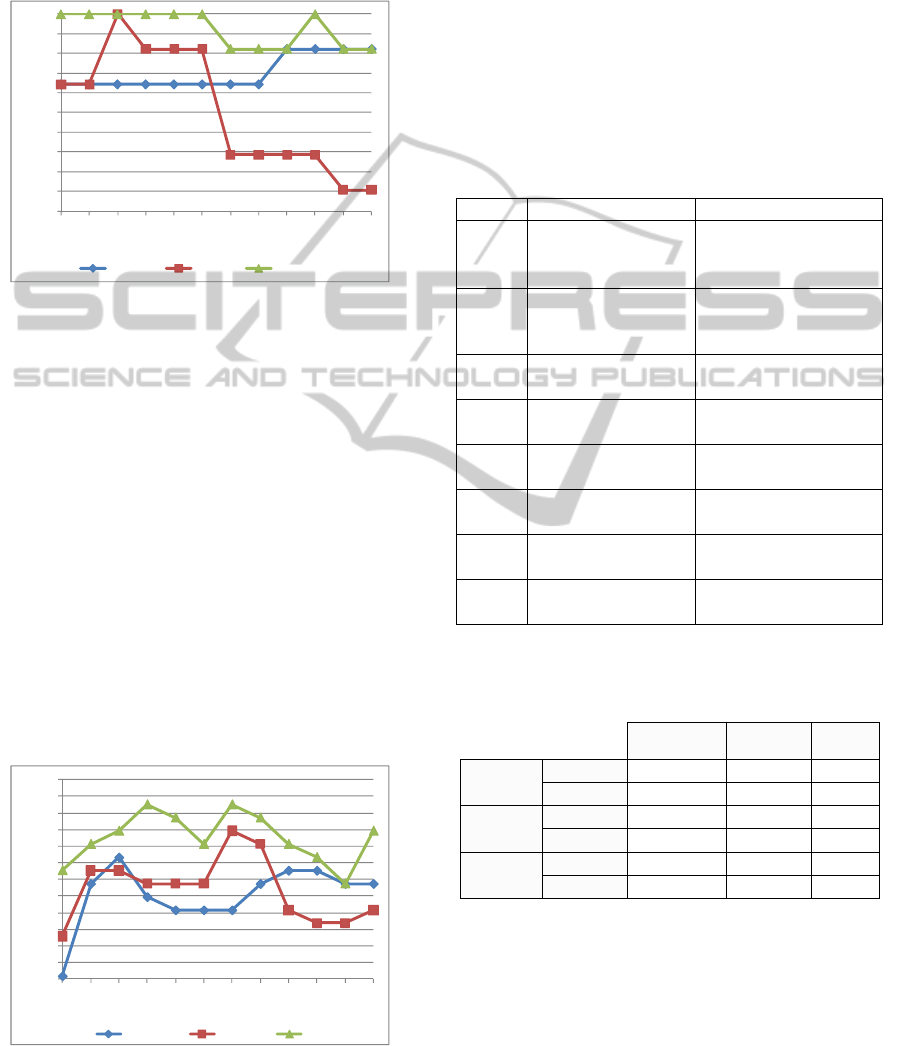
Analysis of the psoriasis microarray dataset
shows that PEGNA outperforms PE_DEGs and
PE_PCA in terms of classification accuracy (Figure
3). Specifically, our method consistently achieves
100% accuracy between 2 and 12 genes.
Figure 3: Psoriasis classification accuracies achieved with
PE_DEGs, PE_PCA, and PEGNA using gene groups of
different sizes [2, ... 24].
Analysis of the breast cancer data, illustrated in
Figure 4, is more challenging compared to the other
two datasets as a consequence of the complex
pathogenesis of the disease and the fact that we are
comparing disease subtypes, rather than performing
a disease versus normal compartment analysis. As a
consequence of this, the three methods achieve less
accurate classification compared to the previous two
datasets, although PEGNA consistently achieves the
highest classification accuracy. For example, using a
group of just 2 genes, classification accuracy of
PEGNA, PE_PCA, and PE_DEGs are 82.5%,
78.5%, and 76% respectively. A maximal accuracy
of 86.5% is achieved with PEGNA, which can be
contrasted with the values of 84.9% and 83.3%
achieved with PE_PCA and PE_DEGs respectively.
Figure 4: Breast cancer classification accuracies achieved
with PE_DEGs, PE_PCA, and PEGNA using gene groups
of different sizes [2, ... 24].
The most informative genes isolated from our
analysis of the breast cancer data are shown in Table
2. Notably, five of the eight genes are known to be
informative in breast cancer, with the remaining two
showing a strong cancer association and one
(CCNB1) implicated in drug metabolism. While
biomarker identification is a problem distinct from
the improved understanding of disease processes, it
will be of interest to investigate further the roles of
ZBT16, CCNB1 and CDC20 in the pathogenesis of
breast cancer.
Table 2: Disease association in breast cancer biomarkers
isolated with PEGNA.
Gene Disease association Reference
RXR
Increased risk invasive
breast cancer
(Lawrence, Merino,
Simpson, Manrow, Page,
DL and Steeg, 1998)
ZBTB16
Associated with long-
term ovarian cancer
survival
(Bonome, Levine, Shih,
Randonovich, Pise-Masison
et al., 2008)
CDK1
Increased risk of relapse
in breast cancer
(Kim, Nakayama, Miyoshi,
Taguchi et al., 2007)
CCNB1
Breast cancer drug
sensitivity
(Shen, Huang, Jee and Kuo,
1998)
CDC20
Over-expressed in gastric
cancers
(Kim, Sohn, Yoon, Oh,
Yang et al., 2005)
PTTG1
Associated with poor
breast cancer prognosis
(Lo, Yu, Chen, Hsu, Mau,
Yang, Wu and Shen, 2007)
BIRC5
Associated with poor
breast cancer prognosis
(Span, Sweep, Wiegerinck,
Tjan-Heijnen et al., 2004)
MAD2L1
Associated with poor
breast cancer prognosis
(Sotiriou, Neo, McShane,
Korn, Long et al., 2003)
Table 3: Comparison of classification accuracy (%Acc)
obtained with PE_DEGs, PE_PCA, and PEGNA using
three disease datasets.
Leukaemia Psoriasis
Breast
Cancer
PE_DEGs
nGene 20 18 6
% Acc. 98.4 98.2 83.3
PE_PCA
nMetaGene 16 6 14
% Acc. 98.4 100 84.9
PEGNA
nGene 8 2 8
% Acc. 100.0 100.0 86.5
Table 3 summarises optimal performances
achieved with the three methods, i.e. the highest
classification accuracy based on a minimum number
of genes/ metaGenes obtained across three disease
datasets. It is clear that PEGNA achieves better
accuracy in discriminating discrete (such as
psoriasis) as well as more complex (such as breast
cancer) disease states using fewer genes compared to
the other two methods. Moreover, PEGNA outputs a
90
91
92
93
94
95
96
97
98
99
100
24681012141618202224
PE_DEGs PE_PCA PEGNA
numberofgenes /metaGenes
Accuracy (%)
76
77
78
79
80
81
82
83
84
85
86
87
88
2 4 6 8 10 12 14 16 18 20 22 24
PE
_
DEGs PE
_
PCA PEGNA
numberofgenes /metaGenes
Accuracy (%)
INTEGRATING PATHWAY ENRICHMENT AND GENE NETWORK ANALYSIS PROVIDES ACCURATE DISEASE
CLASSIFICATION
161

group of genes rather than metaGenes.
4 CONCLUSIONS
By systematically filtering complex microarray
datasets, we identified the minimal gene sets able to
discriminate disease states. This is important as any
diagnostic test needs to be cost effective, and testing
small numbers of genes in disease biopsies is much
more cost-effective compared to performing, for
example, genome-wide analyses. While PCA may
be useful in reducing array dimensionality, methods
that isolate identifiable genes are preferred.
Moreover, the identity of critical genes yields insight
into mechanisms of disease pathogenesis. A further
increase in accuracy may be provided by the
inclusion of currently unannotated transcripts, or by
increasing pathway definitions, but at the present
time this is algorithmically complex. Ultimately,
diagnostic gene expression fingerprints must be
rigorously evaluated in prospective analyses, and we
are currently refining our methods to facilitate
discrimination of ever more complex disease types.
REFERENCES
Ashburner, M., Ball, C. A., Blake, J. A., Botstein, D.,
Butler, H., Cherry, J. M., Davis, A. P., Dolinski, K.,
Dwight, S. S., Eppig, J. T. and others. (2000). Gene
Ontology: tool for the unification of biology. Nature
genetics, 25, 25-29.
Asyali, M. H., Colak, D., Demirkaya, O. and Inan, M. S.
(2006). Gene Expression Profile Classification: A
Review. Current Bioinformatics, 1, 55-73.
Bonome, T., Levine, D. A., Shih, J., Randonovich, M.,
Pise-Masison, C. A., Bogomolniy, F., Ozbun, L.,
Brady, J., Barrett, J. C., Boyd, J. and others. (2008). A
gene signature predicting for survival in suboptimally
debulked patients with ovarian cancer. Cancer
Research, 68, 5478.
Cheadle, C., Vawter, M. P., Freed, W. J. and Becker, K.
G. (2003). Analysis of Microarray Data Using Z Score
Transformation. Journal Of Molecular Diagnostics, 5,
73-81.
Chen, X. and Wang, L. (2009). Integrating Biological
Knowledge with Gene Expression Profiles for
Survival Prediction of Cancer. Journal of
Computational Biology, 16, 265–278.
Chuang, H. Y., Lee, E., Liu, Y. T., Lee, D. and Ideker, T.
(2007). Network-based classification of breast cancer
metastasis. Molecular systems biology, 3, 140.
Curtis, R. K., Oresic, M. and Vidal-Puig, A. (2005).
Pathways to the analysis of microarray data. TRENDS
In Biotechnology, 23, 429-435.
Dahlquist, K. D., Salomonis, N., Vranizan, K., Lawlor, S.
C. and Conklin, B. R. (2002). GenMAPP, a new tool
for viewing and analyzing microarray data on
biological pathways. Nature Genetics, 31, 19-93.
Gene Expression Omnibus database. (n.d.). Retrieved June
2011, from http://www.ncbi.nlm.nih.gov/geo/
GeneSifter® Analysis Edition. (n.d.). Retrieved January
2011, from http://www.genesifter.net
Guo, Z., Zhang, T., Li, X., Wang, Q., Xu, J., Yu, H., Zhu,
J., Wang, H., Wang, C., Topol, E., Wang, Q. and Rao,
S. (2005). Towards precise classification of cancers
based on robust gene functional expression profiles.
BMC Bioinformatics, 6, 58.
Hwang, T. and Park, T. (2009). Identification of
differentially expressed subnetworks based on
multivariate ANOVA. BMC bioinformatics, 10, 128.
Ibrahim, M. A. H., Jassim, S., Cawthorne, M. A. and
Langlands, K. (2011a). A Topology-based Score for
Pathway Enrichment. In Press, Journal of
Computational Biology .
Ibrahim, M. A. H., Jassim, S., Cawthorne, M. A. and
Langlands, K. (2011b). Pathway-based Gene Selection
for Disease Classification. International Conference
on Information Society (pp. 360-365). London: IEEE.
Jain, A. and Zongker, D. (1997). Feature Selection:
Evaluation, Application, and Small Sample
Performance. IEEE Transactions On Pattern Analysis
And Machine Intelligence PAMI, 19, 153-157.
Jain, A. K., Duin, R. P. and Mao, J. (2000). Statistical
Pattern Recognition: A Review. IEEE Transactions
On Pattern Analysis And Machine Intelligence PAMI,
22, 4-37.
Kanehisa, M. and Goto, S. (2000). KEGG: Kyoto
encyclopedia of genes and genomes. Nucleic Acids
Research, 28, 27.
Kim, J. M., Sohn, H. Y., Yoon, S. Y., Oh, J. H., Yang, J.
O., Kim, J. H., Song, K. S., Rho, S. M., Yoo, H. S.,
Kim, Y. S. and others. (2005). Identification of Gastric
Cancer–Related Genes Using a cDNA Microarray
Containing Novel Expressed Sequence Tags
Expressed in Gastric Cancer Cells. Clinical Cancer
Research, 5, 473.
Kim, S. J., Nakayama, S., Miyoshi, Y., Taguchi, T.,
Tamaki, Y., Matsushima, T., Torikoshi, Y., Tanaka,
S., Yoshida, T., Ishihara, H. and others. (2007).
Determination of the specific activity of CDK1 and
CDK2 as a novel prognostic indicator for early breast
cancer. Annals of Oncology, 48, 68.
Lawrence, J. A., Merino, M. J., Simpson, J. F., Manrow,
R. E., Page, D. L. and Steeg, P. S. (1998). A high-risk
lesion for invasive breast cancer, ductal carcinoma in
situ, exhibits frequent overexpression of retinoid X
receptor. Cancer Epidemiology Biomarkers &
Prevention, 7, 29.
Lo, Y. L., Yu, J. C., Chen, S. T., Hsu, G. C., Mau, Y. C.,
Yang, S. L., Wu, P. E. and Shen, C. Y. (2007). Breast
cancer risk associated with genotypic polymorphism
of the mitotic checkpoint genes: a multigenic study on
cancer susceptibility. Carcinogenesi , 28, 1079.
Nacu, S., Critchley-Thorne, R., Lee, P. and Holmes, S.
BIOINFORMATICS 2012 - International Conference on Bioinformatics Models, Methods and Algorithms
162

(2007). Gene expression network analysis and
applications to immunology. Bioinformatics, 23, 850.
Pandey, R., Guru, R. K. and Mount, D. W. (2004).
Pathway Miner: extracting gene association networks
from molecular pathways for predicting the biological
significance of gene expression microarray data.
Bioinformatics, 20, 2156-2158.
Rapaport, F., Zinovyev, A., Dutreix, M., Barillot, E. and
Vert, J. (2007). Classification of microarray data using
gene networks. BMC Bioinformatics, 8, 35.
Span, P.N., Sweep, F. C. G. J., Wiegerinck, E. T. G., Tjan-
Heijnen, V. C. G., Manders, P., Beex, L. V. A. M. and
de Kok, J. B. (2004). Survivin Is an Independent
Prognostic Marker for Risk Stratification of Breast
Cancer Patients. Clinical Chemistry, 50, 1986.
Shen, S. C., Huang, T. S., Jee, S. H. and Kuo, M. L.
(1998). Taxol-induced p34cdc2 kinase activation and
apoptosis inhibited by 12-O-tetradecanoylphorbol-13-
acetate in human breast MCF-7 carcinoma cells. Cell
Growth \& Differentiation: The Molecular Biology
Journal Of The American Association For Cancer
Research, 9, 23.
Simon, R. (2003). Diagnostic and prognostic prediction
using gene expression profiles in high-dimensional
microarray data. British Journal Of Cancer, 89, 1599-
1604.
Sotiriou, C., Neo, S. Y., McShane, L. M., Korn, E. L.,
Long, P. M., Jazaeri, A., Martiat, P., Fox, S. B.,
Harris, A. L. and Liu, E. T. (2003). Breast cancer
classification and prognosis based on gene expression
profiles from a population-based study. Proceedings of
the National Academy of Sciences of the United States
of America, 100, 10393.
Sotiriou, C., Wirapati, P., Loi, S., Harris, A., Fox, S.,
Smeds, J., Nordgren, H., Farmer, P., Praz, V., Haibe-
Kains, B. and others. (2006). Gene expression
profiling in breast cancer: understanding the molecular
basis of histologic grade to improve prognosis.
Journal of the National Cancer Institute, 98, 262.
Stirewalt, D. L., Meshinchi, S., Kopecky, K. J., Fan, W.,
Pogosova-Agadjanyan, E. L., Engel, J. H., Cronk, M.
R., Dorcy, K. S., McQuary, A. R. and Hockenbery, D.
(2008). Identification of genes with abnormal
expression changes in acute myeloid leukemia. Genes
Chromosomes And Cancer, 47, 8-20.
Su, J.,Yoon, B. J. and Dougherty, E. R. (2009). Accurate
and Reliable Cancer Classification Based on
Probabilistic Inference of Pathway Activity. PLoS
One, 4, 503-511.
Subramanian, A., Tamayo, P., Mootha, V. K., Mukherjee,
S., Ebert, B. L., Gillette, M. A., Paulovich, A.,
Pomeroy, S. L., Golub, T. R. and Lander, E. S. (2005).
Gene set enrichment analysis: A knowledge-based
approach for interpreting genome-wide expression
profiles. Proceedings of the National Academy of
Sciences of the United States of America, 102, 15545-
15550.
Tai, F. and Pan, W. (2007). Incorporating prior knowledge
of predictors into penalized classifiers with multiple
penalty terms. Bioinformatics, 23, 1775-1782.
The Kyoto Encyclopaedia of Genes and Genomes
database. (n.d.). Retrieved May 2011, from
http://www.genome.jp/kegg/
Tian, L., Greenberg, S. A., Kong, S. W., Altschuler, J.,
Kohane, I. S. and Park, P. J. (2005). Discovering
statistically significant pathways in expression
profiling studies. Proceedings of the National
Academy of Sciences of the United States of America,
102, 13544-13549.
Yao, Y., Richman, L., Morehouse, C., de Los Reyes, M.,
Higgs, B. W., Boutrin, A., White, B., Coyle, A.,
Krueger, J., Kiener, P.A. and others. (2008). Type I
interferon: potential therapeutic target for psoriasis.
PLoS One ,3, e2737.
Yousef, M., Ketany, M., Manevitz, L., Showe, L. and
Showe, M. (2009). Classification and biomarker
identification using gene network modules and support
vector machines. BMC Bioinformatics, 10, 337.
INTEGRATING PATHWAY ENRICHMENT AND GENE NETWORK ANALYSIS PROVIDES ACCURATE DISEASE
CLASSIFICATION
163
