
WORKPLACE STRESS ESTIMATION METHOD BASED ON
MULTIVARIATE ANALYSIS OF PHYSIOLOGICAL INDICES
Hirohito Ide, Guillaume Lopez, Masaki Shuzo, Shunji Mitsuyoshi, Jean-Jacques Delaunay
and Ichiro Yamada
The University of Tokyo, School of Engineering, 7-3-1 Hongo, Bunkyo-ku, Tokyo 113-8656, Japan
Keywords:
Stress monitoring, Wearable sensors, Multivariate analysis, Virtual healthcare.
Abstract:
In this research, we have been developing a new integrated analysis method of multiple physiological signals
to estimate stress in daily life, which is important in depression screening and life-style related diseases pre-
vention. Experiments have been carried out on 100 participants, measuring electrocardiogram, pulse wave,
breath rhythm, and skin temperature in four patterns of psychological states; relax state, normal stress state,
monotonous stress state, and nervous state. The newly developed stress state estimation method relies on the
integrated analysis of nine physiological indices related to stress that have been extracted from the four mea-
sured physiological signals. Because variation range of each index is different between individuals and types
of stress, we divided estimation process into three steps. For each step, we performed cross-validation using
various classification schemes to select the most relevant set of indices that enable estimation of stress state
with few influences of individual variations. Through this method we could achieve 87% accuracy for stress
detection, and 63% accuracy for stress type classification. Finally a validation study was performed to confirm
this method can be an effective solution to estimate various types of stress state regardless of individuals.
1 INTRODUCTION
Nowadays, most developed countries are facing a
serious problem with the increasing number of dis-
eases caused by excessive stress, not only mental dis-
order diseases (depression, etc.), but also lifestyle-
related diseases (hypertension, metabolic syndrome,
etc.). Indeed, when we are subject to excessive stress,
we tend to overeating, drinking alcohol, smoking and
such lifestyle-related disease risk factors. In this in-
troduction, we define our field of study, describe the
existing approaches and their issues, and present our
approach to address them in the work reported in this
paper.
1.1 Background and Definition of Stress
Current stress detection methods, when not an after-
wards conclusion, rely on inquiry sheets or interviews
with a medical specialist. Though, because stress is
so pervasive in our social activities, there is an inher-
ent need to be able to monitor stress continuously in
daily life, in a seamless way, and over extended peri-
ods. It is important to propose such new system for
personal continuous stress monitoring, which would
enable prevention of serious stress-related health dis-
orders, through a seamless and regular screening of
stressful experiences an individual is exposed during
his daily life activities. Such system would benefit
both individuals by providing regular feedback about
their stress, as well as physicians by supporting pa-
tient status monitoring and evaluation with objective
and in context information.
We hear a lot about stress, but what is it? Taber’s
Cyclopedic Medical Dictionary defines stress as ”the
result produced when a structure, system or organism
is acted upon by forces that disrupt equilibrium or
produce strain”. In simpler terms, we will consider
stress as the result of any emotional, physical, so-
cial, economic, or other factors that require a response
or change. It is generally believed that some stress
is okay (sometimes referred to as ”normal stress” or
”positive stress”), but when it occurs in amounts that
cannot be handled, both mental and physical changes
may occur.
In our study, we focus on ”Workplace stress,”
which we define as the physiological responses that
can happen when there is a conflict between job de-
mands on the person and the amount of control this
person has over meeting these demands. In gen-
53
Ide H., Lopez G., Shuzo M., Mitsuyoshi S., Delaunay J. and Yamada I..
WORKPLACE STRESS ESTIMATION METHOD BASED ON MULTIVARIATE ANALYSIS OF PHYSIOLOGICAL INDICES.
DOI: 10.5220/0003769400530060
In Proceedings of the International Conference on Health Informatics (HEALTHINF-2012), pages 53-60
ISBN: 978-989-8425-88-1
Copyright
c
2012 SCITEPRESS (Science and Technology Publications, Lda.)

eral, the combination of high demands in a job and
a low amount of control over the situation can lead
to stress. Regarding the amount of oxygen consump-
tion, work strongly stimulates heart activity (Carroll
et al., 2009), and both qualitative and quantitative
augmentations are reported to have a strong corre-
lation with dissatisfaction, decline in self-evaluation,
which are risk factors of mental disorders (Araki and
Kawakami, 1993). That is why on both mental dis-
order diseases and lifestyle-related diseases point of
views, there is a considerably strong need in work-
place stress monitoring.
As stated by the Canadian Mental Health Associ-
ation (http://www.cmha.ca/), stress in the workplace
can have many origins: Fear of job redundancy, pres-
sure to perform, increased demands for overtime due
to staff cutbacks, layoffs due to an uncertain econ-
omy act as negative stressors. Though, among these
origins, we chose to remove economical and non-
work-related stressors, to focus on the following three
workplace stress categories as partly proposed by Shi-
mono et al. (Shimono et al., 1998).
• Monotonous stress: stress accompanied by a te-
dious feeling when repeating a work with little
content changes for a long continuous time (job
redundancy, frequent overtimes, etc.).
• Nervous stress: stress accompanied by a feeling
of tension when performing a work that cannot af-
ford any miss (pressure to perform, speech, meet-
ing with hierarchical superiors, etc.).
• Normal stress: stress accompanied by any feeling
different from above described, when performing
a basic work (in other words basic work that does
not generate extra stress).
1.2 Current Technological Solutions
and their Issues
Traditionally, personal medical monitors have been
used only to perform data acquisition. Typical ex-
amples are holter monitors that are routinely used for
electrocardiogram (ECG) and electroencephalogram
(EEG) monitoring. Recently, with the miniaturization
and improved performances of micro-sensors, wear-
able computing, and wireless communication tech-
nologies (Fukuda et al., 2001; Itao, 2007), a new
generation of wearable intelligent sensors have been
developed (Jovanov et al., 2000). Such devices can
significantly decrease the number of hospitalizations
and nursing visits (Heidenreich et al., 1999) by act-
ing as a personal quotationvirtual health adviser that
can warn the user of a medical emergency or contact
a specialized medical response service. A wearable
health-monitoring device using a personal area net-
work (PAN) or BAN can be integrated into a user’s
clothing (Park and Jayaraman, 2003), though such
system organization is unsuitable for lengthy, contin-
uous monitoring, particularly during normal activity.
We can classify prior research related to stress
study using wearable physiological sensing into the
following three categories.
1. Studies that demonstrate the causal relationship
between stress and changes in physiological in-
dices (Kim et al., 2008; Ohsuga et al., 2001; Schu-
bert et al., 2009)
2. Studies that evaluate qualitatively and/or quanti-
tatively the stress issued by an external stimulus
(Kotlyar et al., 2008; Watanabe et al., 2008)
3. Studies that estimate the occurrence or not of
stress based on the observation of changes in
physiological indices (Aasa et al., 2006; Fukuda
et al., 2001; Itao et al., 2008)
Aiming at stress monitoring during daily life ac-
tivities, our research corresponds to the third cate-
gory. This category is composed of two groups of
methodologies, being methodologies to retrieve stress
changes based on the observation of long-term evolu-
tion for a single physiological index, and methodolo-
gies that build models for stress status output from
input of physiological indices, based on multivariate
analysis. We consider these groups of methodologies
has four big issues that need to be addressed.
1. As physiological indices are strongly influenced
by individual differences, their values on stress
occurrence are different depending on each in-
dividual (Miyake, 1997). Therefore, it is neces-
sary to pick-up physiological indices that are less
prone to individual differences when estimating
stress.
2. Depending on the type of stress (in other words
the type of emotion), reacting physiological in-
dices are different, so that it is difficult to esti-
mate stress in detail from a single physiological
index (Miyake, 2001; Ohsuga et al., 2001; Shi-
mono et al., 1998).
3. Stress status output models application is often
limited to only one specific individual, and cannot
output stress status correctly for a different person
(Ohsuga et al., 2001; Soda and Narumi, 2007).
4. Models are often limited to an output of having
or not stress, and do not estimate stress status in
details (i.e. stress type) (Shin et al., 1998; ?).
According to above statements, the study we
present here aims at addressing the described issues,
HEALTHINF 2012 - International Conference on Health Informatics
54

by establishing a detailed and high-generality stress
estimation method, in other words a stress type esti-
mation method using physiological indices less prone
to individual differences.
The remainder of the article is structured as fol-
lows. Section 2 described the physiological sig-
nals and indices we selected as an input to our pro-
posed multivariate analysis method and the experi-
mental set-up used to measure these signals. Sec-
tion 3 presents the experimental procedure and the
pre-processing of collected data we executed to build-
up a reliable database of physiological indices corre-
sponding to targeted three types of workplace stress.
Section 4 describes our proposed method, evaluates
its efficiency using experimental data, and validates
its reliability regarding the database. Finally, Section
5 sum-up our findings, raises remaining issues, and
opens a short view on future implementations we plan
to pursue.
2 PHYSIOLOGICAL
INFORMATION USEFUL TO
STRESS ESTIMATION
For monitoring stress, we focus on autonomic nervous
system activity, though we don’t use EEG due to its
difficult processing that makes it difficult to use for a
real-time stress monitoring solution.
It is known that the autonomic nervous system in-
fluences the activity of the heart, the breath, the lung,
and the skin activities. If there is any change on the
autonomic nervous system due to stress, it should be
detectable through the activity of these physiological
elements. Typical studies of the autonomic nervous
system activity monitoring consist in ECG’s heart
beats R peak time interval variations (RRV: R-R inter-
val variations) frequencies analysis, in which strength
of low frequencies zone (LF: 0.04-0.15Hz) reflects
sympathetic nerve’s activity, and strength of high
frequencies zone (HF: 0.15-0.4Hz) reflects parasym-
pathetic nerve’s activity. Then, LF/HF power ra-
tio is an indicator of activity dominant nervous sys-
tem (large: sympathetic nerve is dominant, small:
parasympathetic nerve is dominant).
Though these studies reported that RRV spectral
analysis was effective to evaluate the physical and
mental loads by quantifying respectively the activity
level of sympathetic and parasympathetic nerves (Ak-
selrod et al., 1981; Itao et al., 2008), this index is
known to be different according to the age, sex and
the individual variation (Miyake, 2001). The physi-
ological indices should meet the following two con-
ditions: the first is that they can reflect the categories
of stress, and the second is that individual differences
are not large. In this study, we decided to measure
simultaneously electrocardiogram (ECG), pulse wave
by photoplethysmography(PPG), breath, and temper-
ature of finger’s skin.
From these four physiological signals, we extract
the following nine physiological indices, which we
adopted as the basic information for stress type es-
timation.
• From ECG: HR (Heart rate), RRV, LF/HF
• From PPG: t
PAT
(pulse arrival time)
• From breath: f
G
(respiratory central frequency),
| f
P
-f
G
| (absolute value of difference between
f
G
and peak frequency), t
E
(breath time), stdt
T
(derivation of breath time)
• From finger’s skin temperature: T
F
(average tem-
perature of the finger’s skin)
To collect above selected physiological signals,
we used multi-channels biological amplifier (Poly-
mate, Digitex lab. Co. ltd.) that is basically composed
of an electrocardiograph (ECG) and an ear clip type
photoplethysmograph (PPG), but to which optional
sensors such as belt-type breath sensor, and temper-
ature sensor needed for our study can be connected.
3 STRESS CORRELATED
PHYSIOLOGICAL INDICES
DATABASE BUILD-UP
For predicting stress by using psycho-physiological
indices, it is necessary to build a database based on
these indices at the situation when people faced tar-
geted different types of stressor and effectively get the
expected stress reaction. The following paragraphs
will present the experimental procedure we defined to
stimulate efficiently the three types of stress reactions
targeted, and how we extract a sufficient number of
high quality data sets among the whole measurement.
3.1 Experimental Procedure for
Physiological Indices Data-sets
Measurements
In this study, we focus on normal stress, monotonous
stress, and nervous stress, the most usual stresses that
may occur at a workplace. To collect data that will
populate our database of a person under these differ-
ent types of stress we used the Paced Auditory Serial
WORKPLACE STRESS ESTIMATION METHOD BASED ON MULTIVARIATE ANALYSIS OF PHYSIOLOGICAL
INDICES
55
Addition Test (PASAT, see Fig. 1), which has an ac-
knowledged authority among scientific community as
to having high reproducibility (Al’Absi et al., 2005;
?; Willemsen et al., 1998). Based on former research
work about monotonous stress (Yamada and Miyake,
2007) and nervous stress (Al’Absi et al., 1997), we
defined the following three types of PASAT tasks.
• PASAT1: 5 minutes PASAT task to stimulate a
normal stress reaction
• PASAT2: 60 minutes PASAT task to stimulate a
monotonous stress reaction
• PASAT3: 5 minutes PASAT task combined with
reward cutting on miss, to stimulate a nervous
stress reaction
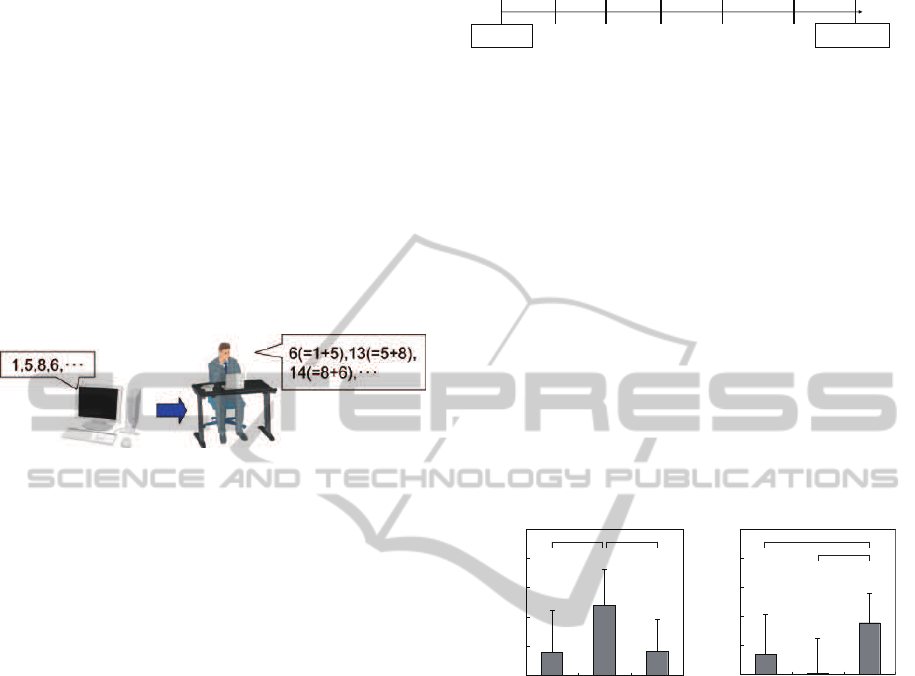
Figure 1: Scheme presenting the principle of PC based
PASAT. PASAT task consists in adding consecutive single
digit numbers presented by voice continuously.
We have built a dedicated black room to avoid any
environmental light and noise disturbance, and a PC
interface to execute PASAT and answer to it in a sim-
ple and quick way. The experimental protocol flow
is described on Figure 2. We have performed above
described experimental for each PASAT task with re-
spectively 48, 18, and 46 participants, whose ages
were from 15 to 47 years old.
However, to be sure that before performing the as-
signed PASAT task each participant was not already
in a psychological status that may influence expected
stress reaction, due to the lack of sleep, overwork,
alcohol and such, subjective assessments were con-
ducted before and after PASAT task. Subjective as-
sessment is done on dedicated PC interface composed
of a list of short questions to which the participant
can answer using a mouse to set the Visual Ana-
log Scale (VAS) for each question corresponding to
scores from 0% to 100%. To evaluate the effective
reaction to each specific stress type stimulation, we
used the scores of related questions, among which the
average score of questions about feeling exhausted,
ineffective, and depressed, for monotonousstress, and
questions about feeling strained and palpitating for
nervous stress.
3.2 Data Quality Evaluation Results
To verify if each expected stress type effectively oc-
curred or not, we performed a test to check the sig-
㪠㫅㫊㫋㫉㫌㪺㫋㫀㫆㫅
㪧㫉㪸㪺㫋㫀㪺㪼
㫆㪽㩷㪧㪘㪪㪘㪫
㪩㪼㫃㪸㫏
㪪㫌㪹㫁㪼㪺㫋㫀㫍㪼
㪸㫊㫊㪼㫊㫊㫄㪼㫅㫋
㪧㪘㪪㪘㪫
㪪㫌㪹㫁㪼㪺㫋㫀㫍㪼
㪸㫊㫊㪼㫊㫊㫄㪼㫅㫋
㪈㫄㫀㫅 㪌㫄㫀㫅
㪧㪘㪪㪘㪫㪈㪃㩷㪊䋺㪌㫄㫀㫅
㩷㩷㩷㪧㪘㪪㪘㪫㪉䋺㪍㪇㫄㫀㫅䇭
㩿㪠㪽㩷㪸㩷㫇㪸㫉㫋㫀㪺㫀㫇㪸㫅㫋㩷㪾㫀㫍㪼㫊㩷㫌㫇㩷㪧㪘㪪㪘㪫㪃
㪿㪼㩷㪻㫆㪼㫊㩷㫊㫌㪹㫁㪼㪺㫋㫀㫍㪼㩷㪸㫊㫊㪼㫊㫊㫄㪼㫅㫋㩷㫈㫌㫀㪺㫂㫃㫐㪅㪀
㫋㫀㫄㪼
㪜㫏㫇㪼㫉㫀㫄㪼㫅㫋
㫊㫋㪸㫉㫋
㪜㫏㫇㪼㫉㫀㫄㪼㫅㫋
㪼㫅㪻
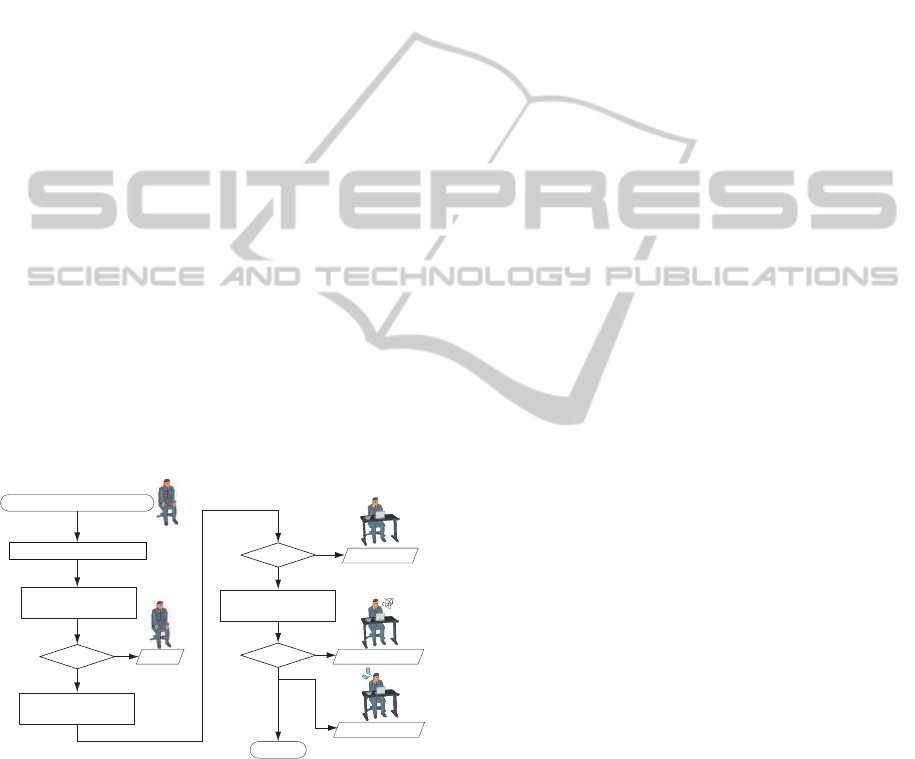
Figure 2: Experimental procedure flow. A fiveminutes-long
relaxing time was set before each test to be able to evaluate
physiological indices in a relax situation.
nificant difference (t-test) among the different PASAT
tasks, using the subjective stress type score variation
between subjective assessment before and after the
PASAT task corresponding to this stress type. Fig-
ure 3 shows the results significant differenceexamina-
tion among the three PASAT tasks. Considering only
the group of participants with more than 60% of ac-
curacy rate in PASAT1 and PASAT3 tasks (PASAT1:
19, PASAT2: 18, PASAT3: 21), we could verify high
significant differences. From these results, we can
consider that expected stress reaction has effectively
occurred for experimental participants, respectively
corresponding to the stress type stimulated by each
PASAT task.
0
20
40
60
80
1 32
0
20
40
60
80
1 32
PASAT
PASAT
100
100
**** **
**
** : 1% significance
Change of
score of high-tension [-]
Change of
score of boredom [-]
Figure 3: Subjective assessment scores in each PASAT.
Compared to PASAT1, “boredom” score (monotonous
stress) is higher with PASAT2, while “high-tension” score
(nervous stress) is higher with PASAT3.
4 A NEW METHOD FOR
WORKPLACE STRESS TYPE
ESTIMATION
According to the purpose of our study described in in-
troduction, we propose a new method for stress type
estimation applicable with a high-generality. After
describing the points of the method, we will present
the results of its efficiency evaluation using the exper-
imental data, and validate its reliability regarding the
physiological indices database.
4.1 Estimation Method
The physiological indices that we should use for a
good estimation should meet the following two con-
HEALTHINF 2012 - International Conference on Health Informatics
56
ditions: the first is that they are able to reflect work-
place stress types, and the second is that they are
less prone to individual differences. To specify the
physiological indices set that achieve these condi-
tions, we performed a cross-validation with the avail-
able data-sets, and identified the combination of phys-
iological that result in the highest estimation accu-
racy. Here we used the leave-one-out cross-validation
(LOOCV) since we don’t need to tackle actually com-
putation performance issues and we still have a rela-
tively small number of samples in the data-set. In our
case, LOOCV involves using a single person data as
sample data for validation, and the remaining persons’
data as the sample data for training, which is repeated
such that each person’s data id used once as the vali-
dation data sample.
Accordingly, we have defined an original multi-
steps logic as shown on Figure 4, to perform
“individual-independent” stress-type estimation with
high accuracy. The first step aim at discriminating
with high accuracy stress status from and relax sta-
tus, in other words the presence of any workplace
stress. Once some stress reaction presence has been
detected, the second step consists in discriminating
normal stress and other workplace stress types, which
means identifying the harmfulness of the stress. Fi-
nally, if physiological indices are identified as reflect-
ing some extra stress, the third step consists in dis-
criminating the physiological reaction between ner-
vous stress and monotonous stress.
䋿
Step 1
Step 2
Step 3
Indices selection
for step 1
Indices selection
for step 3
Indices selection
for step 2
Relax
Normal
Monotonous
Nervous
End
Stress estimation start
Calculation of indices
Figure 4: Proposed multi-step estimation procedure with
integrated indices selection. It is composed of three steps to
gradually estimate the psychological status corresponding
to input physiological indices.
According to the results of significant difference
study between the three PASAT tasks, which requires
good task performance to guarantee reliable subjec-
tive evaluations, we selected 39 persons among the
whole participants (13 persons by PASAT task type).
For each selected participant, we extracted five data-
sets for each stress type, which that contain the phys-
iological indices during the five minutes of PASAT
(the last five minutes for PASAT2) extracted with a
one minute rolling window. Five data-sets for re-
lax status for each selected participant were also ex-
tracted in the same way. As a result, we obtain a train-
ing database filled with 390 data-sets, each represent-
ing the physiological reaction to one minute exposure
to relax (195 data-sets), normal stress (65 data-sets),
monotonous stress (65 data-sets), and nervous stress
(65 data-sets) situations.
Then, to evaluate our method in a first step inde-
pendently from the classification scheme adopted, we
tested 24 classification schemes among which Linear
Discriminant Analysis (LDA), Support Vector Ma-
chines (SVM), and so forth. At each step of the esti-
mation procedure and for each adopted classification
scheme, we identified and used the best set of physi-
ological indices (those less prone to individual differ-
ences).
4.2 Validation of the Method
We compared the following four methods combined
with cross validation based on the selected 39 partici-
pants to validate our multi-steps logic combined with
integrated physiological indices selection. The results
of comparison with other conventional methods are
shown on Figure 5, validating the efficiency of our
proposed method.
• Method 1 proceeds to only one discrimination
step, using only LF/HF index
• Method 2 proceeds to only one discrimination
step, using all provided physiological indices
• Method 3 proceeds to only one discrimination
step, using identified best physiological indices
• Method 4 proceeds to multi-step discrimination
with best physiological indices selection at each
step (our method)
4.3 Reliability Study of the Proposed
Stress Estimation Method
In previous paragraph we identified the physiological
indices that are less prone to individual differences.
However, as a condition to ensure reliability of the es-
timation using these physiological indices, it is neces-
sary to validate its application to stress estimation for
participants whose physiological indices were not in-
cluded into the training database. Precisely, we raised
the following three conditions as an assurance of re-
liability of the proposed workplace stress estimation
method.
WORKPLACE STRESS ESTIMATION METHOD BASED ON MULTIVARIATE ANALYSIS OF PHYSIOLOGICAL
INDICES
57
0.25 1.5 2.75
Estimation accuracy [%]
SVM
LDA Fuzzy
Gauss
Linear
0
20
40
60
80
Method 2Method 1 Method 3 Method 4
σ=
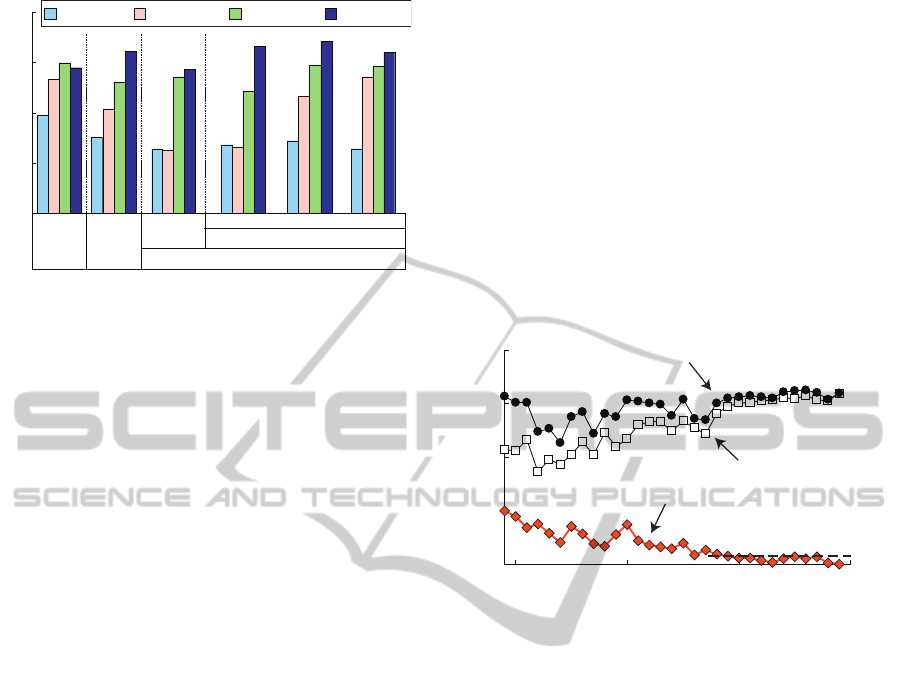
Figure 5: Estimation results for each method using different
classifiers. Regardless the classifier we can observe better
estimation accuracy for methods 3 and 4 than methods 1
and 2, validating the introduction of the process of best fit
physiological indices selection, as well as better estimation
accuracy for method 4 compared to method 3, validating the
added value of intelligent multi-step discrimination process.
• The average stress estimation accuracy for the 39
participants composing the database is high
• The standard deviation of the stress estimation
accuracy for the 39 participants composing the
database is low
• The selected set of physiological indices input
into the stress classification scheme does not be-
long to the trained database (low dependence on
database)
Accordingly, we selected three sets of physiologi-
cal indices combinations with high accuracy,and used
these three sets with the 24 classification schemes, re-
sulting in 72 possible classification schemes. Among
these we have investigated the classification schemes
that meet the defined reliability conditions, with a par-
ticular focus on the third one, which corresponds to
the dependence on the training database.
In the investigation process to index database de-
pendency criteria, we increased gradually from 9 to
39 the number of participants whose data are included
in the database. At each indentation, the maximum
estimation accuracy is calculated for each classifica-
tion scheme by leave-one-out cross-validation. For
each database size, the smaller the difference between
estimation accuracy using selected scheme and the
maximum accuracy is, the more robust the scheme is.
Indeed, a small difference means that selected scheme
would keep high estimation accuracy even with an
ever-growing database that will reflect more and more
human diversity.
In our study, we defined the reliability criterion
to be a difference in accuracy lower than 3%. The
difference between stress estimation accuracy using
below described method (Method A) and maximum
stress estimation accuracy method (recomputed each
time) reaches the required reliability criterion of 3%
when database is composed by data-sets from 29 par-
ticipants above 39 max participants (see Fig. 6).
• Classification scheme: SVM with Gaussian Ker-
nel (σ =2.75)
• Physiological indices selected for step 1: f
G
, | f
P
-
f
G
|, t
PAT
, T
F
, RRV
• Physiological indices selected for step 2: stdt
T
,
T
F
, LF/HF, HR
• Physiological indices selected for step 3: | f
P
-f
G
|,
t
E
, stdt
T
, t
PAT
, RRV, LF/HF
Estimation accuracy [%]
Participants number composing DB [-]
Max. accuracy
(SVM σ=2.75)
Method A
(SVM σ=2.75)
Difference
3%
0
20
40
60
80
10 20 30 40
Figure 6: Comparison of stress type discrimination ac-
curacy when database’s size changes, between selected
method (Method A) and method with highest accuracy re-
computed each time. It shows the result of reliability study
when using the classification scheme and physiological in-
dices set defined in Method A.
Then, we used this 29 participants’ database as the
reference, and calculated for all possible classification
schemes a reliability index U using equation 1. In
equation 1, x
1i
, x
2i
, and x
3i
, are respectively the aver-
age accuracy, the standard deviation of the accuracy,
and the database dependency of the adopted stress
classification schemes (i=1,2, ,72), which should re-
sult in positive values of U index for reliable classifi-
cation schemes, and small values of U index for non-
reliable schemes.
So, the classification scheme corresponding to the
highest U value is the one which characteristics are
described above. This classification scheme enables
an accuracy of 64% for the estimation of workplace
stress type reaction , and 89% for occurrence or not
of workplace stress reaction, standard deviation of
28%, and database dependence index of 29 (max 39).
In the opposite, classification scheme with lowest U
value, which uses a fuzzy logic algorithm, also en-
ables an accuracy of 64% for the estimation of work-
place stress type reaction, but with a standard devia-
HEALTHINF 2012 - International Conference on Health Informatics
58
U
i
=
x
1i
− x
1
q
1
N
∑
N
i=1
(x
1i
− x
1
)
2
)
−
x
2i
− x
2
q
1
N
∑
N
i=1
(x
2i
− x
2
)
2
)
−
x
3i
− x
3
q
1
N
∑
N
i=1
(x
3i
− x
3
)
2
)
(1)
Table 1: Best discrimination accuracy for stress presence and type depending on the method used.
Physiological LF/HF only All indices Best Indices Selection Best Indices Selection
Indices Used and Multi-steps Method
Stress Types 26% ±2% 48% ±8% 56% ±3% 63% ±5%
Stress Presence 63% ±1% 83% ±7% 87% ±3% -
tion of 36%, and a database dependence index of 37
(max 39), both very high.
This last point confirms that in our reliability in-
dex U, not only the average accuracy is dominant, but
it is also strongly influenced by standard deviation and
database dependency index.
5 CONCLUSIONS
In this research study we proposed a new method to
address the problem of influence of both individual
and stress type on physiological indices values. Based
on the collection of a large amount of physiologi-
cal data-sets under different stress types exposure, we
evaluated the efficiency of our method for accurate
stress type estimation by comparing it with other con-
ventional methods. Table 1 presents a detailed result
of efficiency analysis, showing that introducing the
process of best fit physiological indices selection, has
a great impact on stress reaction presence estimation
accuracy, while the addition of intelligent multi-step
discrimination process is essential to improve the ac-
curacy of workplace stress type estimation. In addi-
tion, these results were issued with data from 39 dif-
ferent participants in age and sex, demonstrating our
proposed method to be less prone to individual differ-
ences.
However, to achieve our goal of a system as shown
on Figure 7 for personal continuous stress monitoring
in daily life, we still have to tackle many issues among
which the ones we consider in priority are listed be-
low.
• Continue improving stress type discrimination ac-
curacy while limiting at best the number of sen-
sors worn
• Investigate the possibility to discriminate more
types of stress
• Investigate a method that enables to evaluate
quantitatively stress level
• Application of the proposed method to the estima-
tion of chronic stress
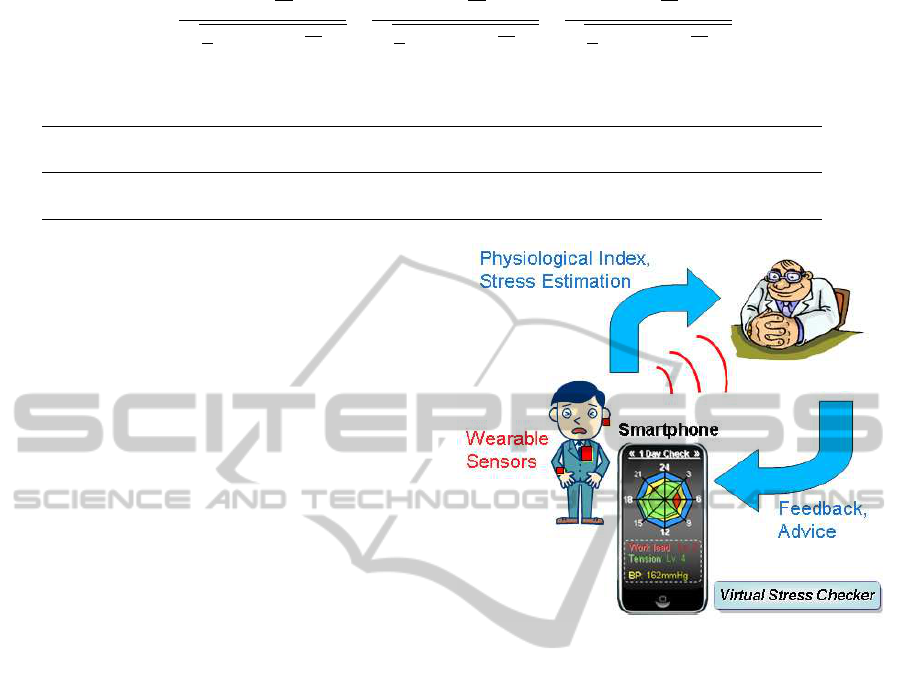
Figure 7: Schematic of the virtual stress checker system
that will implement our method. The wearable terminal col-
lecting sensor information communicates through network
connectivity with an online sub-system, at which detailed
processing and various feedback can be performed (Faudot
et al., 2010; Lopez et al., 2009).
ACKNOWLEDGEMENTS
This research was supported by Japan Science and
Technology Agency’s (JST) strategic sector for cre-
ation of advanced integrated sensing technologies for
realizing safe and secure societies: research project
on ”Developmentof a Physiological and Environmen-
tal Information Processing Platform and its Applica-
tion to the Metabolic Syndrome Measures”.
REFERENCES
Aasa, U., Kalezic, N., and Lyskov, E. (2006). Stress
monitoring of ambulance personnel during work and
leisure time. International Archives of Occupational
and Environmental Health, vol. 80, no. 1, pages 51–
59.
Akselrod, S., Gordon, D., Ubel, F., Shannon, C., C.Berger,
and Cohen, J. (1981). Power spectrum analysis of
WORKPLACE STRESS ESTIMATION METHOD BASED ON MULTIVARIATE ANALYSIS OF PHYSIOLOGICAL
INDICES
59

heart rate fluctuation: a quantitative probe of beat-to-
beat cardiovascular control. Science, vol. 10, pages
220–222.
Al’Absi, M., Bongard, S., and Buchanan, T. (1997). Car-
diovascular and neuroendocrine adjustment to pub-
lic speaking and mental arithmetic stressors. Psy-
chophysiology, vol. 34, no. 3, pages 266–275.
Al’Absi, M., Hatsukami, D., and Davis, G. L. (2005). At-
tenuated adrenocorticotropic responses to psycholog-
ical stress are associated with early smoking relapse.
Psychopharmacology, vol. 181, no. 1, pages 107–117.
Araki, S. and Kawakami, N. (1993). Health care work
stress: a review. Japanese Journal of Industrial
Health, vol. 35, pages 83–97.
Carroll, D., Phillips, A., and Balanos, G. (2009). Metabol-
ically exaggerated cardiac reactions to acute psycho-
logical stress revisited. Psychophysiology, vol. 46, no.
2, pages 270–275.
Faudot, T., Lopez, G., and Yamada, I. (October 11–13
2010). Information system for mapping wearable
sensors into healthcare services: Application to di-
etary habits monitoring. Proceedings of the 2nd In-
ternational Workshop on Web Intelligence and Virtual
Entreprise (WIVE10), held at the 11th IFIP Work-
ing Conference on Virtual Enterprises (PRO-VE’10),
Saint-Etienne, France.
Fukuda, O., Nagata, Y., Homma, K., and Tsuji, T. (2001).
Evaluation of heart rate variability by using wavelet
transform and a recurrent neural network. Proceed-
ings of the 23rd Annual International Conference of
the IEEE Engineering in Medicine and Biology Soci-
ety, vol. 2, pages 1769–1772.
Heidenreich, P., Ruggerio, C., and Massie, B. (1999). Ef-
fect of a home monitoring system on hospitalization
and resource use for patients with heart failure. Amer.
Heart J., vol. 138, no. 4, pages 633–640.
Itao, K. (Oct. 28–31 2007). Wearable sensor network con-
necting artifacts, nature, and human being. Proceed-
ings of the 6th Annual IEEE Conference on Sensors
(IEEE Sensors 2007), Keynote Presentation, pages
1120–1123.
Itao, K., Umeda, T., Lopez, G., and Kinjo, M. (Oct. 26–
29 2008). Human recorder system development for
sensing the autonomic nervous system. Proceedings
of the 7th Annual IEEE Conference on Sensors (Sen-
sors 2008), pages 423–426.
Jovanov, E., Price, J., Raskovic, D., Kavi, K., Martin, T.,
and Adhami, R. (Nov. 2000). Wireless personal area
networks in telemedical environment. Proceedings
of the 3rd Int. Conf. Inf. Technol. Biomed. (ITAB-
ITIS2000), pages 22–27.
Kim, D., Seo, Y., and Salahuddin, L. (2008). Decreased
long term variations of heart rate variability in sub-
jects with higher self reporting stress scores. Proceed-
ings of the 2nd International Conference on Pervasive
Computing Technologies for Healthcare, pages 289–
292.
Kotlyar, M., Donahue, C., and Thuras, P. (2008). Physiolog-
ical response to a speech stressor presented in a virtual
reality environment. Psychophysiology, vol. 45, no. 6,
pages 1034–1037.
Lopez, G., Shuzo, M., and Yamada, I. (7-9 October 2009).
New healthcare society supported by wearable sensors
and information mapping based services. 1st Interna-
tional Workshop on Web Intelligence and Virtual En-
treprise (WIVE’09). CD-Rom proceedings of the 10th
IFIP WG 5.5 Working Conference on Virtual Enter-
prises (PRO-VE 2009).
Miyake, S. (1997). Factors influencing mental workload
indexes. Journal of University of Occupational and
Environmental Health (J. UOEH). vol. 19, no. 4, pages
313–325.
Miyake, S. (2001). Multivariate workload evaluation com-
bining physiological and subjective measures. Inter-
national Journal of Psychophysiology, vol. 40, no. 3,
pages 233–238.
Ohsuga, M., Shimono, F., and Genno, H. (2001). Assess-
ment of phasic work stress using autonomic indices.
International Journal of Psychophysiology, vol. 40,
no. 3, pages 211–220.
Park, S. and Jayaraman, S. (2003). Enhancing the quality
of life through wearable technology. Engineering in
Medicine and Biology Magazine, IEEE, vol. 22, pages
41–48.
Schubert, C., Lambertz, M., and Nelesen, R. (2009). Effects
of stress on heart rate complexity-a comparison be-
tween short-term and chronic stress. Biological Psy-
chology, vol. 80, no. 3, pages 325–332.
Shimono, F., Ohsuga, M., and Terashita, H. (1998). Method
for assessment of mental stress during higt-tension
and monotonous tasks using heart rate, respiration and
blood pressure. The Japanese Journal of Ergonomics,
vol. 34, no. 3, pages 107–115.
Shin, J., Seongo, H., Cha, D., Yoon, Y., and Yoon, H.
(1998). Estimation of stress status using biosignal
and fuzzy theory. Proceedings of the 20th Annual
International Conference of the IEEE Engineering in
Medicine and Biology Society, vol. 3, pages 1393–
1394.
Soda, T. and Narumi, T. (2007). Assessment of physi-
cal and mental loads using power spectral analysis of
heart rate variability during dressing. Japan society of
Home Economics, pages 91–98.
Watanabe, T., Kokubo, H., Takazawa, K., and Kawano, K.
(2008). Psychophysiological changes during exposure
to natural and urban environments. Journal of Inter-
national Society of Life Information Science, vol. 26,
no. 1, pages 106–111.
Willemsen, G., Ring, C., and et al., D. C. (1998). Secre-
tory immunoglobulin a and cardiovascular reactions
to mental arithmetic and cold pressor. Psychophysiol-
ogy, vol. 35, no. 3, pages 252–259.
Yamada, S. and Miyake, S. (2007). Effects of long term
mental arithmetic on physiological parameters, sub-
jective indices and task performances. Journal of Uni-
versity of Occupational and Environmental Health (J.
UOEH), vol. 29, no. 1, pages 27–38.
HEALTHINF 2012 - International Conference on Health Informatics
60
