
KINECT AND SHIMMER SENSORS IN MOTION ANALYSIS
IN HEALTH APPLICATIONS
Katja Orlowski
1
, Harald Loose
1
, Karen Otte
1
, Sebastian Mansow-Model
2
and Angelina Thiers
1
1
Department of Computer Science and Media, Brandenburg University of Applied Sciences,
Magdeburger Str. 50, 14770 Brandenburg, Germany
2
gfnmediber GmbH, Sophie-Charlotten-Str. 92-94, 14059 Berlin, Germany
Keywords:
Motion and gait analysis, Kinect and SHIMMER sensors, Health applications (Geriatrics/Tinetti).
Abstract:
Motion capture systems based on different physical principles and sensor elements become moderate in price
and mobile in application. New application fields have been developed. Motion capture and analysis is used
in physiotherapy, geriatrics or public sports. In this paper three different types of motion capture systems are
investigated with respect to their adaptability to health applications: the OptiTrack-Motion Capture System,
the Kinect of Microsoft and SHIMMER sensors. Human gait was measured using all three systems and the
obtained data were compared. In further tests the gait of volunteers and patients were captured with Kinect
and two scores evaluating their motion capability were calculated.
1 INTRODUCTION
The story of gait analysis is very old and goes back
to the latter years of the 19th century. The German
medics Braune and Fischer performed different gait
studies, especially in the military environment fund-
ing the investigations. They analyzed the human gait
with photogrammetry. For a very long time pho-
togrammetry was the gold standard (Woltring, 1989;
Cappozzo and Tosi, 1989).
The data were taken manually from observations,
measuring various characteristics of walking patterns
like length, height or duration of one step, width of
one stride, the duration of the stance or the swing
phases. Perry described the normal and pathological
gait and developed the observing gait analysis (Gron-
ley and Perry, 1984; Perry, 1995; Perry, 2010; Goetz-
Neumann, 2003). Her research in gait analysis was
addressed to improve the lifestyle of handicapped pa-
tients (R. L. A. National Rehabilitation Center, 2009).
To automate the measurement, active and passive
markers were attached to well-defined positions. Two
dimensional kinematic analysis was realized, e.g. us-
ing 312 Hz LEDs as markers recorded by cameras
(Van Best, 1984).
Morris et al. (Morris and Lawson, 2009) re-
viewed and evaluated techniques, such as the use of
force plates (late 1960s), of accelerometers (1970s)
and the first motion capture systems (1980s). Their
overview included modern technologies like video
cameras, optoelectronic systems, electromyography
(EMG), force plates and shoes as well as inertia sen-
sors (accelerometers and gyroscopes).
Motion capture was performed using camera sys-
tems combined with other sensors. Nowadays mo-
tion capture systems use small ball-shaped markers.
Infrared cameras receive the reflected light transmit-
ted by LED rings. The 3D-positions of markers at-
tached to the human body are calculated using the
data from a number of different infrared (IR) cam-
eras. Alternatively to external vision systems, sen-
sors are directly attached to well-defined locations on
the human body. The data measured by accelerome-
ters and gyroscopes are transferred wireless, e.g. us-
ing Bluetooth connections, to the supervising com-
puter system. The SHIMMER package provides inte-
grated 9DoF (Degrees of Freedom) sensors including
3D-accelerometer, -gyroscope and -digital compass
as well as physiological sensors like EMG or elec-
trocardiography (ECG) (Shimmer, 2011). The 3D-
positions of the sensors are determined off-line, cal-
culating them step by step starting from their initial
3D-positions. Liu et al. (Liu, 2009) combined ac-
celerometer and gyroscope data for quantitative gait
analysis. Greene et al. (Greene, 2010) extracted tem-
poral gait parameters from the angular velocity of the
shank. Both papers discussed the necessity of re-
calibration during the evaluation and compared their
226
Orlowski K., Loose H., Otte K., Mansow-Model S. and Thiers A..
KINECT AND SHIMMER SENSORS IN MOTION ANALYSIS IN HEALTH APPLICATIONS.
DOI: 10.5220/0003769502260231
In Proceedings of the International Conference on Bio-inspired Systems and Signal Processing (BIOSIGNALS-2012), pages 226-231
ISBN: 978-989-8425-89-8
Copyright
c
2012 SCITEPRESS (Science and Technology Publications, Lda.)
results with optical motion capture systems.
Novel systems, like the Kinect
1
or Wii Remote
2
,
work without any markers. The Kinect uses a combi-
nation of a RGB camera and a depth sensor. The Wii
Remote is based on accelerometers and optical sen-
sors which is also used for motion capturing (Wang
and Huang, 2008).
Stationary technologies and expensive, high-end
equipment have been used already for a long time in
university hospitals, scientific institutes and speciali-
zed cinema studios for different purposes. Normal
hospitals, nursing homes, physiotherapy or popular
sports centers need well-performing, affordable and
mobile sensor systems to capture and analyze move-
ments sufficiently accurate. Automated procedures
can support physiotherapists, nurses and doctors in
geriatric care units as well as coaches in sports.
In this paper the OptiTrack-Motion Capture System,
the Kinect and SHIMMER sensors are investigated
with respect to their adaptability to health applica-
tions. A number of experiments was done to compare
the three systems in human gait analysis, to test the
Kinect and SHIMMER sensors for the evaluation of
motion capabilities as well as to record the execution
of sports exercises.
Which values have to be calculated from the mea-
sured data? Regarding to health applications the fol-
lowing values may be important:
• 3D-coordinates of the joint centers for the kine-
matic body motion analysis,
• joint angles for the analysis of joint mobility,
• length of one step and height of one swing, length
and width of one stride, walking velocity and oth-
ers like Tinetti (Tinetti, 1986) or fitness scores.
2 SYSTEMS AND METHODS
In this section the used systems are described and
methodological aspects of the locomotion model are
explained.
2.1 Motion Capture System (MoCap)
Optitrack
3
consists of 12 infrared cameras and two
different software applications: ’Arena’ for full body
motion capture and Tracking Tools for body rigging
with any desired number of tracking markers. All
cameras are active emitting infrared light via a LED
1
http://en.wikipedia.org/wiki/Kinect
2
http://en.wikipedia.org/wiki/Wii Remote
3
http://www.naturalpoint.com/optitrack/
circle around their lenses. The body markers are
highly reflective and the optical system is high sen-
sitive to the infrared spectrum. It is important that
each camera records solely the tracking markers of
the tracked person and not the infrared components
of the sunlight or the IR light emitted by the other
cameras. ’Arena’ records the input of all cameras si-
multaneously and computes a so-called point cloud in
real time. The computation needs some preprocess-
ing (calibration, T-pose, adjustment of the skeleton
model) (Nat. Point Inc., 2011). The recorded data can
be ”trajectorized”, i.e., converted into other formats
which includes all data of the model and the derived
tracking joint angles (bvh-file) or the 3D-positions of
the tracking markers (fbx-file).The major advantage
of vision systems is that the 3D-positions are deter-
mined continuously in the inertial coordinate system,
while a disadvantage is the restricted area of record-
ing mostly measuring less than 5 by 5 m.
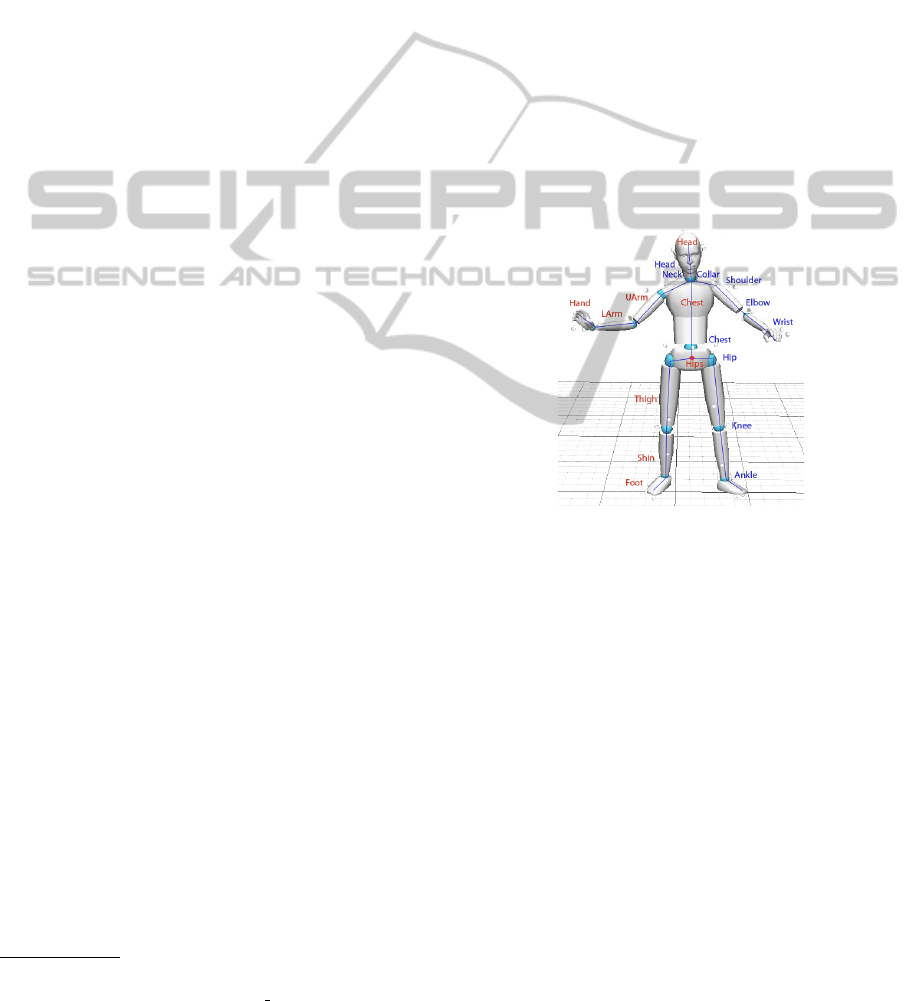
Figure 1: Human body model, markers, skeleton, names of
joints (blue) and links (red).
OptiTrack uses 34 markers attached to the hu-
man body (see Fig. 1). The 3D-positions of these
points are used to calculate the optimal set of the 3D-
positions of the centers and the 3D-angles of the 18
joints as well as the absolute 3D-position and orien-
tation of the reference point (placed on the hip). The
kinematical model of the locomotor system consists
of 23 rigid bodies (links) connected by 18 spheri-
cal joints. The fixed characteristics of the skeleton
are predefined during the calibration procedure. The
kinematical model is given by:
R
∗
k
= R
k
R
∗
v
k
, k = 1, . . . , 18 (1)
r
∗
k
= R
∗
k
r
k
+ r
∗
v
k
, k = 1, . . . , 18 (2)
where R
∗
k
is the absolute rotational matrix of link k, r
∗
k
the absolute position vector of the joint k, R
k
the rota-
tional matrix of the joint k, r
k
the dimension vector of
link k, v
k
the index of the predecessor and R
0
, r
0
the
orientation and position of the reference point/link.
KINECT AND SHIMMER SENSORS IN MOTION ANALYSIS IN HEALTH APPLICATIONS
227
The rotational matrix R
k
is calculated from the angles
of joint k using the well-known relationship:
R(α, β, γ) = M
γ
M
β
M
α
(3)
where M
α
, M
β
, M
γ
are the rotation matrices with α, β,
γ as joint angles around the x, y, z axes, respectively.
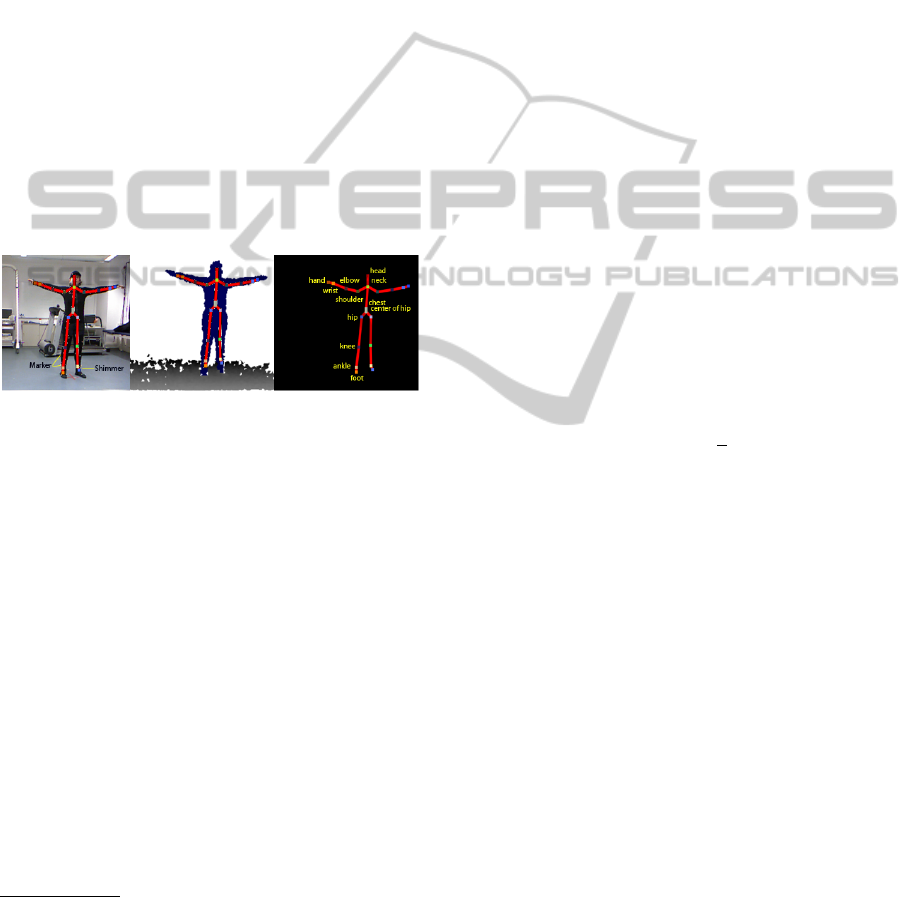
2.2 Microsoft Kinect Sensor (Kinect)
The Microsoft Kinect sensor system consists of the
depth sensor, the RGB camera, the microphone ar-
ray and the motor
4
. The software development kit
(SDK) for Windows 7
5
provides access to the raw
sensor data streams, the skeletal tracking and the au-
tomatic calibration. Using this kit C + +, C# or VB
applications can be developed . The skeletal tracking
immediately delivers the 3D-positions of 20 points on
a fictive skeleton (see Fig. 2). The characteristic di-
mensions of the skeleton (model) are determined dur-
ing calibration guided by the software
6
.
Figure 2: Video Stream (a), Depth Stream (b) and Skeleton
rendered in the full body (c) received from Kinect. In (a)
and (b) the skeleton is added, in (a) the position of some
markers used in MoCap and the Position of one SHIMMER
sensor are shown. In (c) the 20 skeleton points are named.
The joint angles are calculated from the 3D-
coordinates of the corresponding joints. For example,
the angle λ of the left knee is determined from vectors
v
KH
and v
AK
where v
KH
is directed from the knee to
the hip and v
AK
is directed from the ankle to the knee.
The cross product of both vectors shows the direc-
tion of the temporary joint axis e
k
and the normalized
product gives the sine of the joint angle λ:
v
AK
× v
KH
=
|
v
AK
||
v
KH
|
e
k
sinλ (4)
2.3 SHIMMER Sensors (SHIMMER)
The SHIMMER
7
platform is a wireless sensor plat-
form with a small form factor that supports mobile ap-
plications. All sensors are characterized by low power
4
http://en.wikipedia.org/wiki/Kinect
5
http://research.microsoft.com/en-us/um/redmond/-
projects/kinectsdk/default.aspx
6
http://www.primesense.com/
7
SHIMMER stands for ’Sensing Health with Intelli-
gence, Modularity and Experimental Reusability
consumption and weight. The measured data can be
stored off-line on a microSD or streamed in real time
using Bluetooth or 802.15.4 radio. SHIMMER offers
products for the categories kinematics (accelerome-
ter, gyroscope and magnetometer), biophysical (ECG,
EMG) and ambient (GPS). All sensors consist of
a baseboard and a daughterboard. The baseboard
acts as the main board with an on-board microcon-
troller, wireless communication modules, microSD
slot and an integrated three-axis accelerometer (Shim-
mer, 2011).
The calibration of the sensor can be executed
using the ’Shimmer 9DoF Calibration Application’
(Ferraris and Parvis, 1995). The streaming of up
to four sensors concurrently has been made possible
with the ’Four Shimmer Write’-program. This appli-
cation handles preprocessed data.
The vectors of the linear acceleration a, the angu-
lar velocity ω and the angles φ are measured in the
local coordinate system fixed to the 9DoF sensor and
to a fixed point on the surface of the body, respec-
tively. Starting at an initial point where the position
vector r
k
and the orientation matrix R
k
of each sensor
are well known, all values have to be calculated for
each sample. First, linear velocity v
∗
k+1
and motion
s
∗
k+1
, the angles α, β, γ and the local rotational matrix
R
∗
k
are determined in the current coordinate system
CS
k
on the base of the known values of the sample k:
v
∗
k+1
= a
∗
k
∆ + v
∗
k
s
∗
k+1
=
1
2
a
∗
k
∆
2
+ v
∗
k
∆ + s
∗
k
(5)
α = ω
1
∆, β = ω
2
∆, γ = ω
3
∆ (6)
R
∗
k
=
1 −γ β
γ 1 −α
−β α 1
(7)
where ∆ is the fixed sampling interval, k indicates the
number of the sample.
Second, the resulting values are transferred to the
updated coordinate system CS
k+1
and to the inertial
coordinate system CS
0
:
R
k+1
= R
∗
k
R
k
(8)
a
k+1
= R
∗
k
a
∗
k+1
+ g (9)
v
k+1
= R
∗
k
v
∗
k+1
s
k+1
= R
∗
k
s
∗
k+1
(10)
v
0
k+1
= R
k+1
T
v
∗
k+1
s
0
k+1
= R
k+1
T
s
∗
k+1
(11)
The major disadvantage of this method consists in the
accumulation of the measuring errors caused by noise
or drift. After some sampling time the system has to
be re-calibrated. For this purpose the data of the digi-
tal compass or other relationships (Greene, 2010; Liu,
2009) can be used. Knowing the positions and angles
of joints as well as the orientation of links in the loco-
motor model, derived values can be determined.
BIOSIGNALS 2012 - International Conference on Bio-inspired Systems and Signal Processing
228
3 EXPERIMENTS AND RESULTS
Two groups of experiments were made. In both sce-
narios the Kinect was placed in front of the subject
at the height of 88 cm and an inclination angle of 30
degree receiving the maximum area with 3 m length.
• The gait of various persons was registered simul-
taneously with MoCap, Kinect and SHIMMER
sensors. Two cycles of each person were captured.
A 9DoF SHIMMER sensor was fixed to each leg
above the ankle to measure the acceleration and
the angular velocity of the left and right shank.
On the base of the raw data described above some
gait parameters (motion of the feet, knee angle,
stance phases) were calculated, not using sophis-
ticated methods for filtering or re-calibrating data
during the evaluation process.
• The gait of 32 volunteers was recorded using the
Kinect sensor. Based on these data the Tinetti
score (Tinetti, 1986) was calculated and the walk-
ing was evaluated comparing the measured mo-
tion of the knee with patterns given by Perry and
Murray (Perry, 2010; Murray, 1964).
3.1 Comparison of MoCap and Kinect
Results
All results shown in this section were taken form one
collection of data selected from the test series. The
intention is to compare the principle features of the
three motion capture systems, not to give a statistical
evaluation.
Using MoCap and Kinect sensors motion data of
23 / 20 characteristic points were captured, while the
SHIMMER sensors recorded acceleration and angu-
lar velocity of both shanks. All characteristic points
are located in the center of the joints of the locomo-
tor models hidden inside the firmware. These models
and following the characteristic points are different
for MoCap and Kinect.
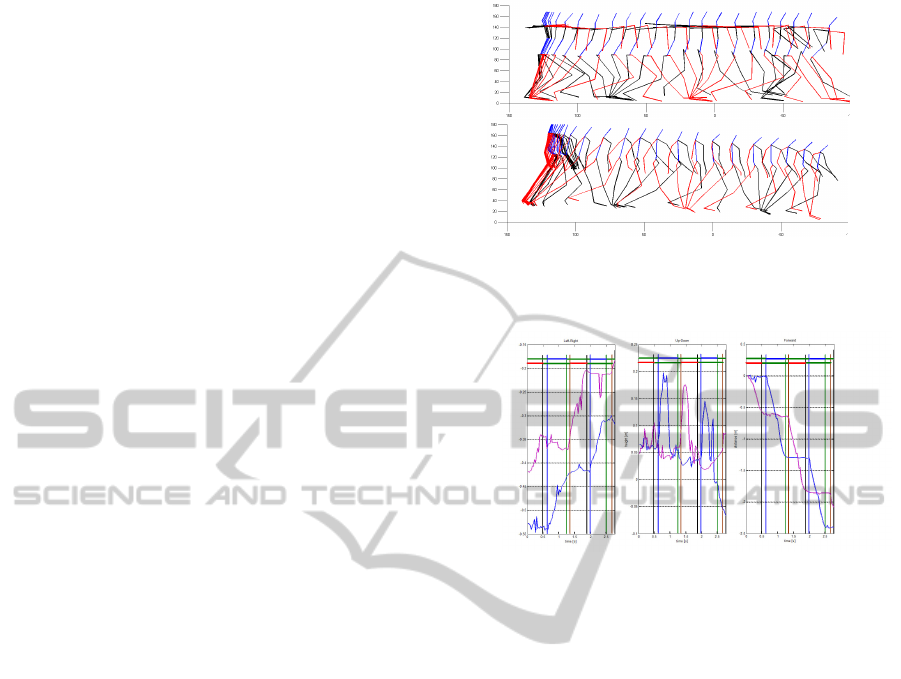
Figure 3 shows a step sequence of one test per-
son captured simultaneously with MoCap (100 Hz)
and Kinect (33 Hz). The similarity is obvious, the
differences are caused in different frequencies of rep-
resentation (10 to 6.7 Hz) and some effects resulting
from the inclination of the Kinect sensor which are
not fully compensated.
Figure 4 illustrates the motion of the left and the
right foot. Regardless the small noise and the drift of
the data the stance phases can be easily determined
manually from the forward motion or automatically.
Obviously the results meet the well-known features
that the stance phases of both feet overlap or that the
feet are raised during the swing phases.
Figure 3: Motion of the subject in the skeleton view (sagittal
plane): above captured with MoCap, below with Kinect;
green - left, red - right extremities.
Figure 4: Motion of the left (blue) and right (pink) foot (left
- left/right, center - up/down, right - forward) captured with
Kinect. At the top of the plots the alternating stance (green)
and swing (blue/red) phases for the left (above) and the right
(below) foot are marked.
3.2 Gait Analysis using Accelerometers
and Gyroscopes
As mentioned before the acceleration and angular ve-
locity of two 9DoF SHIMMER sensors were recorded
simultaneously to the MoCap and Kinect systems.
Figure 5 shows the acceleration of the left and right
shank in the inertial coordinate system after process-
ing the algorithm based on the formulas (5)-(11) with
compensation of the gravity force. Obviously 3 swing
phases of each leg were recorded. At the same time
the disruption of the x-component of the right shank
and the more or less strong drift of all curves should
be mentioned.
An algorithm similar to that proposed in (Greene,
2010) was applied to z-component of the angular ve-
locity. The calculated initial and terminal contact
points of the feet, are shown in Fig. 6. Peaks in ac-
celeration (x axis) are easy to identify. Each of them
represents one step of the left foot.
Figure 7 shows the motion of the left foot mea-
sured or calculated based on the data captured with
the MoCap, Kinect and SHIMMER sensors. The be-
KINECT AND SHIMMER SENSORS IN MOTION ANALYSIS IN HEALTH APPLICATIONS
229
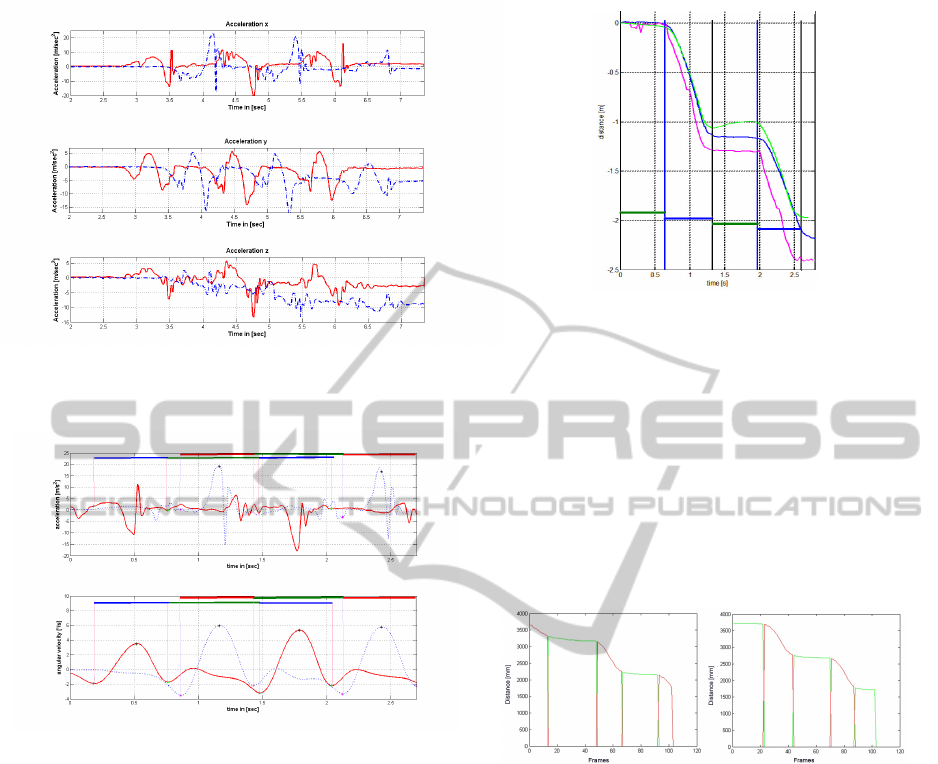
Figure 5: Accelerations of the left (blue, dotted) and right
(red) shank with gravity compensated in the inertial coordi-
nate system (x: direction of motion, y: vertical component).
Figure 6: Acceleration x and angular velocity z of the left
(blue, dotted) and right (red) shank. At the top of the plots
the alternating stance (green) and swing (blue/red) phases
are labeled. Initial and terminal contact points are marked
with pink and green asterisks, respectively.
havior of all three curves coincide. The determination
of the stance (green) and swing (blue) phases is possi-
ble. The common compromise is given in the figure.
Obviously there are significant differences between
the measured curves (MoCap, Kinect) and the result
of the calculation (SHIMMER) applying the formulas
(5)-(11).
3.3 Tinetti Score and Evaluation of
Walking
Determining the Tinetti score (Tinetti, 1986) it is pos-
sible to estimate the risk of falling for elderly persons.
The Tinetti test consists of a balance check and a gait
analysis. A score determination of the obtained data
was successful even if the scores weren’t always ac-
curate due to signal interferences. The method used
Figure 7: Motion of the left foot (blue: MoCap, red: Kinect,
green: SHIMMER). Common stance (green) and swing
(blue) phases are marked.
for gait analysis is based mainly on the aggregation of
selected parameters for the Tinetti test, as well as on
the correlation of captured knee angles with patterns
provided by Perry and Murray (Perry, 2010; Mur-
ray, 1964). The experimental setup where the Kinect
is placed in front of the observed person permits si-
multaneous tracking of both body halves with one
3D-sensor. The stance and swing phases are calcu-
Figure 8: Stance (green) and swing (red) phases detected by
the motion of the left and right foot.
lated using the foot coordinates combining informa-
tion of the velocity in the forward direction and the
foot height over the ground. The result is shown in
Fig. 8. The calculation of step length, width and
height is done similarly, providing the contents of the
Tinetti score.
The angles of the knee joints are determined using
formula (4) as well as the hip, knee and foot coordi-
nates. The quantified similarity of these angles with
the standard values of Perry and Murray provides an-
other score (correlation score).
Table 1 demonstrates the calculated values of
three test persons. All records were evaluated visually
(see column Q). The quality of the first record was es-
timated as good, while the other two were qualified as
rather bad. The third had the added flaw of too much
noise.
Table 2 represents the calculated Tinetti scores of
BIOSIGNALS 2012 - International Conference on Bio-inspired Systems and Signal Processing
230

the test persons with the maximum score of 5. The
first two subjects achieved a very good score. Both
obtained full marks from the length score and had
small cuts either in the height or width score. Sub-
ject three (FH1n) only achieved the maximum score
in the width. The overall score is average.
Table 1: Evaluation of three records based on Tinetti algo-
rithm (Q = quality of record, L = step length, H
r
= height
right foot, H
l
= height left foot, W = step width).
Name Q L H
r
H
l
W
[mm] [mm] [mm] [mm]
10442 good 613 42 46 200
599 50 165
94599 bad 736 55 36 131
663 182
FH1n noisy, 15 26 59 161
bad 674 80 116 148
558 190
Table 2: Calculated scores based on Tinetti.
Name Score Score Score Score
L H W total
10442 2 2 0.5 4.5
94599 2 1.5 1 4.5
FH1n 1.67 1.25 1 3.91
The classifier based on Tinetti and correlation
score was applied to 32 test subjects aged 22 to 57.
More than half of the tracking sessions were affected
by signal noise or a short walking range. Anyway
72% of the test persons were classified as normal.
4 CONCLUSIONS
The results of the two groups of experiments promise
that both mobile sensor systems (Kinect, SHIMMER
sensors) will fulfill the requirements of health appli-
cations regarding the costs and accuracy. Maybe each
of them will be considered satisfactory or in some ap-
plication they will be used in combination.
The investigation has shown that the accuracy of
the Kinect and the SHIMMER sensors are compara-
ble to the MoCap system. Gait cycles like stance and
swing phases can be determined well.
The calibration of the setup of all three systems
is very important for the quality of the measured
data. Further development will be focused on the
preprocessing of the raw data to eliminate the in-
fluence of noise, runaway values, offsets and drifts,
on the calculation algorithms to improve differenti-
ation/integration and to detect gait characteristics as
well as to check the reliability of the systems. Adap-
tive procedures to recalibrate data during measure-
ment or calculation based on correlation between e.g.
acceleration and angular velocity of a foot will be in-
vestigated. The use of both sensors to special health
applications like the Tinetti test will be continued.
REFERENCES
Cappozzo, A.; Marchetti, M. and Tosi, V., editors (1989).
Biolocomotion: A Century of Research Using Moving
Pictures.
Ferraris, F; Grimaldi, U. and Parvis, M. (1995). Procedure
for effortless in-field calibration of three-axis rate gy-
ros and accelerometers. Sens. Mater, 7:311–330.
Goetz-Neumann, K. (2003). Gehen verstehen - Ganganal-
yse in der Physiotherapie. Thieme Verlag.
Greene, B. (2010). An adaptive gyroscope-based algorithm
for temporal gait analysis. Med Biol Eng Comput,
48:1251–1260.
Gronley, J. and Perry, J. (1984). Gait analysis techniques.
Physical Therapy, 64, Number 12:1831–1838.
Liu, T. (2009). Deveopment of a wearable sensor system for
quantitative gait analysis. Measurement, 42:978–988.
Morris, R. and Lawson, S. (2009). A review and evalua-
tion of available gait analysis technologies, and their
potential for the measurement of impact transmission.
Shock.
Murray, M. (1964). Walking patterns of normal men. J
Bone Joint Surg Am, 46A:335 – 360.
Nat. Point Inc., e. (2011). Natual point arena documen-
tation. http://www.naturalpoint.com/optitrack/sup-
port/manuals/.
Perry, J. (2010). Gait Analysis - Nomral and Pathological
Function. Slack Inc.
Perry, J. e. a. (1995). Classification of walking handicap in
the stroke population. Stroke, 26:982–989.
R. L. A. National Rehabilitation Center, E. (2009). Jacque-
lin perry, m.d. http://www.rancho.org/md perry.htm.
Shimmer, editor (2011). Wireless Sensing Solution.
http://shimmer-research.com.
Tinetti, M. E. (1986). Performance-oriented assessment of
mobility problems in elderly patients. Journal of the
American Geriatrics Society, 34:119–126.
Van Best, J. (1984). A method for two dimensional
multi-segmental kinematic and kinetic analysis of nor-
mal and pathological human gait. Medical Progress
through Technology, 10:143–159.
Wang, B. and Huang, D. (2008). Low-cost motion captur-
ing using nintendo wii remote controllers. CSC2228
Project Report.
Woltring, H. (1989). One hundred years of photogramme-
try in biolocomotion. In Cappozzo, A.; Marchetti, M.
and Tosi, V., editors, Biolocomotion: A Century of Re-
search Using Moving Pictures, chapter 11. Proceeding
of the Symposium on Biolocomotion.
KINECT AND SHIMMER SENSORS IN MOTION ANALYSIS IN HEALTH APPLICATIONS
231
