
STUDY OF PROTEIN STRUCTURE ALIGNMENT PROBLEM
IN PARAMETERIZED COMPUTATION
Cody Ashby
1
, Kun Wang
2
, Carole L. Cramer
3
and Xiuzhen Huang
∗4
1
MBS PhD Program, Arkansas State University, Jonesboro, AR, U.S.A.
2
Bioinformatics PhD Program, University of Arkansas at Little Rock, Little Rock, AR, U.S.A.
3
Arkansas Bioscience Institute, Dept. of Biology, Arkansas State University, Jonesboro, AR, U.S.A.
4
Computer Science Dept., Arkansas State University, Jonesboro, AR, U.S.A.
Keywords:
Protein structure-structure alignment, Color coding, Parameterized computation, Maximum common sub-
graph.
Abstract:
Motivated by the practical application of protein structure-structure alignment, we have studied the problem of
maximum common subgraph within the framework of parameterized complexity. We investigated the lower
bound for the exact algorithms of the problem. We proved it is unlikely that there is an algorithm of time
p(n,m) ∗ k
o(m)
for the problem, where p is a polynomial function, k is a parameter of map width, and m and n
are the numbers of vertices of the two graphs respectively. In consideration of the upper bound of p(n,m)∗ k
m
based on the brute-force approach, our lower bound result is asymptotically tight. Although the algorithm with
the running time p(n,m) ∗ k
m
could not be significantly improved from our lower bound result, it is still pos-
sible to develop efficient algorithms for the practical application of the protein structure-structure alignment.
We developed an efficient algorithm integrating the color coding method and parameterized computation for
identifying the maximum common subgraph of two protein structure graphs. We have applied the algorithm
to protein structure-structure alignment and conducted experimental testing of more than 600 protein pairs.
Our parameterized approach shows improvement in structure alignment efficiency and will be very useful for
structure comparisons of proteins with large sizes.
1 INTRODUCTION
Protein three-dimensional structure is critical for its
correct function and important roles in the living cell.
For example, enzymes rely on their active sites ter-
tiary structures to bind to different substrates and lig-
ands must effectively recognize and bind to their tar-
gets based on structural as well as chemical interac-
tions. There are experimental techniques such as X-
ray crystallography and NMR spectroscopy for pro-
tein three-dimensional structure determination, which
could provide protein structures at the atomic reso-
lution. Protein structures in the current RCSB Pro-
tein Data Bank (PDB) are typically obtained by X-
ray crystallography or NMR spectroscopy and sub-
mitted by biologists and biochemists from around the
world. About 90% of the protein structures in the
PDB were determined by X-ray crystallography, and
10% by NMR. As of Tuesday Mar 15, 2011, there are
71794 protein structures stored in PDB. Comparing
protein three-dimensional structures will reveal im-
∗
The corresponding author: xhuang@astate.edu.
portant function relationship between the proteins and
imply the evolutionary relationship of the proteins.
Structure comparison and alignment software could
also be applied to evaluate the quality of the models
of protein tertiary structure prediction (Zhang et al.,
2005), where the predicted theoretical models and the
known experimental structures are compared.
There are many structure comparison and align-
ment algorithms and software developed in this field,
which are based on various alignment models, such
as backbone atom (C
α
) alignment, secondary struc-
ture elements alignment, sequence-based alignment,
contact map and Connolly’s molecular surface align-
ment. Readers are referred to (Xu et al, 2007; Zhang
et al., 2005; Comin et al., 2004; Holm et al., 1993;
Caprara et al., 2002; Lancia et al., 2003; Lemmen et
al., 2000). Still it is very challenging to conduct ef-
ficient protein structure-structure alignment for pro-
teins of large sizes.
In this research, we focus on the the structure com-
parison of two proteins and work on developing of
more efficient computational approaches and effec-
tive evaluation for the structure-structure alignment of
174
Ashby C., Wang K., L. Cramer C. and Huang X..
STUDY OF PROTEIN STRUCTURE ALIGNMENT PROBLEM IN PARAMETERIZED COMPUTATION.
DOI: 10.5220/0003769701740181
In Proceedings of the International Conference on Bioinformatics Models, Methods and Algorithms (BIOINFORMATICS-2012), pages 174-181
ISBN: 978-989-8425-90-4
Copyright
c
2012 SCITEPRESS (Science and Technology Publications, Lda.)

two proteins. Our computationalapproach is based on
a topological graph comparison model and integrates
the color coding methods and the idea of parameter-
ized computation. We introduce a new evaluation cri-
teria of core coverage for evaluating structure align-
ments based on alignments of secondary structure el-
ements. Besides the protein structure-structure align-
ment, many practical applications in bioinformatics
and computational biology could be modeled as the
comparison of graphs. In this paper, we first study the
parameterized complexity of the problem MAXIMUM
COMMON SUBGRAPH of two graphs. This study can
be extended to different variants of the problems in
different applications.
2 PRELIMINARIES OF
PARAMETERIZED
COMPLEXITY
We first give a brief review on parameterized com-
plexity theory and some recent progress on parame-
terized intractability. A parameterized problem Q is a
decision problem consisting of instances of the form
(x,k), where the integer k ≥ 0 is called the parame-
ter. The parameterized problem Q is fixed-parameter
tractable (Downey et al., 1999) if it can be solved
in time f(k)|x|
O(1)
, where f is a recursive function.
Note that in this paper, we always assume that com-
plexity functions are “nice” with both domain and
range being non-negative integers and the values of
the functions and their inverses can be easily com-
puted. Certain NP-hard parameterized problems, such
as VERTEX COVER, are fixed-parameter tractable, and
hence can be solved practically for small parameter
values. On the other hand, the inherent computational
difficulty for solving many other NP-hard parameter-
ized problems with even small parameter values has
motivated the theory of fixed-parameter intractabil-
ity (Downey et al., 1999). The W-hierarchy
S
t≥1
W[t]
has been introduced to characterize the inherent level
of intractability for parameterized problems. Exam-
ples of W[1]-hard problems include problems such
as CLIQUE and DOMINATING SET. It has become
commonly accepted that no W[1]-hard problem can
be solved in time f(k)n
O(1)
for any function f, i.e.,
W[1] 6= FPT. W[1]-hardness has served as the hypoth-
esis for fixed-parameter intractability.
Note that investigation (Chen et al, 2006) has de-
rived stronger computational lower bounds for well-
known NP-hard parameterized problems. For exam-
ple, for the CLIQUE problem, which asks if a given
graph of n vertices has a clique of size k, it is proved
that unless an unlikely collapse occurs in parameter-
ized complexity theory, the problem is not solvable in
time f(k)n
o(k)
for any function f. Note that this lower
bound is asymptotically tight in the sense that the triv-
ial algorithm that enumerates all subsets of k vertices
in a given graph to test the existence of a clique of size
k runs in time O(n
k
).
3 PARAMETERIZED LOWER
BOUND FOR MAXIMUM
COMMON SUBGRAPH
We derive the lower bounds for the exact algorithms
for the parameterized versions of the MAXIMUM
COMMON SUBGRAPH problem. We first give the for-
mal parameterized versions of the problem.
Definition. The MCS
k
problem:
Instance: Source graph H with m vertices, host graph
G with n vertices, and a map scheme M of map width
k.
Parameter: k, s, where k, 0 ≤ k ≤ n, is the map width
and s, 0 ≤ s ≤ m is the size of the common subgraph.
Question: is there a common subgraph G
′
with s
vertices of graphs H and G?
In the above definition, we use the notion of map
scheme introduced by Song et al. in (Song et al.,
2006).
Definition. A map scheme M between H and G is a
binary relation M ⊆ V(H) ×V(G). The correspond-
ing map set M(v) of a vertex v ∈ V(H) is defined as
{u : (v,u) ∈ M}. M is said to have map width k if
|M(v)| ≤ k for every v ∈ V(H). Apparently k ≤ n,
where n = |V(G)|. M is called well-formed if for
every (v
1
,v
2
) ∈ E(H), there exist u
1
∈ M(v
1
) and
u
2
∈ M(v
2
) such that (u
1
,u
2
) ∈ E(G).
The following results on the parameterized com-
plexity of the parameterized problems are known:
• The MCS
k
problem is solvable with a brute-force
approach in time p(n,m) ∗ k
m
, where p is a poly-
nomial function, k is the map width, and m and
n are the numbers of vertices of the source graph
and the host graph respectively .
• The general parameterized MCS problem is W[1]-
hard (Huang, 2006). For the general parameter-
ized MCS problem, there is no parameterized al-
gorithms of running time f(s) ∗ (max(n,m)
o(s)
)
for any function f, unless there is an unlikely col-
lapse in parameterized complexity (Huang, 2006).
STUDY OF PROTEIN STRUCTURE ALIGNMENT PROBLEM IN PARAMETERIZED COMPUTATION
175

We prove the following lower bound result for the
parameterized MCS
k
problem.
Theorem 3.1. The MCS
k
problem has no algorithm
of time p(n,m) ∗ k
o(m)
, where p is a polynomial func-
tion, k is the map width, and m and n are the numbers
of vertices of the source graph and the host graph re-
spectively, unless the ETH (exponential time hypothe-
sis) fails (i.e., all SNP problems are solvable in subex-
ponential time).
Note that the class SNP introduced by Papadim-
itriou and Yannakakis (Papadimitriou et al., 1991)
contains many well-known NP-hard problems in-
cluding, for any fixed integer q ≥ 3, CNF q-
SAT, q-COLORABILITY, q-SET COVER, and VERTEX
COVER, CLIQUE, and INDEPENDENT SET (Impagli-
azzo et al., 2001). It is commonly believed that
it is unlikely that all problems in SNP are solvable
in subexponential time. A recent result showed the
equivalence between the statement that all SNP prob-
lems are solvable in subexponential time, and the col-
lapse of a parameterized class called Mini[1] to FPT
(Downey et al., 2003).
In order to prove the theorem, we will prove the
following lemma first.
Lemma 3.2. The MCS
k
problem has no algorithm of
time p(n,m)∗ k
o(m)
, where p is a polynomial function,
k is the map width, and m and n are the numbers of
vertices of the source graph and the host graph re-
spectively, unless the 3SAT problem with n
′
variables
and m
′
clauses can be solved in time O(2
o(m
′
)
).
Proof. We prove the lemma through a reduction from
3SAT to the MCS
k
problem. This reduction is adapted
from the polynomial time reduction in (Song et al.,
2006). Given a Boolean formula φ in the conjunctive
normal form
φ = (l
1
1
W
l
1
2
W
l
1
3
)
V
(l
2
1
W
l
2
2
W
l
2
3
)
V
...
V
(l
m
′
1
W
l
m
′
2
W
l
m
′
3
)
we construct two graphs, H
φ
, G
φ
and map scheme M
φ
as follows: H
φ
contain m
′
vertices, v
1
,..., v
m
′
, forming
a clique. G
φ
contains 3m
′
vertices, one for every lit-
eral occurrence in formula φ in which two vertices u
s
i
and u
t
j
corresponding to l
s
i
and l
t
j
form an edge if s 6= t
and l
s
i
, l
t
j
are not complementary literals. The map
scheme M
φ
is defined as M
φ
= u
r
1
,u
r
2
,u
r
3
,r = 1,...,m
′
.
It is not difficult to verify that formula φ is satisfi-
able if and only if there is a clique subgraph in G
φ
which is isomorphic to H
φ
and the isomorphism is
constrained by map scheme M
φ
with the map width
k = 3. This reduction can be done in time p(n
′
,m
′
).
Therefore, if the MCS
k
problem has an algorithm of
time p(n
′
,m
′
) ∗ k
o(m
′
)
, then the 3SAT problem with
n
′
variables and m
′
clauses can be solved in time
O(2
o(m
′
)
). The Theorem is proved.
Through a close study of the reduction, we can see
that this reduction is a linear fpt-reduction (Chen et al,
2006). Therefore, if MCS
3,m
is subexponential-time
solvable, then 3SAT is subexponential-time solvable,
which indicates that ETH (exponential time hypothe-
sis) fails.
Lemma 3.3. The 3SAT problem with n
′
variables and
m
′
clauses can be solved in time O(2
o(m
′
)
) if and only
if it can be solved in time O(2
o(n
′
)
).
Lemma 3.4. The 3SAT problem with n
′
variables and
m
′
clauses could not be solved in time O(2
o(n
′
)
) unless
the ETH fails (i.e., all SNP problems are solvable in
subexponential time).
By combining the above Lemma 3.2, Lemma 3.3
and Lemma 3.4, the Theorem 3.1 is proved. This
theorem shows that the algorithm for the MCS
k
prob-
lem with running time p(n, m)∗ k
m
based on the brute
force approach could not be significantly improved,
where p is a polynomial function, k is the map width,
and m and n are the numbers of vertices of the source
graph and the host graph respectively. In considera-
tion of the upper bound of p(n, m) ∗ k
m
for the prob-
lem, we point out that the lower bound results for the
problem presented here is asymptotically tight.
4 EFFICIENT ALGORITHM FOR
PROTEIN STRUCTURE
ALIGNMENT
In the previous section, we have proved the asymptot-
ically tight lower bound result for the MCS
k
problem.
Although the algorithm with running time p(n,m) ∗
k
m
based on the brute force approach could not be sig-
nificantly improved, it is still possible to develop ef-
ficient algorithms for practical emerging applications.
Here we develop an efficient algorithm integrating the
color coding method (Alon et al., 2002) and the idea
of parameterized computation (Downey et al., 1999)
for the problem of MAXIMUM COMMON SUBGRAPH
with applications in protein structure-structure align-
ment.
4.1 Protein Structure Graphs
There are three levels of protein structures: primary
sequence, secondary structure and tertiary structure.
We use two proteins with PDB codes 1llda (chain A
of allosteric L-lactate dehydrogenase from Bifidobac-
terium longum) and 6ldh (M4 apo-lactate dehydroge-
nase from the spiny dogfish, Squalus acanthius), from
the Lindahl benchmark data set (Lindahl et al., 2000)
BIOINFORMATICS 2012 - International Conference on Bioinformatics Models, Methods and Algorithms
176

as examples in our study. The protein data bank web-
site (http://www.pdb.org/pdb/) provides the informa-
tion of the three levels of the two proteins.
We build mixed structure graphs for the proteins
using the PDB files supplementedwith additional data
generated by DSSP (Kabsch et al., 1993). Directed
and undirected edges and two types of vertices of the
mixed structure graph are constructed as follows.
• Convert all regions that contain more than four
amino acids that form a secondary structure (an
alpha helix or beta sheet) into a vertex in the graph
that does not include the first and last amino acid
from the region. These are referred to as core re-
gions.
• Build directed edges between the core regions as
they appear sequentially in the protein.
• Build undirected edges between core regions that
are within seven Angstroms of each other.
The construction of the mixed structure graphs are
similar to the protein structure graphs in (Song et al.,
2006). The difference is that for our graph model we
distinguish between the differenttypes of core regions
using two different types of vertices in the graph. Re-
fer to the structure graphs in Figures 1 and 2 for pro-
teins 1llda and 6ldh.
1 2 3 4 5 6 7
Figure 1: Structure graph for 1llda. Alpha helix regions are
represented by circles and beta sheet cores are represented
by squares. (The maximum common subgraph is illustrated
in red).
1 2 3 4 5 6 7 8 9 10
Figure 2: Structure graph for 6ldh. Alpha helix regions are
represented by circles and beta sheet cores are represented
by squares. (The maximum common subgraph is illustrated
in red).
4.2 Structure Alignment based on
Maximum Common Subgraph
After we build the two mixed structure graphs to rep-
resent two protein structures, we design efficient al-
gorithms which incorporate the color coding method
(Alon et al., 2002) and parameterized computation
(Downey et al., 1999). We use an iterative approach
to find the common subgraphs of the two structure
graphs and then, based on the identified common sub-
graphs, build the structure alignment of the two pro-
teins.
The following is a brief description of our MCS
algorithm based on color coding and parameterized
computation for finding the common subgraphs of the
two protein structure graphs.
1. Preprocess the two structure graphs G and H us-
ing known secondary structure information. For
each vertex v of G, it can align with k vertices of
H, where k is the statistical cutoff.
2. Compare the size of G and H, choose the smaller
one as graph S, the bigger one as the graph B. Let
s be the size of the vertex set of S.
3. With the color coding method, we get a valid col-
oring of size s of the vertices of B. Each valid
coloring of s vertices makes a subgraph S
s
of the
graph B. We compare S
s
and S to see if they are
isomorphic to each other.
We output all these subgraphs to the pool and go
to step 5. If we cannot find a subgraph of size s
that is isomorphic to S, go to step 4.
4. Decrease the value of s by 1. Then we get dif-
ferent subgraphs of size s from S with the color
coding method. Then for every subgraph, go to
step 3.
5. Use the score scheme in (Xu et al., 2006) to evalu-
ate the subgraphs in the pool. Output the common
subgraph with the best score in the pool.
6. Iteratively find the common subgraphs of the re-
maining parts of the two structure graphs.
When we align two structure graphs G and H, we
need a mapping from the vertex set of n vertices of
the graph G to the vertex set of s vertices of the graph
H. The idea is to randomly pick s vertices from both
vertex sets of G and H with the color coding method.
Then we compare the two corresponding subgraphs
of size s to see if they are isomorphic to each other.
Since in the structure graph there is a directed path to
indicate the linear order of the vertices, it is easy to
compare the directed edges. For the structure com-
parison of the two subgraphs, we need to make sure
the corresponding undirected edges match.
There are two important ideas in the color-coding
method that we have applied: random orientations
and random colorings. An easy way of achieving ran-
dom orientations is by choosing a random acyclic ori-
entation of the graph G. We can obtain it by choosing
a random permutation π: the vertex set V → 1, ...,|V|
and directing an edge (u, v) ∈ E from u to v if and
only if π(u) < π(v). Random colorings is to choose
a random coloring of the vertices of G with s colors.
STUDY OF PROTEIN STRUCTURE ALIGNMENT PROBLEM IN PARAMETERIZED COMPUTATION
177

>Alignment of 1llda-d1llda2.4_92_1_1_A_struct.txt and 6ldh-d1ldm_2.4_92_1_1_struct.txt
Structure1: ---TNLDSARLRFLIAQQTGVNVKNVHAYIAGEHGDSEVPLWESATIGGVPMSDWTPLPGHDPLDADKREEIHQEVKNA
Structure2: GSGCNLDSARFRYLMGERLGVHSCSCHGWVIGEHGDSVPSVWSGMNVASIKL---HPLDGTNK-DKQDWKKLHKDVVDS
Structure1: AYKIINGKGATNYAIGMSGVDIIEAVLHDTNRILPVSSMLKDFHGISDIC-MSVPTLLNRQGVNNTINTPVSDKELAAL
Structure2: AYEVIKLKGYTSWAIGLSVADLAETIMKNLCRVHPVSTMVKDFYGIKDNVFLSLPCVLNDHGISNIVKMKLKPNEEQQL
Structure1: KRSAETLKETAAQFGF-
Structure2: QKSATTLWDI--QKDLK
Figure 3: Two dimensional alignment of two protein structures 1llda and 6ldh.
A path in G is said to be colorful if each vertex on it
is colored by a distinct color. A colorful path in G is
clearly simple.
For the de-randomized process, we need a list of
colorings of the vertex set V such that for every subset
V
′
⊆ V, where |V
′
| = s, there exists a coloring in the
list that gives each vertex in V
′
a distinct color. In
other words, it is a map from the vertex set V of n
vertices to the subgraph vertex set of s vertices. We
keep the colorings that are colorful and also there is
a set of color number (from 1 to s) in the increasing
order. In this way we can make sure the orientation of
all the directed edges are right.
4.3 Experimental Testing for Protein
Structure-Structure Alignment
We first illustrate our approach through the structural
alignment of the two proteins 1llda and 6ldh. Figure
3 and 4 shows the maximum common subgraph of the
two structure graphs.
Each pair of matched cores ({1,1}, {2,2}, {3,3},
{4,4}, {6,5}, {7,9}) are aligned against each other
via pairwise alignment. The regions around them are
also aligned by pairwise alignment, keeping sequen-
tial flow of the two proteins in mind. These align-
ments are combined into one alignment that repre-
sents a structural alignment between the two proteins
(Figure 3).
This structural alignment was used as input into
a MODELLER (Fiser et al., 2003) script to super-
position 6ldh onto 1llda. The resulting models were
then visualized using PyMOL (Delano, 2002) (refer
to Figure 4). Given two proteins, p1 and p2, p1
c
is the number of cores in p1, p2
c
is the number of
cores in p2 and MCS
n
is the size of the common
subgraph, the core coverage is a percentage defined
by: MCS
n
/min(p1
c
, p2
c
). The structure alignment of
6ldh and 1llda has a core coverage of 71.43%.
We test our structure alignment approach through
conducting protein structure-structure alignments of
more than 600 pairs of proteins of the Lindahl bench-
Figure 4: Structure alignment of 6ldh (green) and 1llda
(blue), with a core coverage of 71.43%.
mark data set(Lindahl et al., 2000). Please refer to
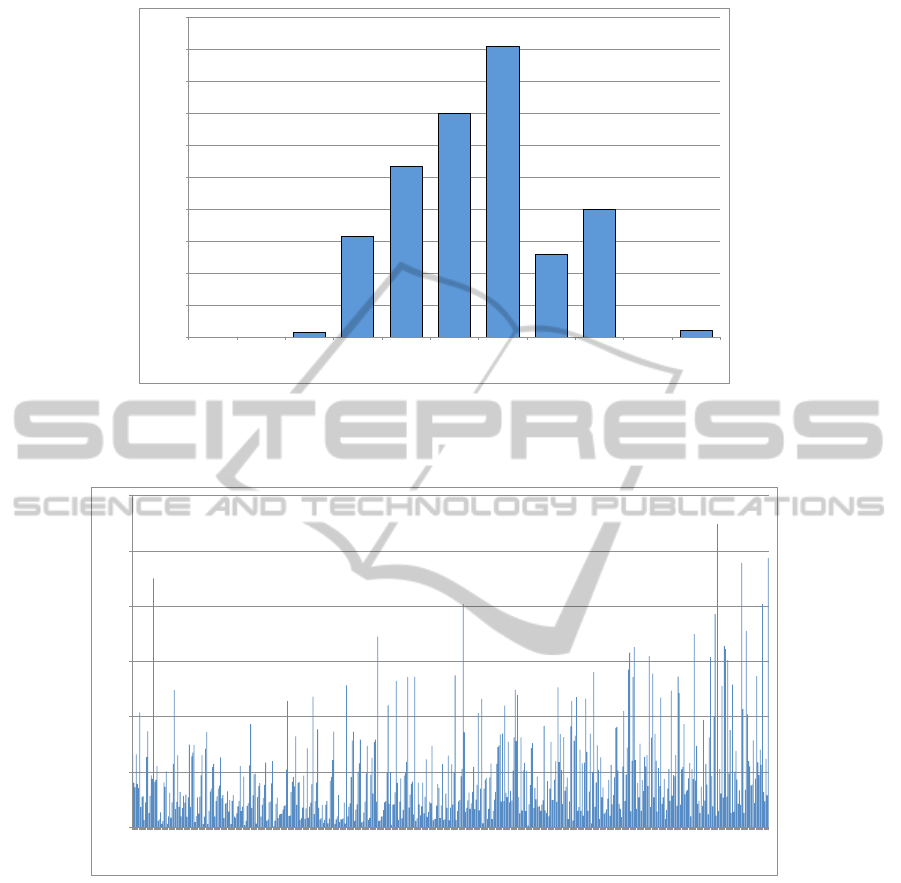
Figure 5 for core coverage distributions, Figure 6 for
running time distribution (of proteins with the num-
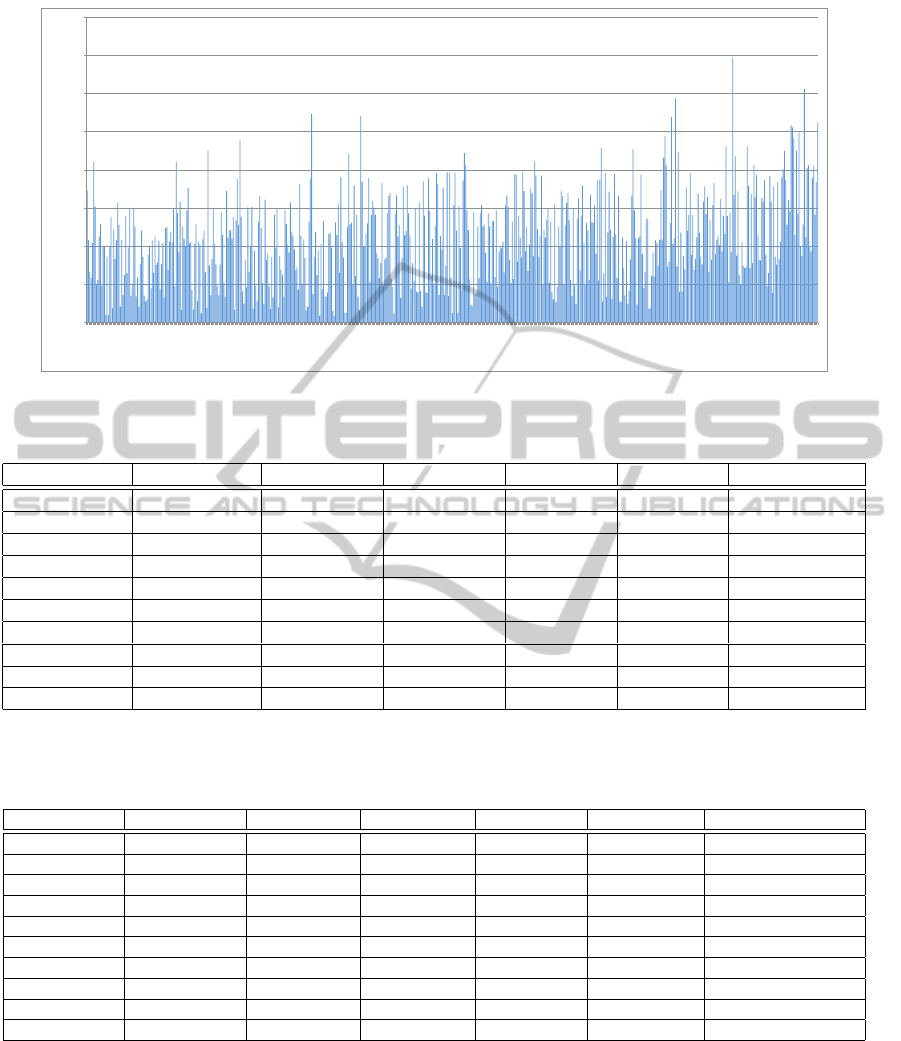
ber of cores larger than 5) and Figure 7 for RMSD
distribution of structure alignments for 631 protein
pairs. Figure 5 and Table 1 shows that our approach
achieves a high rate of core coverage. From Figure 6
of the running time distribution of the protein struc-
ture alignments of proteins with different sequence
lengths, we can see that because our parameterized
approach is based on core alignments, the running
time does not increase significantly when the protein
sequence lengths increase. This indicates that our
approach is very efficient and suitable for structural
alignment of proteins with large numbers of amino
acids.
We compare the running time of our approach
with FAST (Zhu et al., 2005), which is based on pair-
wise backbone atom (C
α
) alignment, and MUSTANG
(Konagurthu et al., 2006), at a pairwise alignment
level. Refer to Table 2 for the running time compari-
son of 10 protein pairs with different sequence lengths
and different numbers of cores. From the experimen-
tal testing we can see that our MCS-based approach
has achieved a similar efficiency level over the other
approaches. Compared with FAST and MUSTANG,
our approach has an improvement in efficiency for
structure alignments of protein pairs with large num-
bers of amino acids.
BIOINFORMATICS 2012 - International Conference on Bioinformatics Models, Methods and Algorithms
178
!"
!"
#"
$#"
%!&"
%'!"
%()"
*)"
(!"
!"
'"
!"
)!"
'!"
$!"
(!"
%!!"
%)!"
%'!"
%$!"
%(!"
)!!"
!"
!+%"
!+)"
!+#"
!+'"
!+*"
!+$"
!+&"
!+("
!+,"
%"
!"#$%&'()'*&(+%,-'*.,&/'
0(&%'1(2%&.3%'*%&1%-+.3%'
Figure 5: Core coverage distribution of structure alignments for 631 protein pairs from the Lindahl data set, with the core
coverage results represented in 10% increments. Of the 631 protein pairs, for example, there are 182 pairs with a core coverage
of 60-70%, 80 pairs with a core coverage of 80-90%, and 4 pairs with a 100% core coverage.
!"
#"
$"
%"
&"
'"
("
(("
)("
*)"
+$"
+)"
#!!"
#!'"
#!*"
###"
##%"
##'"
##*"
#$#"
#$%"
#$'"
#$("
#$+"
#%#"
#%%"
#%)"
#%+"
#&$"
#&'"
#&)"
#'!"
#'#"
#'%"
#''"
#'*"
#(!"
#(%"
#(*"
#)$"
#)&"
#)+"
#*'"
#**"
#+%"
#+)"
$!!"
$!'"
$##"
$#)"
$$%"
$$+"
$%("
$%+"
$&&"
$'#"
$'("
$(&"
$)#"
$))"
$*'"
$+$"
$+)"
%!+"
%#)"
%$&"
%%'"
%&$"
%&+"
%(#"
%)'"
%**"
&!'"
&&#"
&($"
'#)"
!"#$%&'$()*+',%
-.)/$"*%01".'%&).+$.$+%23%'$45$*($%6$*7/8%)9%0.)/$"*%:,%
Figure 6: Running time distribution of structure alignments for proteins with the number of cores larger than 5, 551 protein
pairs from the Lindahl data set. Testing is conducted on a Dell server: PowerEdge 2950; Quad Core Intel Xeon X5460,
2x6MB Cache, 3.16GHz, 1333MHz FSB; 32GB 667MHz (8x4GB), Dual Ranked DIMMs.
5 SUMMARY
For protein structure alignment of two proteins, we
applied a graph comparison model to identify the
maximum common subgraph of two protein struc-
ture graphs. We first studied the parameterized com-
plexity of the MAXIMUM COMMON SUBGRAPH prob-
lem. Computational lower bounds for the parameter-
ized versions of the problem were investigated. We
proved it is unlikely that there is an algorithm of time
p(n,m) ∗ k
o(m)
for the problem MCS
k
, where k is the
map width of the source graph H with m vertices and
the host graph G with n vertices. In consideration of
the upper bound of p(n, m) ∗ k
m
for the problem, we
point out that the lower bound results for the problem
presented here is asymptotically tight.
We then developed efficient algorithms integrat-
ing the color coding method and parameterized com-
putation for protein structure alignment. Testing in
alignment efficiency and accuracy of our algorithms
are conducted using large benchmark testing data sets.
Our parameterized approach shows improvement in
STUDY OF PROTEIN STRUCTURE ALIGNMENT PROBLEM IN PARAMETERIZED COMPUTATION
179
!"
#!"
$!"
%!"
&!"
'!"
(!"
)!"
*!"
(("
)("
*)"
+$"
+)"
#!!"
#!'"
#!*"
###"
##%"
##'"
##*"
#$#"
#$%"
#$'"
#$("
#$+"
#%#"
#%%"
#%)"
#%+"
#&$"
#&'"
#&)"
#'!"
#'#"
#'%"
#''"
#'*"
#(!"
#(%"
#(*"
#)$"
#)&"
#)+"
#*'"
#**"
#+%"
#+)"
$!!"
$!'"
$##"
$#)"
$$%"
$$+"
$%("
$%+"
$&&"
$'#"
$'("
$(&"
$)#"
$))"
$*'"
$+$"
$+)"
%!+"
%#)"
%$&"
%%'"
%&$"
%&+"
%(#"
%)'"
%**"
&!'"
&&#"
&($"
'#)"
!"#$%&'()*%
+,-.*/0%1'/,2%3-,4*,*4%56%2*7)*08*%(*09.:%-;%1,-.*/0%<=%
Figure 7: RMSD distribution of structure alignments for 631 protein pairs from the Lindahl data set.
Table 1: Core coverage testing results of structure alignments of ten protein pairs from the Lindahl data set.
Protein 1 (P1) Protein 2 (P2) Length of P1 Length of P2 Cores in P1 Cores in P2 Core Coverage
1akl 1ospo 224 251 4 24 100.00%
1dud 1duta 136 117 5 4 75.00%
1fcdc 1dvh 80 79 5 4 75.00%
1llda 6ldh 170 169 7 10 71.43%
1mai 1pls 119 113 7 7 57.14%
1phe 1oxa 405 403 16 19 43.75%
1tib 3tgl 269 265 13 16 46.15%
2bnh 1miob 456 457 19 23 42.11%
3gsta 1glqa 133 131 10 9 55.56%
5sgae 1p03a 181 198 9 11 55.56%
Table 2: Comparison of the running time of our MCS approach with those of FAST and MUSTANG on ten protein pairs from
the Lindahl data set. (Time unit: second. Testing was conducted on a 15-inch MacBook Pro with the following configuration:
8GB 667MHz DDR2 SDRAM, 2.5GHz Intel Core 2 Duo).
Protein 1 (P1) Protein 2 (P2) Length of P1 Length of P2 Time (MCS) Time (FAST) Time (MUSTANG)
1akl 1ospo 224 251 0.014 0.560 3.433
1dud 1duta 136 117 0.053 0.213 0.607
1fcdc 1dvh 80 79 0.083 0.095 0.187
1llda 6ldh 170 169 0.225 0.308 0.902
1mai 1pls 119 113 0.493 0.142 0.436
1phe 1oxa 405 403 0.866 1.974 6.257
1tib 3tgl 269 265 0.810 0.875 1.914
2bnh 1miob 456 457 1.104 1.538 11.000
3gsta 1glqa 133 131 0.848 0.193 0.861
5sgae 1p03a 181 198 1.099 0.423 1.153
efficiency when applied to the structure alignments of
protein pairs with large sizes. For further work we
will refine the core region alignment of the protein
structure graphs to improve the performance of our
approach and design sophisticated scoring schemes
based on core coverage to evaluate the common sub-
graphs of two protein structure graphs.
ACKNOWLEDGEMENTS
This research is partially supported by NIH Grant #
P20 RR-16460 from the IDeA Networks of Biomedi-
cal Research Excellence (INBRE) Program of the Na-
tional Center for Research Resources.
BIOINFORMATICS 2012 - International Conference on Bioinformatics Models, Methods and Algorithms
180

REFERENCES
N. Alon, R. Yuster, and U. Zwick. Color-coding: a new
method for finding simple paths, cycles and other
small subgraphs within large graphs. In STOC, 326–
335, 1994.
A. Caprara and G. Lancia. Structural alignment of largesize
proteins via Lagrangian relaxation. RECOMB 2002,
100–108, 2002.
M. Comin, C.Guerra, and G. Zanotti. PROuST: a compar-
ison method of three-dimensional structures of pro-
teins using indexing techniques. J. of Comp. Biology,
11(6):1061–1072, 2004.
J. Chen, X. Huang, I. A. Kanj, and G. Xia. Strong compu-
tational lower bounds via parameterized complexity.
JCSS, 72(8):1346–1367, 2006.
W. DeLano. The pymol user’s manual. DeLano Scientific,
San Carlos, CA, 2002.
R. G. Downey, V. Estivill-Castro, M. R. Fellows, E. Prieto,
and F. A. Rosamond. Cutting up is hard to do: the pa-
rameterized complexity of k-cut and related problems.
Electr. Notes Theor. Comput. Sci., 78, 2003.
R. G. Downey and M. R. Fellows. Parameterized Complex-
ity. Springer, 1999.
A. Fiser and A. Sali. Modeller: generation and refinement
of homology-based protein structure models. Methods
in Enzymology, 374:461–491, 2003.
L. Holm and C. Sander. Protein structure comparison by
alignment of distance matrices. J. of Molecular Biol-
ogy, 233:123–138, 1993.
X. Huang and J. Lai. Maximum Common Subgraph: Upper
Bound and Lower Bound Results. IMSCCS, 1:40–47,
2006.
R. Impagliazzo, R. Paturi, and F. Zane. Which prob-
lems have strongly exponential complexity? JCSS,
63(4):512–530, 2001.
W. Kabsch and C. Sander. Dssp: definition of secondary
structure of proteins given a set of 3d coordinates.
Biopolymers, 22:2577–2637, 1983.
A. Konagurthu, J. Whisstock, P. Stuckey, and A. Lesk.
MUSTANG: a multiple structural alignment algo-
rithm. Proteins: Structure, Function, and Bioinfor-
matics, 64(3):559–574, 2006.
G. Lancia and S. Istrail. Protein structure comparison: Al-
gorithms and applications. Mathematical Methods for
Protein Structure Analysis and Design, LNCS 2666,
1–33, 2003.
C. Lemmen and T. Lengauer. Computational methods for
the structural alignment of molecules. J. of Computer-
Aided Molecular Design, 14:215–232, 2000.
E. Lindahl and A. Elofsson. Identification of related pro-
teins on family, superfamily and fold level. J. of
Molecular Biology, 295(3):613–625, 2000.
C. H. Papadimitriou and M. Yannakakis. Optimization,
approximation, and complexity classes. JCSS,
43(3):425–440, 1991.
A. Porollo, R. Adamczak, and J. Meller. Polyview: a flexi-
ble visualization tool for structural and functional an-
notations of proteins. Bioinformatics, 20(15):2460,
2004.
Y. Song, C. Liu, R. L. Malmberg, C. He, and L. Cai. Mem-
ory efficient alignment between rna sequences and
stochastic grammar models of pseudoknots. Intl. jour-
nal of bioinf. research&applications, 2(3):289–304,
2006.
J. Xu, F. Jiao, and B. Berger. A parameterized algorithm
for protein structure alignment. J. of Computational
Biology 14: 564–577, 2007.
Y. Xu, Z. Liu, L. Cai, and D. Xu. Protein structure pre-
diction by protein threading. in Comp. Methods for
Protein Structure Prediction and Modeling, Vols I&II,
(eds. Xu, Y., Xu, D., and Liang, J.), 389-430, Springer,
2006.
Y. Zhang, and J. Skolnick. The protein structure predic-
tion problem could be solved using the current PDB
library. Proc. of the National Academy of Sciences,
102, 4, pp. 1029–1034, 2005.
Y. Zhang, and J. Skolnick. TM-align: A protein structure
alignment algorithm based on TM-score. Nucleic
Acids Research, 33: 2302-2309, 2005.
J. Zhu, and Z. Weng. FAST: a novel protein structure align-
ment algorithm. Proteins 58:618-627, 2005.
STUDY OF PROTEIN STRUCTURE ALIGNMENT PROBLEM IN PARAMETERIZED COMPUTATION
181
