
CLOTH COVERING AND APPLICATION TO FEATURE
EXTRACTION FOR SCRIPT IDENTIFICATION
Minwoo Kim and Il-Seok Oh
Division of Computer Science and Engineering, Chonbuk National University, Jeonju, Korea
Keywords: Macroscopic Viewing, Feature Extraction, Script Identification.
Abstract: This paper proposes a concept and algorithm of cloth covering. It is a physically-based model which
simulates computationally a shape of cloth covering some objects. It has one scale parameter which controls
the degree of suppressing fine-scale structures. To show viability of the proposed cloth covering, this paper
performed an experiment of script recognition. The results of comparing accuracies of feature extraction
using Gaussian and cloth covering showed that the cloth covering is superior to Gaussian.
1 INTRODUCTION
The multi-scale representation of signals or images
is important issue in various research communities
such as signal processing, computer vision, and
pattern recognition (Lindeberg, 1994). The scale-
space theory supported by multi-scale representation
methods is motivated from biological vision and
physics. The most popular method is using Gaussian
kernel as a smoothing operator. The Gaussian has
one scale parameter which controls the degree of
suppressing fine-scale structures in given signals or
images. The scale-space theory has many
applications which could benefit from scale-
invariance property, such as feature extraction (e.g.,
SIFT (Lowe, 2004)), edge detection (Yuille et al.,
1986) (Lindeberg, 1998), and interest feature point
detection (Mikolajczyk et al., 2004).
This paper proposes a novel model which
computationally simulates the physical phenomenon
of cloth covering. The initial cloth on ground level is
lifted under predefined rules to cover the objects
until it reaches a stable state. In this process, the
cloth is modeled as a list of balls connected by
rubber band.
Since the objects covered by the cloth lose their
details and appear only in their outlines, basic effect
of the cloth covering operation is suppressing fine-
scale structures of given signals or images. In other
words, the operation transforms microscopic
structure into macroscopic one. It has one scale
parameter which controls the degree of suppressing
fine-scale structures.
To show viability of the proposed cloth covering,
this paper performed an experiment of script
recognition. Text line images written in three
different scripts were used by the experiment.
Coefficients taken from Fourier transforms of profile
and projection of line images were used as features.
For feature extraction, Gaussian and cloth covering
were applied to the raw profile and projection
signals. The results of comparing their accuracies
showed that the cloth covering is superior to
Gaussian.
Section 2 presents principle and algorithm of the
cloth covering. Section 3 presents experiments done
using script recognition problem. Section 4
concludes the paper.
2 PRINCIPLES & ALGORITHMS
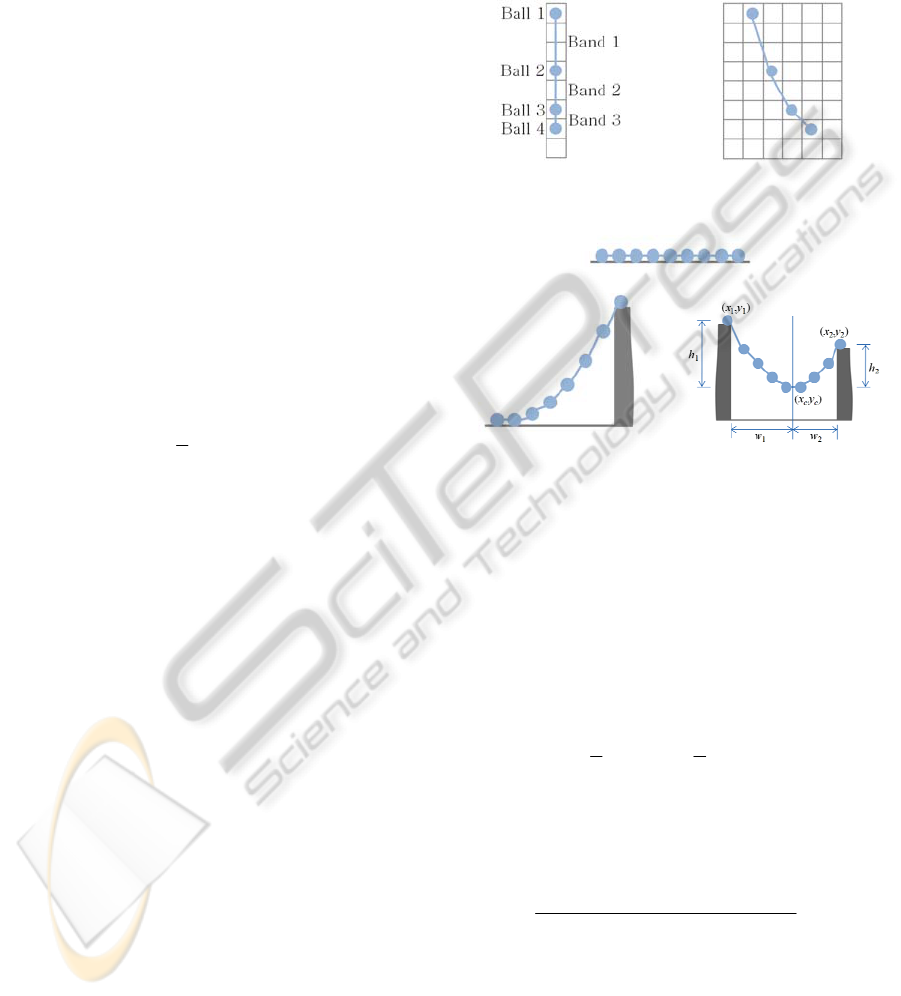
As Figure 1 shows, the cloth is modeled as a list of
cloth elements connected by elastic material. The
elastic material is an object with elasticity such as
rubber band or spring. This paper calls it as rubber
band. The cloth element is an object with weight.
This paper calls it as ball. The paper assumes all the
balls have the same weight and the rubber band is
weightless. It also assumes that the length of rubber
band is proportional to the weight given to the
rubber band, i.e., proportional to the number of balls
hung from the rubber band.
Figure 1: The cloth is modeled by a list of balls connected
by rubber band.
295
Kim M. and Oh I. (2012).
CLOTH COVERING AND APPLICATION TO FEATURE EXTRACTION FOR SCRIPT IDENTIFICATION.
In Proceedings of the 1st International Conference on Pattern Recognition Applications and Methods, pages 295-299
DOI: 10.5220/0003772602950299
Copyright
c
SciTePress
2.1 Dynamics
Assume that two balls with weight m are connected
by a rubber band with elasticity coefficient k. When
a ball is lifted up high enough that the other ball is
hung in the air, the resulting length of rubber band
(denoted by x) is proportional to the force gived on
the rubber band. We can formulate f=kx by Hook’s
law. Since the only force on the rubber band is the
weight of hanging ball, we can write f=mg where g
is the gravitational acceleration. So the length of
rubber band is x=mg/k (Halliday, 2008).
Let’s extend the situation to one where four balls
are connected as in Figure 2(a). In this situation, the
length of rubber band 3 is equal to mg/k. However
since two balls are hung from rubber band 2, the
length of rubber band 2 is 2mg/k. Similarly the
length of rubber band 1 is 3mg/k.
Let’s generalize the phenomenon. When n balls
are hung from a rubber band, the length of the
rubber band is nmg/k. Since m, g, k are constant,
let’s replace k/(mg) by τ. Now the length of rubber
band from which n balls are hung can be written by
Equation (1).
(1)
In Equation (1), τ is the parameter which controls
stiffness of the cloth. The larger the τ is, the stiffer
the cloth is. On the contrary, as τ becomes smaller,
the cloth becomes smooth and the final shape is
similar to the original signal. We call τ as stiffness
coefficient.
In order to define the cloth covering operation
over 1-dimensional signal, let’s change the situation
of Figure 2(a) to Figure 2(b). In the new situation,
four balls are not located on the same column but on
adjacent columns. Though physically the length of
rubber band should be calculated considering
vertical and horizontal forces, this paper considers
only the vertical direction for computational
simplicity. So Equation (1) can be applied to the
situation of Figure 2(b).
Figure 3 illustrates three primitive situations
which algorithm of the cloth covering should deal
with. Figure 3(a) is the case where the signal is
ground level. In this case, the cloth is on ground
level. Figure 3(b) is one where one side is ground
level and the other side is on top of supporting bar.
In this case, the cloth shape can be calculated using
Equation (1). Figure 3(c) shows the case where both
sides are on top of supporting bars. Since in this case
the cloth can’t be calculated simply by using
Equation (1), we divide the rubber band into two
parts. We assume that two parts are independent, i.e.,
they do not influence on the resulting shape each
other. We take the lowest ball as the point where the
rubber band is split into two parts. After splitting the
rubber band, Equation (1) can be applied to each of
two parts.
(a) Balls at the same column
(b) Balls at neighbor columns
Figure 2: Four balls hung from top.
(a) Ground level
(b) Ground level and
supporting bar
(c) Two supporting bars
Figure 3: Three primitive situations.
Now we will explain the procedure to find out
the lowest ball for the case of Figure 3(c). Let the
lowest point to be (x
c
,y
c
) and the coordinates of top
of supporting bars to be (x
1
,x
1
) and (x
2
,y
2
). Then the
height can be written as h
1
=y
1
-y
c
and h
2
=y
2
-y
c
. And
the width are w
1
=x
c
-x
1
and w
2
=x
2
-x
c
. The values of h
1
and h
2
can be calculated by summing Equation (1) as
shown in Equation (2).
,
(2)
Since the left and right parts are connected at the
lowest point, the equation, y
c
=y
1
-h
1
=y
2
-h
2
holds.
Rearranging the equation, we get Equation (3).
)1(2
)()(2
21
21
2
2
2
121
−−−
−−−−−
=
xx
xxxxyy
x
c
τ
(3)
2.2 Algorithm
In the situations of Figures 3, balls at the ends are
fixed on ground or on top of supporting bars. In
other words, we know two contact points where the
ball is contact with signal level. However, in the
nx
τ
1
=
∑
=
=
1
1
1
1
w
i
ih
τ
∑
=
=
2
1
2
1
w
i
ih
τ
ICPRAM 2012 - International Conference on Pattern Recognition Applications and Methods
296
initial state, no contact point is known. This section
explains the algorithm which starts with the initial
state and ends with the final cloth shape.
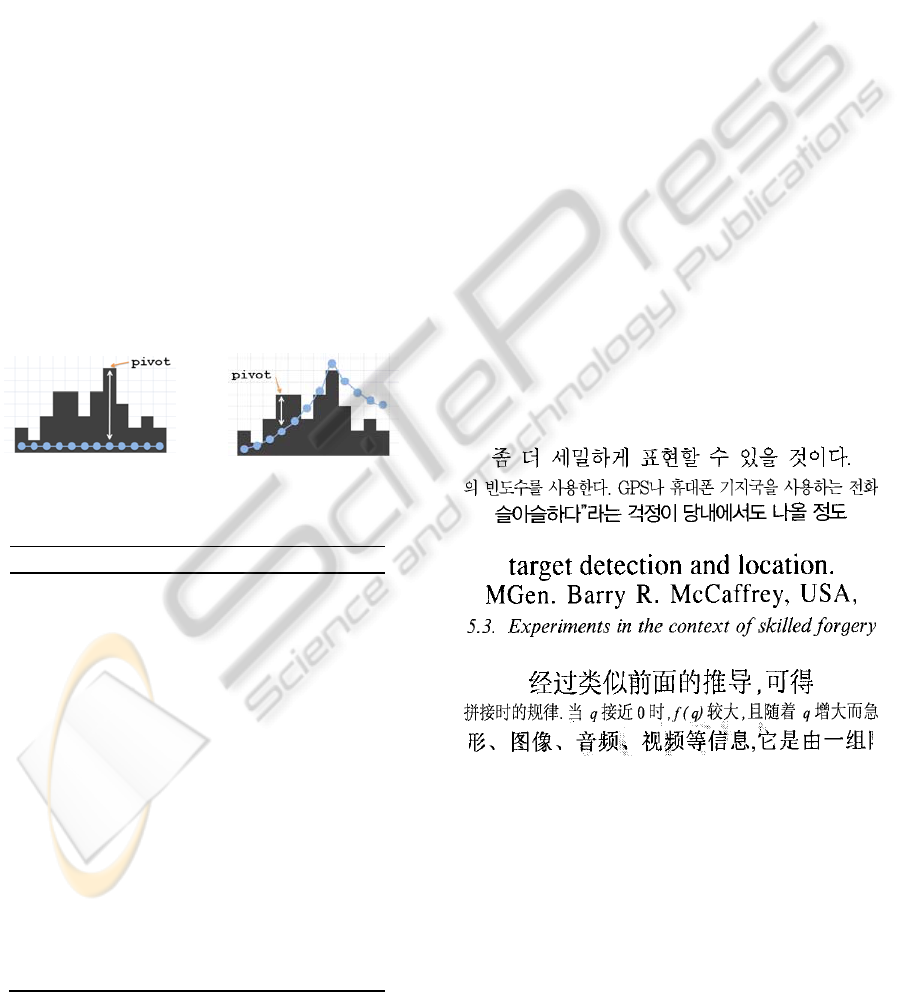
Figure 4(a) shows the initial state which the
algorithm starts with. In this state, the algorithm
attempts to decide a ball which is doomed to contact
with cloth. The point is called as pivot point. The
criterion to choose the pivot point is maximizing the
height difference between current cloth and the input
signal. The pivot point is indicated in figure 4(a).
The cloth is lifted at the pivot so that the cloth is
contact with the signal level at the pivot as Figure
4(b) shows. Then the cloth is split into two parts at
the pivot, and two parts proceed the same procedure
independently. Figure 4(b) indicates the new pivot
for the left part.
The algorithm can be written in a recursive
procedure in Algorithm 1. The algorithm starts with
ground level cloth of C[i]=0, i=0,n-1. The recursive
function Covering(p,q) finds out pivot point in the
range [p,q], and lifts up the current cloth to the
signal level at pivot point. Then it computes new
cloth using the process of Section 2.1 and calls
recursively Covering() for each of left and right
parts.
(a)
(b)
Figure 4: Algorithm for cloth covering (recursively
splitting at pivots).
The average and worst case time complexity of
Algorithm 1 is O(nlogn) and O(n
2
) where n is the
number of balls, i.e., length of signal.
3 APPLICATION TO SCRIPT
IDENTIFICATION
The script identification is a sub problem of OCR
(Optical Character Recognition) (Marinai, 2008).
Figure 6 shows text line images written in different
scripts, Korean, Latin, and Chinese. In conventional
researches, Fourier coefficients extracted from
profile and projection of line images were used as
feature set (Ghosh et al., 2011) (Pal et al., 2002).
Some literatures applied Gaussian filter to profile
and projection signals before Fourier transform in
order to suppress the details of signals. The aim of
this section is to compare the proposed cloth
covering with Gaussian filter in terms of feature’s
discriminating power.
3.1 Feature Extraction
One of the popularly used features is profile and
projection. Figure 6(b) presents top profile, bottom
profile, and projection. The Fourier coefficients
taken from Fourier transform of profile and
projection signals were used as feature vectors by
(a) Korean
(b) Latin
(c) Chinese
Figure 5: Text line images written in three scripts.
the classifier (Ghosh et al., 2011) (Pal et al., 2002).
This paper calls this feature vector as Raw-Fourier.
As we can observe in Figure 6(b), the raw profile
and projection conveys detail shapes of input line
images. We may think of using coarse version of
profile and projection with the hope of improving
discriminating power of the feature vector. Figures
6(c) and 6(d) show the Gaussian-smoothed profile
Algorithm 1: 1-dimensional cloth covering
Input: D[0,n-1] //input signal
Output: C[0, n-1] // cloth shape
1. C[i] = 0, 0≤i≤n-1
2. Covering(0, n-1);
Covering(p, q)
{
if(p == q) return;
pivot = argmax
p≤k≤q
(D[k] – C[k]);
if(D[pivot] – C[pivot] ≤ 0) return;
C[pivot] = D[pivot];
Physics(p, pivot);
Covering(p, pivot);
Physics(pivot, q);
Covering(pivot, q);
}
Physics(p, q)
{
update cloth shape in the range [p,q] using
dynamics in Section 2.1;
}
CLOTH COVERING AND APPLICATION TO FEATURE EXTRACTION FOR SCRIPT IDENTIFICATION
297
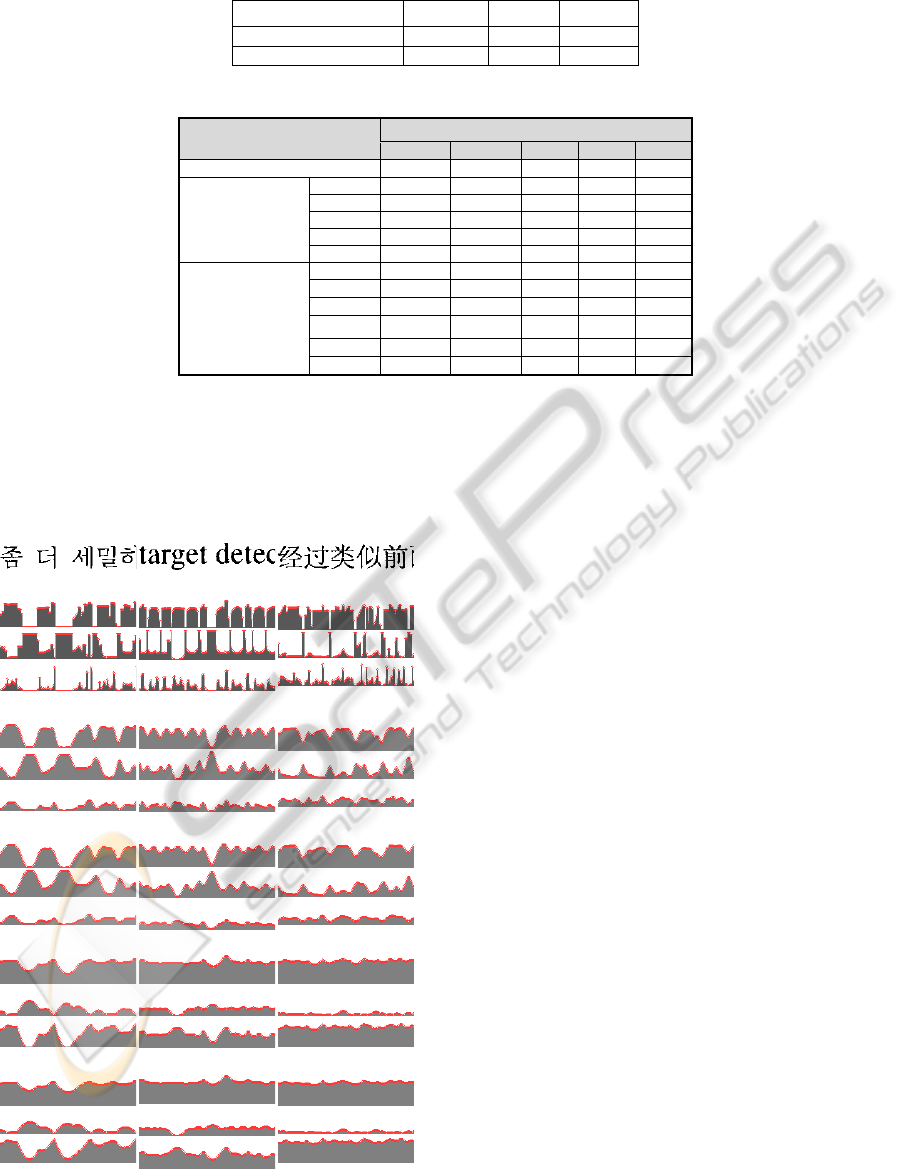
Table 1: Size of data sets.
Korean Latin Chinese
number of documents 69 44 37
number of text lines 2874 2818 1337
Table 2: Recognition accuracies.
Feature extraction methods
Number of features
150 120 90 60 30
Raw-Fourier 97.67 96.90 96.50 94.28 89.19
Gaussian-Fourier
σ = 1 97.71 97.03 96.64 94.57 89.44
σ = 2 97.68 97.20 96.57 94.58 89.50
σ = 3 97.81 97.37 96.63 94.58 89.60
σ = 4 97.62 97.48 96.76 94.76 89.66
σ = 5 97.52 97.37 96.69 94.58 89.74
Covering-Fourier
τ = 1 97.55 97.52 97.27 95.72 93.10
τ = 5 98.41 98.26 98.01 97.52
95.58
τ = 9
98.79
98.72 98.46 97.70 95.55
τ = 13 98.75 98.75
98.73
97.72 95.08
τ = 17 98.71
98.78
98.73
97.79
94.66
τ = 21 98.71 98.72 98.62 97.52 94.05
and projection. Fourier coefficients taken from
Fourier transform of Gaussian-smoothed profile and
projection signals are used as feature vector. The
feature vector is called as Gaussian-Fourier(σ) where
σ represents standard deviation of Gaussian function
being used.
(a) Line images
(b) Raw profiles and projection
(c) Gaussian smoothed with σ = 3
(d) Gaussian smoothed with σ = 4
(e) Cloth covered with τ = 9
(f) Cloth covered with τ = 13
Figure 6: Top profile, bottom profile, and projection.
The cloth covering can also be used to suppress the
details. The result of cloth covering over the top
(bottom) of line image is called as top (bottom) cloth
profile. The difference of top and bottom profiles is
called as cloth projection. Figures 6(e) and 6(f)
depict the cloth profile and cloth projection. Fourier
coefficients taken from Fourier transform of cloth
profile and cloth projection signals are used as
feature vector and it is called as Covering-Fourier(τ)
where τ represents stiffness coefficient.
3.2 Experimental Results and Analysis
The data sets used by experiments have been
collected from various documents, including
technical papers, magazines, and books. The used
scripts are Korean, Latin, and Chinese. The images
were scanned in 300dpi. Table 1 shows size of data
sets. For classification, we used SVM (Burges,
1998). In measuring recognition accuracy, we used
5-fold cross validation.
Table 2 presents recognition accuracy measured
for three types of feature vector, Raw-Fourier,
Gaussian-Fourier(σ), and Covering-Fourier(τ). To
get finer analysis, we took different number of
coefficients from Fourier transform. When we took
50 coefficients from one signal, total number of
features is 150 since we used three signals, top
profile, bottom profile, and projection.
Comparing raw signals and smoothed signals,
the table makes sure that both Gaussian and cloth
covering are superior to raw signals. We argue that
using the detail shapes as they are does not provide
good discriminating power of features. In each
column, the best accuracy is visually emphasized
using bold typeface. The cloth covering won every
ICPRAM 2012 - International Conference on Pattern Recognition Applications and Methods
298

column. The cloth covering was better than
Gaussian by more than about 1%. We recommend 9
or 13 for the scale parameter τ.
The cloth covering produced similar accuracies for
the feature vector size of 90~150. On the contrary,
Raw-Fourier and Gaussian-Fourier decreases rapidly
as number of features decreases.
4 CONCLUSIONS
This paper proposed a novel multi-scale method
called cloth covering. The paper presented
algorithms for 1-D cloth covering. Using script
recognition experiments, we showed viability of the
cloth covering.
There are a number of futures of the cloth
covering. Firstly, mathematical properties are worth
of studying. Comparison with Gaussian and
mathematical morphology could guide the study.
Secondly, application areas in which the cloth
covering competes with or superior to conventional
method should be identified. As a specific area,
keypoint detection for SIFT is being studied by
authors. The conventional SIFT uses DOG
(Difference of Gaussian). Our concern is to test the
performance when we replace DOG with DOC
(Difference of Cloth covering). Thirdly, algorithms
for n-dimensional signals should be developed. The
priority is on developing algorithm for 2-D images.
ACKNOWLEDGEMENTS
This research was supported by Basic Science
Research Program through the National Research
Foundation of Korea (NRF) funded by the Ministry
of Education, Science and Technology (2011-
0004600).
This work was supported by the second stage of
Brain Korea 21 Project in 2011.
REFERENCES
Burges, C. J. C., 1998. A tutorial on support vector
machines for pattern recognition. Data Mining and
Knowledge Discovery, 2, pp.121-167.
Ghosh, D., Dude, T., Shivaprasad, A. P., 2010. Script
recognition–a review. IEEE Transactions on Pattern
Analysis and Machine Intelligence, 32(12), pp.2142-
2161.
Halliday, D., 2008. Fundamentals of Physics. 8
th
Ed.
Wiley.
Lindeberg, T., 1994. Scale-space theory: a basic tool for
analyzing structures at different scales.Journal of
Applied Statistics, 21(2), pp.224-270.
Lindeberg, T., 1998. Edge detection and ridge detection
with automatic scale selection. International Journal
of Computer Vision, 30(2), pp.117-156.
Lowe, D. G., 2004. Distinctive image features from scale-
invariant keypoints. International Journal of
Computer Vision, 60(2), pp.91-110.
Marinai, S., 2008. Machine Learning in Document
Analysis and Recognition, Springer.
Mikolajczyk, K., Schmid, C., 2004. Scale and affine
invariant interest point detectors. International
Journal of Computer Vision, 60(1), pp.63-86.
Pal, U., Chaudhuri, B. B., 2002. Identification of different
script lines from multi-script documents. Image and
Vision Computing, 20, pp.945-954.
Yuille, A. L., Poggio, T. A., 1986. Scaling theorems for
zero crossings. IEEE Transactions on Pattern Analysis
and Machine Intelligence, 8, pp.15-25.
CLOTH COVERING AND APPLICATION TO FEATURE EXTRACTION FOR SCRIPT IDENTIFICATION
299
