NON-LINEAR ANALYSIS OF FETAL HEART RATE
IN CARDIOTOCOGRAPHY USING SAMPLE ENTROPY
J. A. L. Marques,
1
P. C. Cortez,
2
J. P. V. Madeiro
2
and F. S. Schlindwein
3
1
Department of Informatics, University Lusiada of Angola, 1
st
of December St., Lobito, Angola
2
Department of Engineering of Teleinformatics, Federal University of Ceará, Fortaleza, Brazil
3
Department of Engineering, University of Leicester, Leicester, United Kingdom
Keywords: Fetal Heart Rate, Sample Entropy, Nonlinear Analysis.
Abstract: The complex system of mother and foetus interacting during pregnancy contains both dependent and
independent subsystems and it is unlikely that it can be studied using only linear techniques. Considering
this, the conventional medical analysis of Fetal Heart Rate (FHR) based on Cardiotocography (CTG) traces
can be expanded considering nonlinear approaches. This work presents the use of Sample Entropy
(SampEn) as a measure of system complexity, using a 5 minutes window of FHR signal (1200 samples),
using values for parameters m and r based on literature to analyse the signal complexity behaviour in time.
The database is comprised of 22 pre-classified intrapartum exams, expected to have a high degree of time
domain dynamics. The analysis shows that severe FHR decelerations result in small values of SampEn,
reflecting a low level of complexity. On the other hand, a set of high level transient FHR accelerations also
causes the same effect. The occurrences of repetitive patterns (similar to sinusoidal waves, which are
pathological) cause a drop of SampEn values. The results encourage us to consider SampEn as one viable
parameter for nonlinear FHR signal analysis.
1 INTRODUCTION
The CTG examination is the simultaneous and
continuous recording of the FHR, fetal movements
and uterine contractions. The analysis of these
signals can help diagnose a large set of fetal diseases
or health problems (Ingemarsson, Ingemarsson, &
Spencer, 1993).
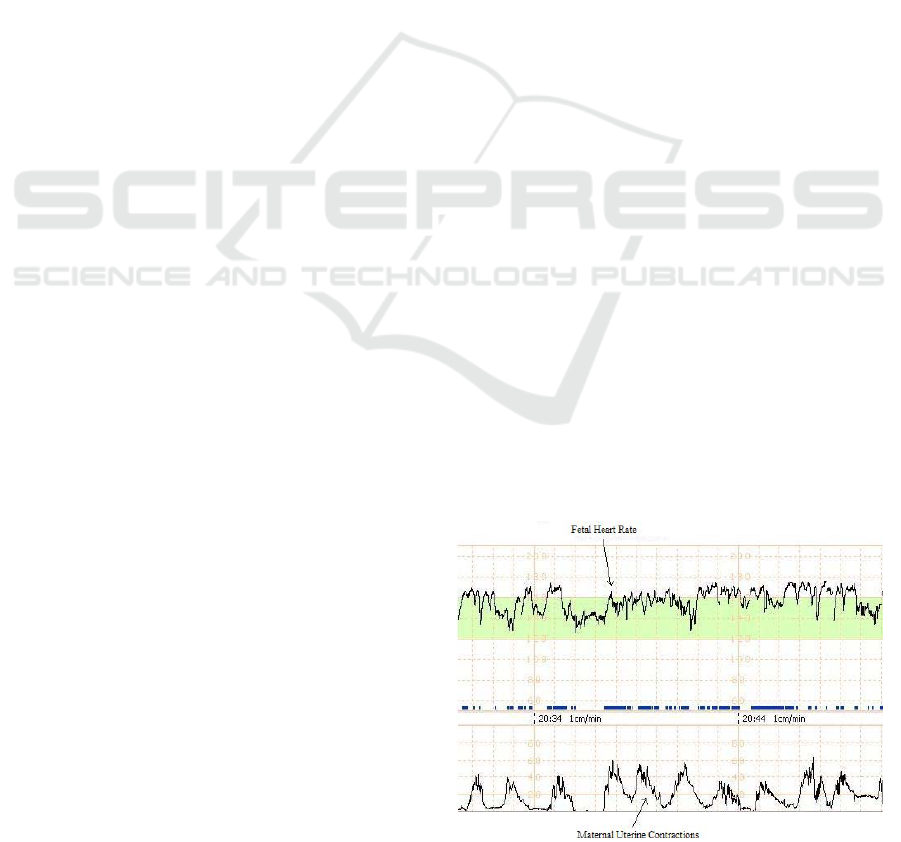
A partial CTG trace with FHR and the uterine
tonus monitoring is shown in Figure 1. The
occurrence of uterine contractions usually indicates
the intrapartum period. The diagnostic based on
these two signals provides early detection of fetal
health problems.
The fetal heart rate and the interval between the
beats change periodically and non-periodically in
time and this variability is normally considered as a
health indicator.
The fetal cardiac rhythm is influenced by many
different subsystems, such as the heart, brain and
neural system development, fetal oxygen supply and
also the maternal conditions (such as fever or high
blood pressure). This complex scenario suggests the
presence of nonlinear behaviour and characteristics
in FHR.
Figure 1: FHR and uterine contractions signals in a CTG.
According to Savi, from the point of view of
mathematical modelling, the description of
biological phenomena could be more realistically
modelled with nonlinear analysis rather than with
linear analysis. Surrogate data obtained from the
244
A. L. Marques J., Cortez P., Madeiro J. and Schlindwein F..
NON-LINEAR ANALYSIS OF FETAL HEART RATE IN CARDIOTOCOGRAPHY USING SAMPLE ENTROPY.
DOI: 10.5220/0003776502440248
In Proceedings of the International Conference on Bio-inspired Systems and Signal Processing (BIOSIGNALS-2012), pages 244-248
ISBN: 978-989-8425-89-8
Copyright
c
2012 SCITEPRESS (Science and Technology Publications, Lda.)

analyzed time series can be used to present
evidences of nonlinear components in the signal
(Kantz & Schreiber, 1997).
Nonlinear approaches to calculate biological
time series complexity can be obtained using
nonlinear entropy measures such as Approximate
Entropy (Pincus, 1991); Lempel-Ziv complexity
(Doganaksoy & Göloglu, 2009) and Sample Entropy
(Richman & Moorman, 2000).
The Sample Entropy is a metric based on
Approximate Entropy that has been already applied
to evaluate the complexity in cardiovascular time
series (Richman & Moorman, 2000).
This work presents a nonlinear analysis of FHR,
which is the most significant signal monitored in a
CTG, based on Sample Entropy (SampEn)
behaviour in time.
2 MATERIALS AND METHODS
2.1 Sample Entropy
The SampEn of a time series is the negative natural
logarithm of the probability that two similar
sequences of m points remain similar at the next
point. The polarization of self-matches is not
considered. Low values of SampEn indicate lower
complexity and more regularity in the time series.
For a better understanding of these definitions as
a measure of system complexity, the mathematical
foundations of its calculation is provided.
Given S
i
as a time series with N samples S
i
= {S
1
,
S
2, ….,
S
N
} the first step to calculate SampEn(S
i
,m,r),
is the determination of two input parameters m and
r, where m is the length of a subset of S
i
and r is the
similarity criteria. Consider also that p
m
(i) is the
subsequence or pattern of S
N
beginning in sample i
and with m samples of length.
Consider two patterns p
m
(i) and p
m
(j), beginning,
at index i and j respectively. These patterns can be
considered similar if the scalar distance between
them, i.e., the module of the difference between
sample pairs is less than r. (1).
rSS
kjki
<−
++
(1)
for 0 < k < m.
Consider P
m
as the set of all patterns from S
N
with length m. The relation C
i,m
(r)
can now be
defined (2).
1
)(
)(
,
,
+−
=
mN
rn
rC
mi
mi
(2)
where n
i,m
(r) is the number of patterns similar to
p
m
(i) in P
m
. The parameter C
m
(r) must be calculated
as the average of all C
i,m
(r) for the entire P
m
set.
Finally, SampEn(S
i
,m,r) can be found (3).
)(
)(
ln),,(
1
rC
rC
rmSSampEn
m
m
i
+
=
(3)
2.2 Development Environment
and CTG Database
The development environment was based on the
Matlab software, version 7.6.0.324 R2008a
(Mathworks, 2009).
The results were obtained using a database from
Trium GmBH, a project partner from Munich,
Germany. This database was labelled as the CTG-I
and contains 22 intrapartum exams (during labour
and delivery), all classified by medical staff.
This database was chosen because of the high
level of dynamics found during labour, especially
when the influence of uterine contractions can be
found in FHR signals.
2.3 Entropy Calculation Parameters
Sample entropy can be calculated for the whole FHR
signal, providing a long term index or, alternatively,
windows of samples can be used for short term
nonlinear characteristics evaluation.
Data were submitted to many tests with different
Δt
e
window sizes and also changing m and r
parameters.
In this paper, the FHR signal entropy
calculations consider a subset of 1200
samples,
which represents a 5 minute-long window. The aim
is the monitoring of the signal entropy based on its
time evolution. For example, the entropy behaviour
during pathological FHR events, such as prolonged
decelerations, could be a predictive tool for
electronic fetal monitoring.
The SampEn input parameters used were m=5
and r=0.2σ[FHR(t)], where FHR(t) is the FHR
signal and σ[FHR(t)] is the standard deviation of the
time series (Kaplan & Staffin, 2008).
3 RESULTS AND DISCUSSION
In this section, the general results obtained with the
CTG-I database are presented with some illustrative
examples of high and low values of SampEn and the
correspondent visualization of FHR trace in time.
NON-LINEAR ANALYSIS OF FETAL HEART RATE IN CARDIOTOCOGRAPHY USING SAMPLE ENTROPY
245
Several physiological changes occur in the
perinatal period and fetal signals are expected to
have high dynamics, hence, high values of entropy
are usually expected in these time series. The
presence of low values should be investigated.
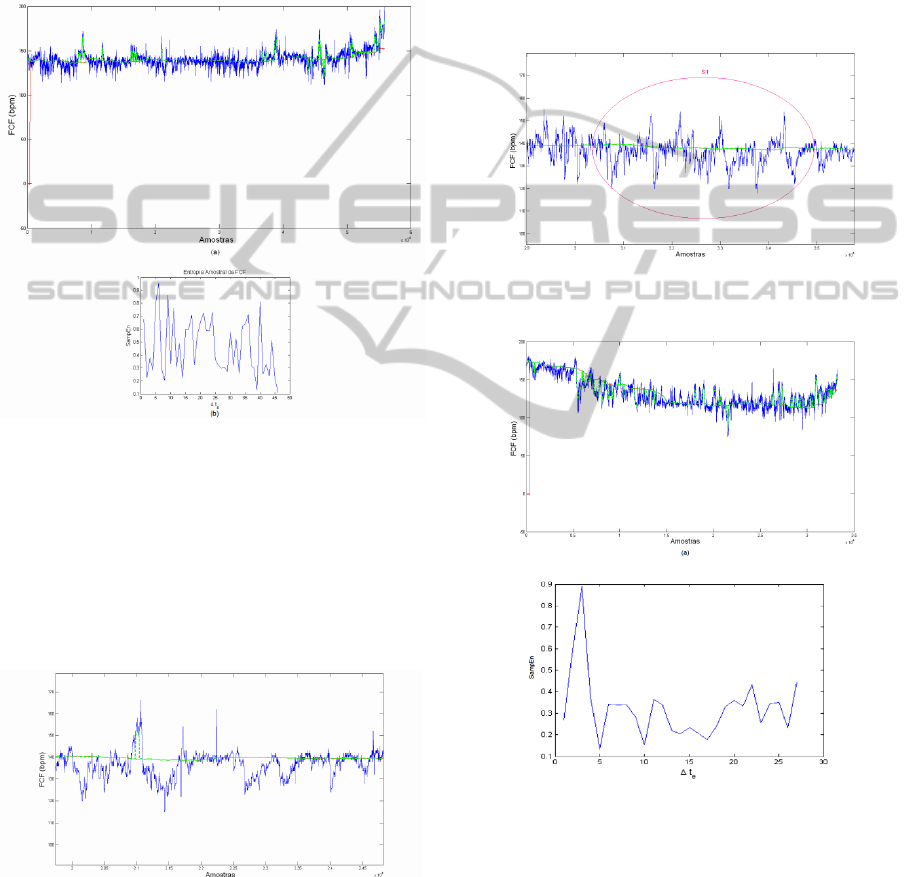
The FHR and SampEn(FHR,m,r) plots for the
ctg20040215-0803261 examination are presented on
Figure 2. Notice that the SampEn is calculated only
for the specified windows of 1200 samples.
Figure 2: Exam ctg20040215-0803261 (a) FHR plot and
(b) SampEn calculation using the specified window.
As mentioned before, for a more clear
interpretation of the entropy behaviour, some
specific time intervals are analysed.
The first analysis is a zoom at the 18<Δt
e
<24
interval, where we can find high values of sample
entropy. In a closer look of the FHR signal in Figure
3, one can see that there are many oscillations.
Figure 3: Extracted trace from ctg20040215-0803261
exam with high values of SampEn.
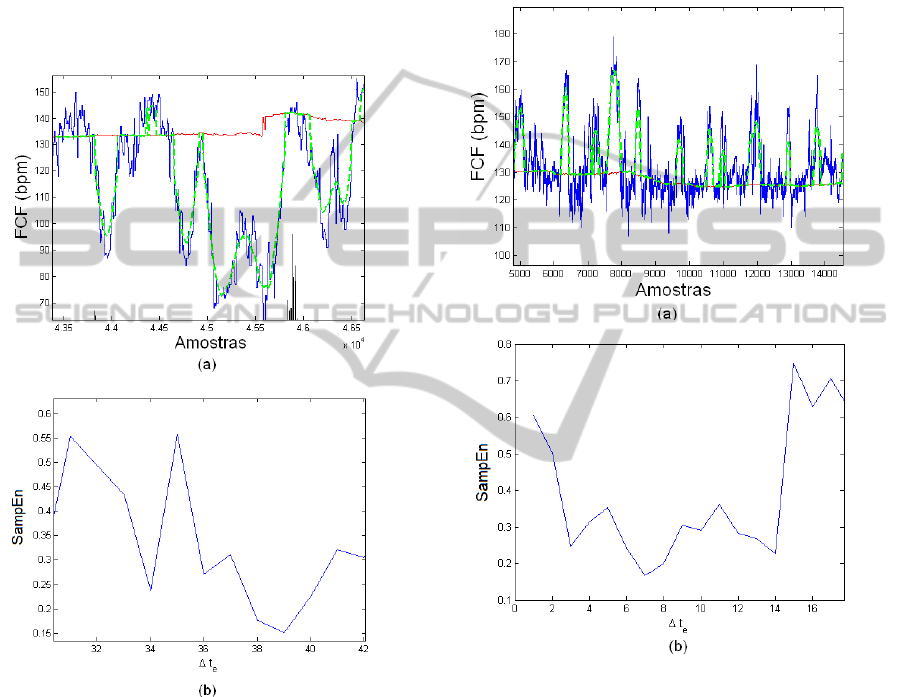
During the same exam, right after the trace
shown in Figure 3, during the interval 25<Δt
e
<29,
we can find low values of SampEn, even when the
trace apparently shows that the signal is oscillating
and high values of sample entropy could be
expected. The reason for that can be seen in Figure
4. Actually, the signal complexity decreases because
the trace shows a periodic repetitive pattern
identified by the region S1. A sinusoidal behaviour
of FHR is considered as pathological in visual CTG
classification (Ingemarsson, Ingemarsson, &
Spencer, 1993). This encouraged us to consider low
values of SampEn as a possible index to predict fetal
health problems.
Figure 4: Trace extracted from ctg20040215-0803261
exam with low values of SampEn (repetitive pattern).
Figure 5: Exam ctg20011218-2348371 (a) FHR with low
variability and a drop of the baseline and (b) decreasing
SampEn values .
The ctg20011218-2348371 exam presented in
Figure 5 was previously classified as pathological,
with low values of short-term variability and also
because of the FHR baseline behaviour (Marques,
Cortez, & Madeiro, 2010). At the beginning there
can be seen a tachycardia, followed by the decrease
of the signal baseline. The SampEn trace shows high
BIOSIGNALS 2012 - International Conference on Bio-inspired Systems and Signal Processing
246
values at the beginning also followed by low values,
remaining at this level until the end of the
examination.
In the next analysis, the FHR sample entropy can
be used to indicate transient changes in the time
series. The ctg20040214-0722052 exam contains
severe FHR decelerations, correspondingly to very
low values of SampEn. For example, for the interval
36<Δt
e
<40, the entropy remains in the same level
until the original signal returns to its baseline, as can
be seen in Figure 6.
Figure 6: Exam ctg20040214-0722052 (a) FHR with
severe decelerations and (b) low values of SampEn.
On the other hand, during the ctg20020124-
1015523 examination, a set of transient accelerations
of FHR can be found. These changes and the
repetitive pattern presnt also result in low values of
entropy. For example, during the interval 5<Δt
e
<12,
the calculated sample entropy is very low, as shown
in Figure 7.
The results presented here as a set of examples of
FHR complexity in time were found on the entire set
of the CTG-I database.
As can be seen, the sample entropy does not
require a slow converging process, acting as a fast
technique for detecting changes in FHR, for the
considered set of windows.
For this kind of analysis, some complementary
information, such as fetal HRV low and high
frequency parameters, short-term and long-term
variability and other nonlinear measures could be
very useful for automatic or even visual analysis of
CTG traces.
Figure 7: Exam ctg20020124-1015523 (a) FHR with
severe decelerations and (b) low values of SampEn.
Some physiological interpretations can be done
from the SampEn calculation. First of all, it can be
used as a normality indice of the FHR long term
variability which is an important neural development
estimator. Besides, low entropy values found in
severe FHR accelerations and decelerations can
provide a first level monitoring parameter for the
detection of fetal distress.
Finally, as mentioned before, low entropy values
may also indicate repetitive patterns around the FHR
baseline which are not classified as accelerations or
decelerations. These are usually suspicious or
pathological and are difficult to detect with the
visual inspection only.
NON-LINEAR ANALYSIS OF FETAL HEART RATE IN CARDIOTOCOGRAPHY USING SAMPLE ENTROPY
247

4 CONCLUSIONS
Nonlinear measures of biological time series such as
FHR are important tools to improve the conventional
medical analysis. This work suggests the use of the
Sample Entropy for 5 minutes windows datasets to
visualize this nonlinear metric evolving in time.
One of the main conclusions is that repetitive
patterns of FHR result on small values of SampEn.
This agrees with usual medical interpretation and
could detect pathological cases related to this
condition, since high values of SampEn are usually
expected for healthy fetuses.
In the same way, low short-term FHR variability
also results in low levels of entropy. Another
important result is that the presence of significant
transient changes in FHR, such as decelerations and
accelerations also caused SampEn to decrease.
We suggest that medical staff should consider
the use of FHR SampEn as a measure of system
complexity and a viable complementary tool to help
measure fetal health.
Nonlinear surrogate FHR analysis is going to be
presented in future works. Besides, other approaches
can be considered, such as Approximate Entropy
and Lempel-Ziv Complexity to compare the results.
ACKNOWLEDGEMENTS
Dr. Marques wishes to acknowledge Trium Analysis
Online GmBH, Munich, Germany and LESC
(Laboratório de Engenharia e Sistemas de
Computação) at UFC, Fortaleza, Brazil for their
support.
REFERENCES
Doganaksoy, A., & Göloglu, F. (2009). On Lempel-Ziv
Complexity of Sequences. Athenas: Department of
Mathematics.
Ingemarsson, I., Ingemarsson, E., & Spencer, J. A. (1993).
Fetal Heart Rate Monitoring – A Practical Guide.
New York: Oxford Medical Publications – Oxford
University Press.
Kaplan, D., & Staffin, P. (2008). Retrieved November 30,
2009, from Software for Heart Rate Variability:
http://www.macalester.edu/kaplan/hrv/doc/
Marques, J. A., Cortez, P. C., & Madeiro, J. P. (2010).
Fetal Heart Rate Variability Analysis in
Cardiotocographic Exams. Brazilian Conference on
Health Informatics. Porto de Galinhas: SBIS.
Mathworks. (2009). Matlab. Retrieved Julho 10, 2011,
from Mathworks: http://www.mathworks.com
Pincus, S. M. (1991). Approximate Entropy as a measure
of System Complexity. Proceedings of the National
Academy of Science , pp. 2083-2088.
Richman, J. S., & Moorman, J. R. (2000). Physiological
time-series analysis using approximate entropy and
sample entropy. American Jounal of Physiology -
Heart and Circulatory Physiology , pp. H2039-H2049.
Kantz, H., & Schreiber, T. (1997). Nonlinear Time Series
Analysis. Cambridge. Cambridge University Press.
BIOSIGNALS 2012 - International Conference on Bio-inspired Systems and Signal Processing
248
