
INTERPRETATION OF EOG DATA IN ORDER
TO OBSERVE EYE MOVEMENTS
Tina Meißner and Harald Loose
Department of Computer Science and Media, Brandenburg University of Applied Sciences,
Magdeburger Str. 50, 14770 Brandenburg, Germany
Keywords:
Eye tracking, EOG, Eye movement.
Abstract:
This paper deals with the possibilities of observing eye movements from EOG recordings. First the setup
for the recording of eye movements, then the EOG method, which is used to obtain eye movements in the
experimental context, are explained. The first recordings resulted in the detection of eye movements within
the EOG data and the results were put into relation to the gaze points gained from the eye tracking system.
In addition to these subjective observations a first attempt at quantification of the dependency between EOG
signal and gaze points is presented. Though faced with a few problems, it was possible to put numerical values
for distances in relation to signal amplitudes of the EOG.
1 INTRODUCTION
The capture and interpretation of eye movements ha-
ve been done since the 19th century. Countless stu-
dies have been carried out with different interpretati-
on goals regarding the eye tracking data. There are
eye tracking studies which are focused on usabili-
ty, on human-machine interaction, on behavior (psy-
chological, physiological) and so on. The techniques
have changed from simple observation of the move-
ments and automatic capture of the eye to mobile head
mounted eye trackers which work with digital came-
ras and LEDs. There are several publications on eye
movement and eye tracking methods. Duchowski’s
work (Duchowski, 2007) is a fundamental approach
to the topic of eye tracking methodology. In order to
understand what exactly eye movements are and how
it is possible to retrieve them on a less technical basis,
Joos et al. (Joos et al., 2003) published an overview
of eye movements and their applications.
Nowadays the commercial eye tracking systems
which work with LEDs and camera recordings are the
most common way to gain eye tracking data. They
provide reliable gaze points with little effort. The dis-
advantages are the dependency on these systems and
the limited adaptability to own experimental needs.
Another negative aspect is the physical constraint of a
subject. When the eye tracking system is permanent-
ly installed to a work space, the proband has to be in
front of it during the whole experiment with small to-
lerated head movements. This side effect requires al-
ternatives. The following paper follows the idea to re-
place the eye tracking system with EOG signals. An
experimental setup was created in which eye tracking
data is recorded and an EOG derivation is made. Aim
of this experiment was to detect eye movements in
EOG data and be able to derivate exact gaze points
from the EOG signals.
2 RECORDING AND
PROCESSING OF EYE
MOVEMENTS
The commercial eye tracking system Nyan 2.0XT (In-
teractive Minds
1
) was used to get reference data. Ny-
an 2.0XT is a commercial software which is distribu-
ted with the eye tracking system of LC Technologies
2
.
An alternative is the recording of EOG (Electrooculo-
graphy) signals. In this setup a system from Neuro-
werk (SIGMA Medizin-Technik
3
) was used to derive
eye movement signals. The characteristics of this me-
thod are introduced in subsection 2.2. In subsection
2.1 an overview of the experimental setup in which
1
http://www.interactive-minds.com/de/eyetracking-
software/nyan-2
2
http://www.eyegaze.com/
3
www.neurowerk.de
393
Meißner T. and Loose H..
INTERPRETATION OF EOG DATA IN ORDER TO OBSERVE EYE MOVEMENTS.
DOI: 10.5220/0003776603930397
In Proceedings of the International Conference on Bio-inspired Systems and Signal Processing (BIOSIGNALS-2012), pages 393-397
ISBN: 978-989-8425-89-8
Copyright
c
2012 SCITEPRESS (Science and Technology Publications, Lda.)
the recordings and tentative interpretations were ma-
de is explained.
2.1 Experimental Setup
The experimental setup was based on former biosi-
gnal experiments as well as first test scenarios for col-
lecting EOG data. A subject had to look at a screen
presentation while the eye movements were simul-
taneously recorded using both devices. The screen
presentation consisted of 24 slides. Each of them is
shown for four seconds (details in section 3).
The subject was seated in front of the monitor wi-
thin a distance of 60-70 cm. The recording was car-
ried out two times to have the possibility to compare
the recordings and their resulting interpretations.
The recorded eye tracking data were visualized
using Nyan 2.0XT. A program called EyeValuation
was developed to import, analyze and visualize eye
tracking data. The proprietary EOG signals were im-
ported into MATLAB
4
and splitted into slides or
groups of slides for visualization.
2.2 Functionality of the EOG
The electrooculography is the measurement of the po-
tential difference between the positively charged cor-
nea and the negatively charged retina. The eye’s elec-
trical field is measurable through surface electrodes
near the eye: Electrodes are placed left to the left eye
and right to the right eye to obtain horizontal eye mo-
vements, above and under the left eye for vertical mo-
tions. Two separate signals with positive and negati-
ve amplitudes as an indicator of eye movement are
received. When the eyes move to the right the vol-
tage changes to a positive value. During a leftwards
movements, the voltage inverts to a negative value
(Malmivuo and Plonsey, 1995, p. 580). During an up-
ward (vertical) motion of the eyes, the signal’s volta-
ge drops into the negative area and vice versa when
the eyes move downward. By having both signals it
is pretty easy to get a general idea of where the eyes
are moving towards, but it is difficult to pinpoint the
exact gaze position. The analysis of the EOG signals
is presented in section 3.
3 RESULTS
As mentioned before the commercial eye tracking sy-
stem was used in former experiments and its reliabi-
lity was tested. In this experiment the eye tracking
4
The MathWorks, Inc.: MATLAB http://www.math-
works.com/
system acts as a reference for comparing the EOG
data to the correct eye movements and gaze points.
It provides information about the location and dura-
tion of a gaze point and enables an interpretation of
the EOG data. The following subsections presents the
eye tracking and EOG data received during the expe-
riment for selected slides and a first quantification of
the EOG values in regard to exact gaze points.
3.1 Task Slides
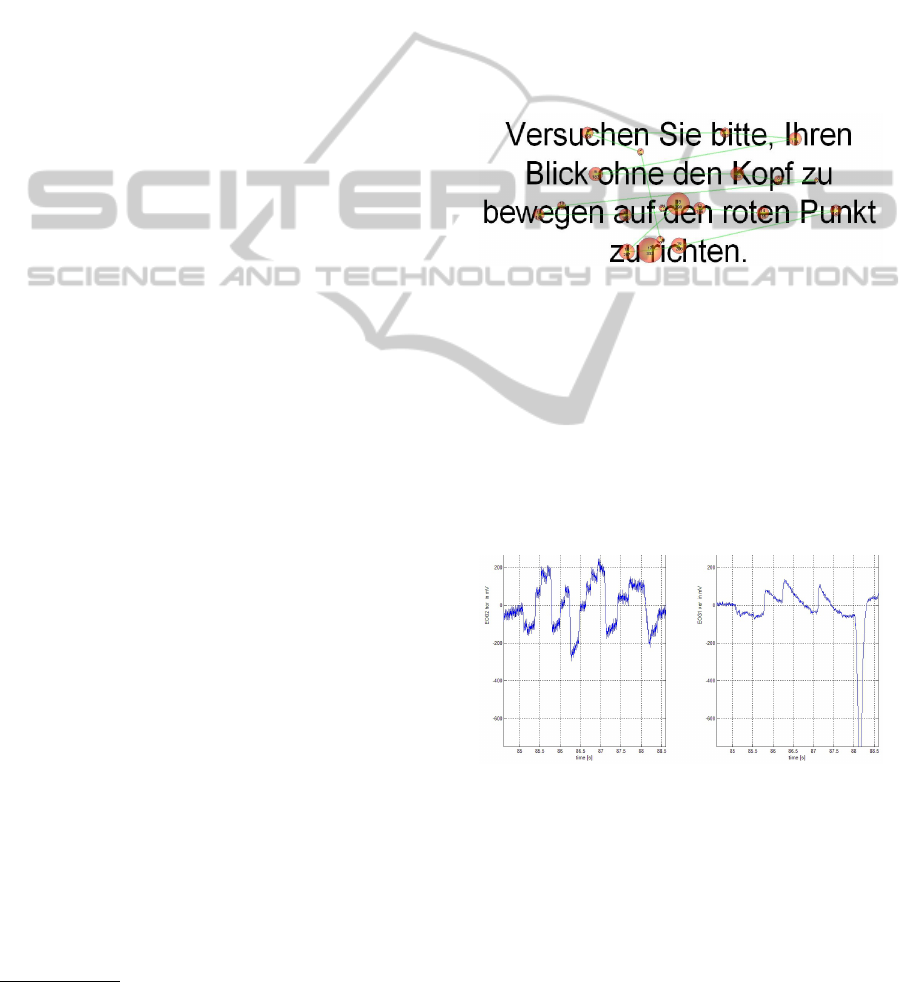
After an initial slide there are task slides with instruc-
tions for the proband. The fixation points of the sub-
ject and saccades are visible in fig. 1.
Figure 1: Fixation points and saccades from task slide.
The gaze points that exceed a certain gaze time du-
ration (fixations) are represented by circles. The larger
the diameter of the circle, the longer the gaze durati-
on. The sequence of reading is apparent through the
movements from one fixation point to the other (sac-
cades). The subject started at the top left and succes-
sively read the four lines. Looking at the EOG data of
the task slide (see fig. 2) the reading rhythm is reco-
gnizable. On both sides (horizontal and vertical mo-
Figure 2: EOG data for task slide (left: horizontal move-
ments, right: vertical movements).
vements) the reading of the four lines of the task slide
can be identified. The horizontal eye movement fol-
lows a regular flow from left (negative) to right (po-
sitive), then the eye moves left to the beginning of a
new line and moves to the right again. This happens
for each line. The length of the lines corresponds to
the transition from the negative to the positive volta-
ge range. The third left to right development is the
BIOSIGNALS 2012 - International Conference on Bio-inspired Systems and Signal Processing
394
longest which is in conformity with the length of the
third line. This similarity indicates a direct dependen-
cy between distances on screen and values between
negative and positive peaks.
The vertical movements show the same dependen-
cies between distance and voltage values like the ho-
rizontal movements. The difficulty of analyzing the
EOG signals is the quantification of the voltage va-
lues.
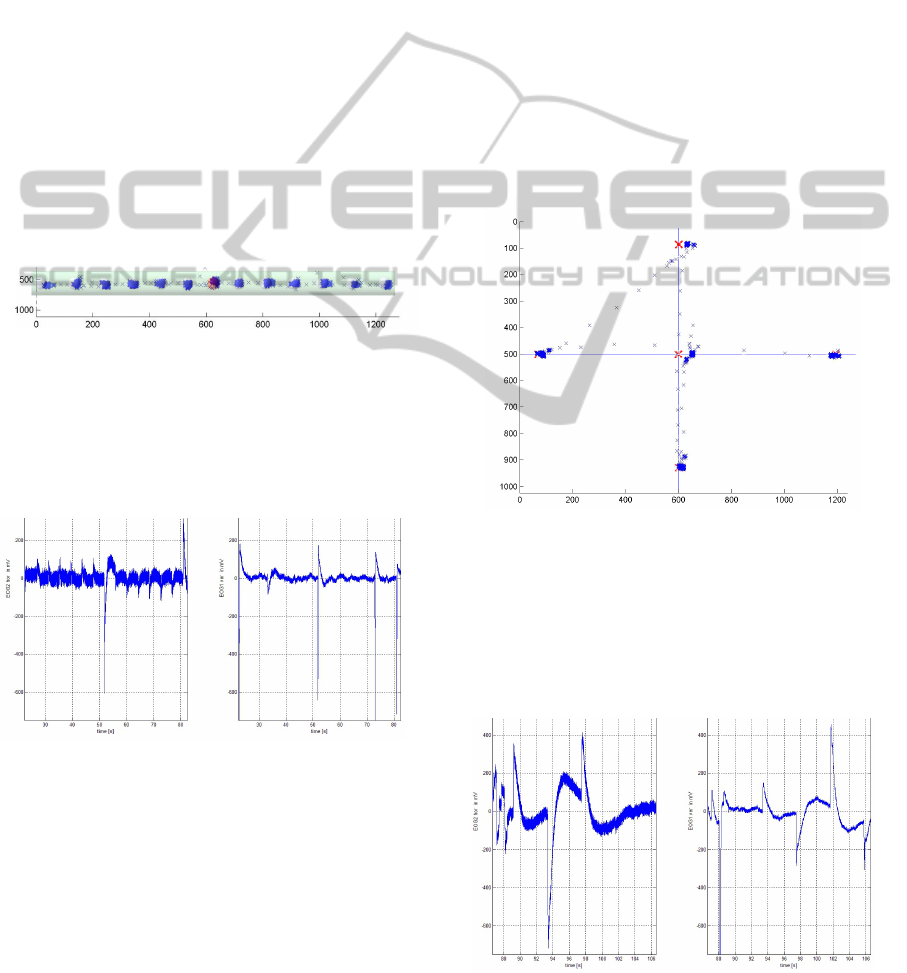
3.2 Angle Slides
In the experiment there were angle slides where a red
dot wanders from the center of a bar to the right in
steps of six, back to the center, then six steps to the left
and back to the center. The distance between each step
covers about 10 degrees, which is about 100 pixels on
the screen (of the experiment). The sequence of the
moving point can be detected best in the fig. 3 which
was generated in the EyeValuation program.
Figure 3: Gaze points for angle slide (slide is integrated).
Every point had to be fixated for four seconds
which the subject did quite smoothly. The complete
EOG signal for the angle slide section is shown in fi-
gure 4. The horizontal movements were made evenly.
Figure 4: EOG data for angle slides (left: horizontal move-
ments, right: vertical movements).
It is possible to detect the six steps to the right (ca. 100
µV each). The distance between the steps on screen
was about 100 pixels, ergo 100 pixels are represented
through 100µV. The noticeable drop towards the ne-
gative voltage spectrum is due to the jump from the
outer right point to the center (movement to the left).
The six steps to the left can be detected as well (-100
µV). Though, not in this figure apparent, both peaks
from the sides to the center have approximately the
same value which proves the dependency between di-
stance on screen and the measured EOG amplitude. If
100 pixels are represented by 100 µV, 600 pixels must
be aquivalent to 600 µV and this is what was measu-
red (see fig. 4).
Since the task was to follow the red dot on a bar,
there are no major vertical movements. The noticea-
ble outliers are simply blinks of the subject and should
not disturb the analysis.
3.3 Fixation Crosses
In order to receive vertical movements, a fixation
cross sequence on five slides was created: cross right,
left, up, down and center. The gaze points for the who-
le fixation cross process as well as the combined cross
slides are presented in fig. 5.
Figure 5: Gaze points from fixation crosses slide (red cros-
ses: fixation crosses from slides).
The gaze points are almost identical to the fixation
crosses; the paths from one cross to another are reco-
gnizable. The EOG data for the whole fixation crosses
section is shown in fig.6.
Figure 6: EOG data from fixation crosses (left: horizontal
movements, right: vertical movements).
INTERPRETATION OF EOG DATA IN ORDER TO OBSERVE EYE MOVEMENTS
395
At 94 seconds there is a very strong amplitude
in the negative voltage area of the horizontal signal.
This is due to the crossing of the slide from the right
cross to the left cross. The values validate again that
the distance the eye has to cover is proportional to
the change of the EOG signal.The same is observable
when the subject had to look at the upper cross. Du-
ring the left-to-top-movement the signal of the verti-
cal movement changes, too. The upward eye move-
ment is clearly detectable (-300 µV). The same is ob-
served for the down movement from the top cross to
the lower cross (450 µV). Afterwards the signal con-
verts into a negative run because the eye moves from
the lower cross to the middle cross and the sequence
is over. During those movements the horizontal signal
evens out at around zero because no further left-right-
movements are made.
It was easy to detect eye movements through an
EOG system. The proband is not restricted in the usu-
al movements and a technical calibration, like it has
to be done for the commercial eye tracking system,
is not needed. The disadvantage of the EOG system,
compared to the gaze positions from the eye tracking
data, is the lack of quantification of the voltage values
in order to receive pixel positions. An attempt of such
quantification is mentioned in subsection 3.4.
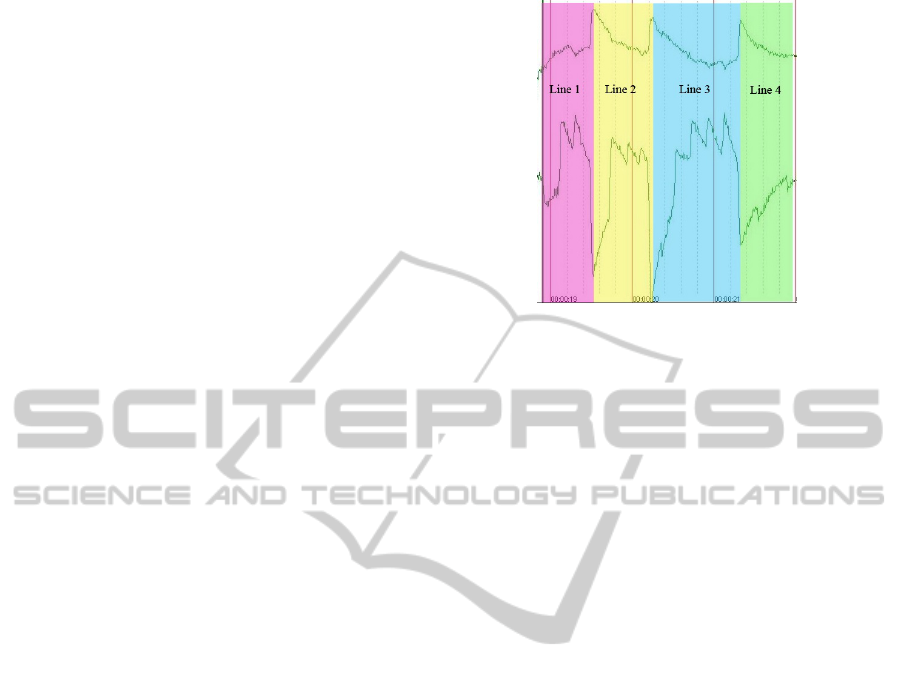
3.4 Quantification of EOG Data and
Eye Movements
The filtered (Notch filter) EOG signal, provided by
the Neurowerk software, was analyzed to derive exact
gaze points from voltage values. The quantification
was done for a task slide which consists of four lines
to be read (see figure 1). The signal has been ”split-
ted” into four parts to be able to measure and compare
voltage values and gaze points (see fig. 7). The ampli-
tudes of the line breaks (end of one line to the begin-
ning of the next line) for vertical and horizontal mo-
vements were chosen for a sample quantification. The
length of the signal change was measured and quan-
tified. In order to compare those values to a distance
covered on screen, the gaze points for the reading sec-
tion have been examined within EyeValuation.
During vertical movements one pixel can be re-
presented by 0.95 µV, during horizontal movements
one pixel covers about 1.76 µV. It was possible to
calculate approximated values for the vertical move-
ments. First the starting point had to be determined
from the position of last upward movement until the
peak of normalization (striving towards 0). The cal-
culated starting point is around 385 px. The starting
point according to the gaze points in EyeValuation is
375 px, so it is a pretty good result.
Figure 7: Filtered and labeled EOG data (from Neurowerk).
For the starting point of line two the distance from the
last peak up until the starting of the downward mo-
vement (maximum amplitude) is needed. The calcu-
lation of the starting point of line 2 result in a value
of around 478 px. Compared to the gaze point from
EyeValuation, which is around 480, the result is very
satisfying. The same happens with the other two li-
nes, the results are always in the proximity of the eye
tracking position.
The calculation of horizontal positions is a bit mo-
re complicated. The micro jumps caused be fixations
and saccades while reading have to be included into
the calculations, therefore increasing the amount of
work. These calculations are not part of this paper.
4 CONCLUSIONS
The information gain of the EOG when compared to
proven measuring systems (eye tracking system) is
high. It is recommendable to use the EOG system in
combination with commercial eye tracking systems to
obtain verified results. EOG data is useful in the field
of eye movement analysis. The problems described in
section 3 are the initial point for the continuation of
this experiment. The first results were satisfying for
vertical eye movements.
The development of an eye tracking system with
an integrated EOG system to visualize and interpret
both data sets could be the next goal, offering fields
of application in health business.
REFERENCES
Duchowski, A. (2007). Eye Tracking Methodology: Theory
and Practice. Springer Verlag.
BIOSIGNALS 2012 - International Conference on Bio-inspired Systems and Signal Processing
396

Joos, M., Ritting, M., and Velichkovsky, B. (2003). Die
Bewegungen des menschlichen Auges: Fakten, Me-
thoden, innovative Anwendungen. In Psycholingui-
stik: Ein internationales Handbuch, pages 142–168.
De Gruyter.
Malmivuo, J. and Plonsey, R. (1995). Bioelectromagnetism:
Principles and Applications of Bioelectric and Bioma-
gnetic Fields. Oxford University Press.
INTERPRETATION OF EOG DATA IN ORDER TO OBSERVE EYE MOVEMENTS
397
