
DEVELOPMENT OF A PULSE OXIMETER AND BLOOD
PRESSURE MEASUREMENT DEVICE
Ana F
´
e
1
, Joana Sousa
2
and Hugo Gamboa
1,2
1
Departamento de F
´
ısica, Faculdade de Ci
ˆ
encias e Tecnologia, Universidade Nova de Lisboa, Monte da Caparica, Portugal
2
PLUX - Wireless Biosignals, S.A., Lisboa, Portugal
Keywords:
Pulse oximeter, Oximetry, Blood pressure, Pulse transit time.
Abstract:
The aim of this study was to develop a device that measures both oxygen saturation (S
p
O
2
) and Blood Pressure
(BP), non-invasively, continuously and without a cuff. The pulse oximeter was developed for transmission
and reflection mode, for use in finger and wrist, respectively. The oxygen saturation results obtained with the
developed device placed on the wrist reveled an high relation with an market device. For BP measurement
there were tested 3 different combination of sensors localizations to obtain Pulse Transit Time (PTT): ECG
and pulse oximeter on the finger, ECG and pulse oximeter on the wrist and pulse oximeter on the wrist and
photoplethismogram on finger, and two calibration modes: for each subject - without input parameters - and
general - with one input parameter (height). The results reveled better correlation between the BP estimated
with the first calibration and the reference method (cuff-based) than for the second calibration.
1 INTRODUCTION
The health condition of patient can be evaluated ac-
cording to different parameters, including: heart rate
(HR), Blood Pressure (BP), respiratory rate, tempera-
ture and Oxygen Saturation (S
p
O
2
) (Haahr, 2006).
According to World Health Organization (WHO),
cardiovascular diseases are the main cause of deaths
(Wong et al., 2009) (WHO, 2011). In Portugal, car-
diovascular diseases are the leading cause of death,
accounted for about 40% of deaths in 2009 (PS,
2011).
Thus, there is an increasingly demand for non-
invasive and continuous monitoring of important fac-
tors for assessing and preventing these and other dis-
eases.
The oxygen saturation (S
p
O
2
) is an efficiency in-
dicator of gas exchange in the lungs and is quite im-
portant to determine deficiencies in respiratory sys-
tem, diagnosis of diseases (such as cyanosis or hypox-
emia), or anesthesia prescription (Daminani, 2010).
This parameter can be extracted from a Pulse
oximeter. Pulse oximetry is an optical and non-
invasive technique tha allows to access the percent-
age of oxygen in blood (Sola et al., 2005). This
technique measures the blood oxygen saturation dur-
ing cardiac cycle by shinning an infrared (IR) and
red ligth-emission diode (LED) through the tissues.
From the different tissues ligth absorption results a di-
rect current (DC) and alterning current (AC) (Reisner
et al., 2008).
The estimation of S
p
O
2
is made switching the red
and infrared LEDs in a higher frequency than cardiac
frequency. Thus, S
p
O
2
is obtained by applying Equa-
tion 1:
S
p
O
2
= A − B ∗R,with (1)
R = (AC
red
∗ DC
IR
)/(AC
IR
/DC
red
) (2)
A and B are constants extracted from a calibration
curve. AC
red
and DC
red
represent the magnitudes of
the pulsatile and DC parts of the red-PPG, respec-
tively. AC
in f rared
and DC
in f rared
represent those mag-
nitudes but from IR-PPG (Reddy et al., 2009).
S
p
O
2
can be measured in two modes: transmis-
sion and reflection. In the first the probe is placed so
that the LED and the photodetector stay on opposite
sides of the tissue and is measured the light that is
transmitted. In the second this two components are
placed in the same side of the tissue and is measured
the light that is reflected by the deeper structures (like
bone) and returns to the surface (Reisner et al., 2008).
The combination of pulse oximeter with an ECG
signal, allows to obtain another important parameter
for patient clinical state evaluation, the Pulse Transit
201
Fé A., Sousa J. and Gamboa H..
DEVELOPMENT OF A PULSE OXIMETER AND BLOOD PRESSURE MEASUREMENT DEVICE.
DOI: 10.5220/0003781402010206
In Proceedings of the International Conference on Biomedical Electronics and Devices (BIODEVICES-2012), pages 201-206
ISBN: 978-989-8425-91-1
Copyright
c
2012 SCITEPRESS (Science and Technology Publications, Lda.)
Time (PTT) that correlates with the BP. PTT refers to
the time it takes a pulse wave to travel between two
arterial sites (Naschitz et al., 2004).
One of the factors that have great influence on BP
is the speed at which a blood pulse moves (velocity
pulse propagation - VPP). This is proportional to BP.
So, PTT and BP are inversly proportional (Naschitz
et al., 2004).
The measurement of this parameter implies the
detection of an arterial pulse arrival at two different
arterial sites. In typical measurement, this process de-
pends on the acquisition of two different physiologi-
cal signals: ECG and PPG. The first detects the ven-
tricular depolarization by R wave. The second detects
when the pulse wave arrives to an arterial extremity.
However, measuring PTT can also be performed us-
ing two PPGs (Payne et al., 2006).
Although there are several approaches to how the
BP and PTT are mathematically related, the relation-
ship between BP and the PTT is described as near-
linear (Payne et al., 2006).
The non-invasive method most used in clinical
practice to perform non-invasive measurement of BP
is the sphygmomanometer (cuff-based method). Al-
though this gives results with good accuracy, the tech-
nique has the disadvantage of not detecting short-term
changes, as so, not performing continuous monitoring
of BP. Furthermore, the use of the cuff can lead to dis-
orders that takes to patient’s blood pressure changes
due to the cuff inflation (Gesche et al., 2011).
The main goal of the present work was to develop
a finger and wrist oximeter and to study a new tech-
nique to measure and continuously monitoring BP, us-
ing the ECG and PPG signals.
2 METHODS
Two different studies were made in order to obtain
Oximetry and Blood Pressure. The first includes the
development of a pulse oximeter (called oxiPlux),
calibrated using a data of a market oximeter (Nonin
Onyx II, Model 9550). The second study refers to
the analysis of the best method to obtain BP from
PTT measurements by comparing with a cuff-based
method (sphygmomanometer: Elta - Model: BM101
(HL168B)).
All the sensors used were connected to bioPLUX
Research, with acquisition frequency of 1 kHz, which
sends data via bluetooth and in real-time to PC. The
algorithms used to obtain the desired parameters were
implemented offline in Python.
2.1 Pulse Oximeter
2.1.1 Sensor Description
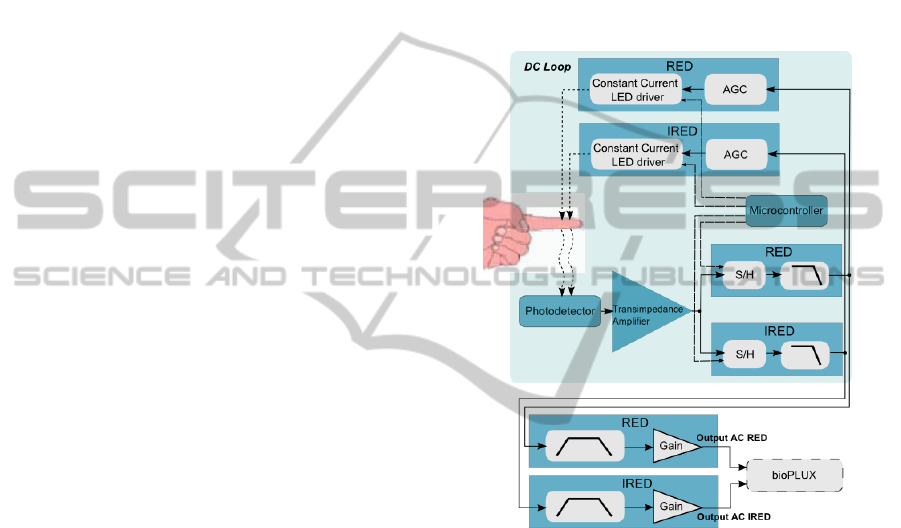
It was developed a pulse oximeter with an auto-
matic gain control (AGC). The sensor has a feedback
mechanism, the DC loop, that consists of a photode-
tector, a transimpedance amplifier, two sample-and-
holds (S/H), two low pass filters, two AGC circuits
and two led drive current circuits. In the Figure 1 is
shown the block diagram of the developed sensor.
Figure 1: Block Diagram of the developed pulse oximeter.
After transimpedance amplifier, are the two
sample-and-hold circuits that are used for de-
multiplexing the red and infrared signals. The sam-
pling frequency and the LEDs turn on/turn off are set
by a microcontroller. Both LEDs are never connected
at same time.
The AGC circuits, implemented after the low pass
filters, are composed of error amplifiers that enable to
compare the received voltage in a reference channel
with the output and adjusts the output voltage accord-
ingly. That means that DC voltage of red and infrared
circuits become equal to a reference voltage. Since
this part of the circuit is connected to the led current
driver part (a voltage to current convert that controls
the LED current), the intensity of both LEDs can be
controlled based on the light that is received by the
photodetector.
After the DC loop there is a 0.4Hz high pass filter,
followed by a Gain Stage and another Low Pass Filter
BIODEVICES 2012 - International Conference on Biomedical Electronics and Devices
202
(cutoff frequency 7Hz).
The output of the sensor is two AC signals: one
from red and another from infrared absorption. Hav-
ing a DC stabilized tension (for both wavelengths),
the Equation 2 simplifies to:
R
0
= AC
red
/AC
in f rared
(3)
The AC signals were processed in order to obtain
R’ and, after calibration, S
p
O
2
. The developed algo-
rithm can be divided in four steps:
• Detection of red and infrared PPG peaks posi-
tions;
• Application of Equation (3) in the peaks positions
detected above, to obtain R’;
• Average of five consecutive values of R’;
• Application of calibration equation to obtain
S
p
O
2
.
2.1.2 Data Aquisition and Calibration
It was studied the developed pulse oximeter working
in relfection mode, placed on the wrist, over the ul-
nar arterie area, in normoxia conditions. A group of
6 volunteers, ages 22-27 participated in that study.
The individuals were considered healthy, without any
known disease. All the measurements were made in
rest.
The pulse oximeter calibration was made by com-
parison. The data (R) obtained with the developed de-
vice was fit to the data (S
p
O
2
) obtained with Nonin,
using a linear regression.
2.2 Blood Pressure by Pulse Transit
Time
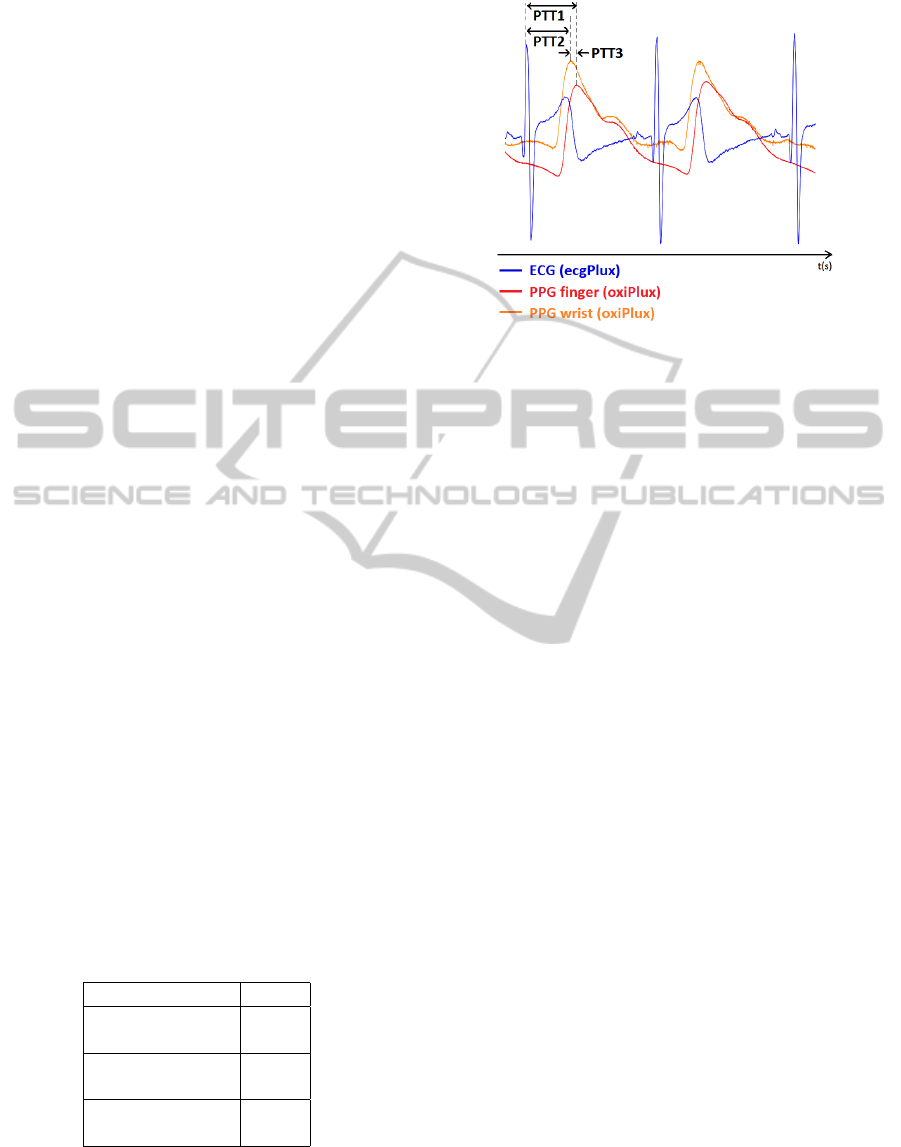
Table 1 and Figure 2 shows the PPTs obtained from
different sensor combinations for the BP study.
Table 1: Different sensors combinations used to obtain PTT
- Pulse Transit Time.
Sensors PTT
ECG PTT1
oxiPlux in finger
ECG PTT2
oxiPlux in wrist
oxiPlux in wrist PTT3
oxiPlux in finger
In order to obtain BP from PTT, a group of acqui-
sitions were made, with a 3-lead ECG sensor (ecg-
PLUX) placed at cheast (V2 derivation), oxiPLUX on
Figure 2: Typical PPG and ECG output signals and PTTs
obtained by the developed algorithms.
rigth index finger, oxiPlux on rigth wrist and sphyg-
momanometer in left wrist. A group of 6 individ-
uals, ages 22-27 , heigth 1.55 m - 1.96 m, without
any known disease, were volunteers. All the measure-
ments were made at rest.
The acquisitions were made during 10 minutes
and the sphygmomanometer was connected every two
minutes (aproximately), in order to obtain BP, systolic
(SBP) and diastolic (DBP).
2.2.1 ECG and PPG
From ECG and PPG signals, the PTT (PTT1, PTT2)
was calculated as the difference between the R wave
of ECG and the maximum point of red PPGs. The
algorithm used for that calculation can be resumed in
3 points:
• Detection of ECG R peak positions;
• Detection of red PPG peak positions;
• Obtain the difference between the position of
ECG peak and PPG peak - PTT;
With the PTT values, the BP was estimated by fit-
ting the data obtained from the cuff-based method val-
ues and the PTT, applying a linear regression. That
estimation was made using two different aproaches:
• Calibration 1 - for each subject and without input
parameters (Cal 1 - individual curve calibration
for each user), as shown in Equation (4);
• Calibration 2 - general and with one input param-
eter (Cal 2 - same calibration curve for all users),
as shown in Equation (5).
BP = m ∗ PT T + b (4)
DEVELOPMENT OF A PULSE OXIMETER AND BLOOD PRESSURE MEASUREMENT DEVICE
203
BP = m ∗ (PT T/ f ) + b (5)
The variables m and b are the fitting values and
f is a body correlation factor related to height (Fung
et al., 2004).
2.2.2 PPG and PPG
By using only PPG signals (on the finger and on
the wrist), the developed study aims to obtain PTT
(PTT3) and estimate the BP. The resumed algorithm
used to obtain that parameters is:
• Detection of finger PPG peak positions;
• Detection of wrist PPG peak positions;
• Obtain difference between the positions obtained
above - PTT;
With PTT values BP was estimated in two, ap-
plying Calibration 1 (Equation 4) and Calibration 2
(Equation 5).
3 RESULTS
3.1 Oximetry Study
The main objective of that study part was to obtain
an instrument that gives quantitative measurements
S
p
O
2
. Calibration was a crucial part of the whole pro-
cess and so this was the first step of the study. It was
obtained a calibration curve for this sensor, working
in reflection and for wrist placemnet, witch have a R
2
iqual to 0.74.
The Table 2 presents presents a comparison be-
tween the S
p
O
2
(%) results obtained with the oxiPlux
probe placed at wrist and Nonin. The mean and the
standard deviation (σ) of S
p
O
2
for both sensors were
calculated.
Table 2: S
p
O
2
(%) obtained with oxiPlux with wrist probe
and Nonin: comparison results in normoxia.
Subject oxiPlux wrist: Nonin:
S
p
O
2
± σ S
p
O
2
± σ
1 97.41 ± 0.14 97.29 ± 0.76
2 96.87 ± 0.16 96.38 ± 0.52
3 96.19 ± 0.16 96.13 ± 0.64
4 96.97 ± 0.29 97.13 ± 0.64
5 98.17 ± 0.41 97.31 ± 0.21
6 98.33 ± 0.52 98.54 ± 0.36
The results obtained from the oxiPlux placed on
the wrist (Table 2) are in the range of values obtained
from Nonin. The Nonin accuracy is ±2% (Nonin,
2011), so for 97% oxygen saturation it is possible that
the real oxygen saturation value is 97%±1.94. Calcu-
lating that error for all the subjects is possible to verify
that the S
p
O
2
obtained from oxiPlux is allways in that
range of values obtained from Nonin.
The oxiPlux sensor uses a continuous acquisition
system. It allows to detect all the changes in S
p
O
2
values (which occur at intervals of 1 ms). The results
obtained from Nonin were collected at intervals of 10
s, so the S
p
O
2
variations that may have occurred be-
tween that interval were not detected. This may ex-
plain the small discrepancies in the results.
Despite the small differences between oxiPlux and
Nonin, the outcomes show that oxiPlux can detect
changes in S
p
O
2
when a reflection mode is used, with
the probe placed on wrist.
3.2 Blood Pressure Study
In the BP study, the calibration results obtained are
more accurate for SBP than for DBP. The coeficiente
of determination interval values for Calibration 1 are
presented in Table 3, for SBP and DBP.
Table 3: Coeficient of determination (R
2
) interval values for
estimation of SBP and DBP from different PTTs - Calibra-
tion 1.
PTT SBP: DBP:
PTT1 0.14 - 0.95 0.10 - 0.79
PTT2 0.73 - 0.90 0.18 - 0.41
PTT3 0.40 - 0.99 0.22 - 0.99
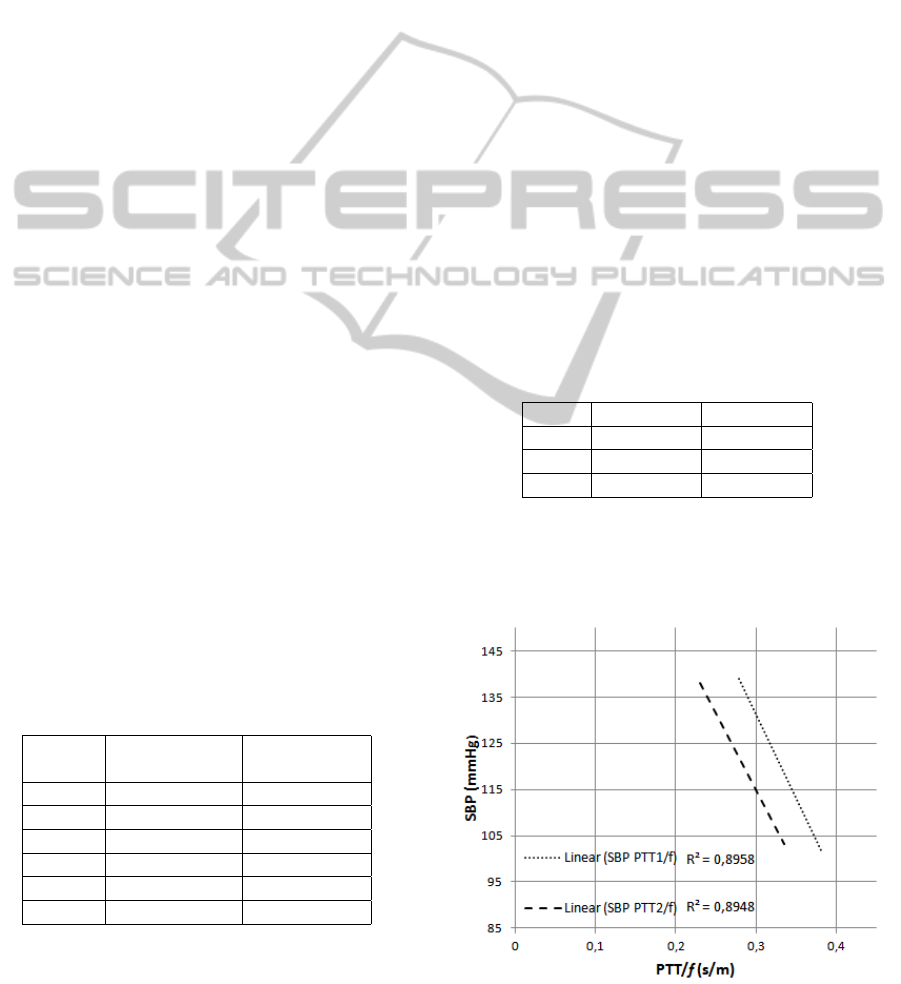
For Calibration 2 the obtained R
2
results for SBP
estimation (obtained from PTT1 and PTT2) are rep-
resented in Figure 3.
Figure 3: Calibration curves obtained from Calibration 2 for
SBP.
BIODEVICES 2012 - International Conference on Biomedical Electronics and Devices
204

Table 4: Comparison between SBP (mmHg) estimated with Cal 1 and Cal 2 and the cuff values.
Subject Cuff SBP from PTT1: SBP from PTT2: SBP from PTT3:
Cal 1: SBP ±σ Cal 1: SBP ±σ Cal 1: SBP ±σ
Cal 2: SBP ±σ Cal 2: SBP ±σ
1 130.86 ± 6.33 135.91 ± 3.33 136.12 ± 4.10 138.81 ± 17.03
133.13 ± 1.90 137.39 ± 3.14
2 116.67 ± 3.88 109.75 ± 11.18 114.81 ± 0.83 121.09 ± 3.02
135.50 ± 3.94 148.39 ± 2.58
3 132.00 ± 7.18 131.47 ± 11.13 138.97 ± 12.93 141.42 ± 11.53
136.93 ± 1.56 137.93 ± 1.88
4 131.8 ± 6.61 123.87 ± 6.39 132.57 ± 1.98 139.55 ± 6.41
121.53 ± 5.07 127.29 ± 3.22
5 120.33 ± 2.16 119.21 ± 1.17 120.31 ± 1.94 120.62 ± 2.37
118.70 ± 2.74 120.43 ± 3.53
6 104.83 ± 2.71 104.20 ± 2.86 103.82 ± 2.63 102.25 ± 4.50
108.11 ± 17.88 107.62 ± 22.58
Table 5: Comparison between DBP (mmHg) estimated with Cal 1 and Cal 2 and the cuff values.
Subject Cuff DBP from PTT1: DBP from PTT2: DBP from PTT3:
Cal 1: DBP ±σ Cal 1: DBP ±σ Cal 1: DBP ±σ
Cal 2: DBP ±σ Cal 2: DBP ±σ
1 68.00 ± 4.76 69.53 ± 1.39 69.53 ± 1.57 67.61 ± 7.68
70.67 ± 0.31 71.70 ± 0.53
2 70.83 ± 2.99 74.05 ± 1.71 71.01 ± 0.92 77.24 ± 2.71
71.07 ± 0.66 73.57 ± 0.43
3 69.00 ± 5.06 69.25 ± 5.63 67.75 ± 0.92 74.58 ± 3.87
71.30 ± 0.26 71.79 ± 0.32
4 72.67 ± 4.97 70.33 ± 3.73 77.83 ± 5.04 72.88 ± 4.72
68.74 ± 0.84 69.99 ± 0.54
5 68.60 ± 1.95 68.30 ± 1.70 68.20 ± 1.29 67.05 ± 2.08
68.27 ± 0.45 69.17 ± 2.62
6 61.60 ± 1.14 61.77 ± 1.08 61.75 ± 0.61 62.16 ± 0.97
66.51 ± 2.98 66.65 ± 3.83
After obtaining the calibration curves (Calibration
1 and Calibration 2), the developed algorithm was ap-
plied and the results obtained for SBP and DBP and
the comparison with the cuff results are exposed in
Table 4 and Table 5, respectively.
Concerning PPT3, the results for Calibration 2
shows a low value of R
2
so this results were not con-
sidered. This can be explained by the difficulty in to
find the best sensor placement on the wrist. This fact
can influence the magnitude and the quality of the sig-
nal and, consequently, become hard to collect a good
signal for detecting PPG peaks. As the sensors are so
close, on finger and on wrist, the PTT values obtained
are so low that the false or the lack detections in one
of them can lead to wrong calculations of PTT values
and so a low R
2
for the calibration.
From the outcomes of Figure 3 it can be ascer-
tained that for PTT1 and PTT2, R
2
has a value higher
than 85%, showing a great relationship between the
position of the sensors and SBP.
Analising Tables 4 and 5 is possible to verify that
the values obtained for SBP and DPB are in most
cases significantly related with the results obtained
from cuff method. It is also possible to observe that
some of the estimated BP are not in total concordance
with the cuff ones, but the difference between the
reference method and the estimated values are never
above the 32 mmHg, for SBP. It is known that if the
cuff is too small or if the cuff is placed over clothing,
the SBP can vary between 10 mmHg and 40 mmHg
(WelchAllyn, 2011). Thus, given the worst value for
the difference between the estimated and the refer-
ence SBP (32 mmHg), the presented method can give
a better estimation than an sphygmomanometer mis-
placed because this value is in the range of 10 - 40
mmHg.
The difference obtained in most cases can be ex-
plained by the low R
2
of some calibration Curves,
specialy for DBP in Calibration 2. Other possible ex-
planation is the need for adjust the body correlation
factor used, f. It was tested just one body correlation
factor (related to height), but the test of other body
correlation factors could be advantageous for future
studies.
DEVELOPMENT OF A PULSE OXIMETER AND BLOOD PRESSURE MEASUREMENT DEVICE
205

This BP study allowed us to conclude that the cus-
tomized calibration (Calibration 1) provides better re-
sults than the general (Calibration 2) for the tests per-
formed in this work. Still, it can be assumed that with
both calibrations was possible to obtain the SBP and
DBP.
4 CONCLUSIONS
The main goal of the present work was to develop a
device that allows the measurement of both S
p
O
2
and
BP without using a cuff, in a non-invasive, confort-
able and continuous mode.
The results show that the device works using both
ECG and pulse oximeter, or using only an optical
technique with the placement of two sensors, one in
finger and other in wrist (with two pulse oximeters).
It was also concluded that for BP estimation, a cal-
ibration for each subject, as an inicial calibration of
sensor for each user, gives more accurate results than
the BP estimated from a general calibration, even with
an input parameter.
This study proved to be a starting point for the
development of this device, that after some improve-
ments, specialy in signal processing, will conduct to
a medical device.
5 FUTURE WORK
A more effective calibration of the pulse oximeter,
with more subjects and with an induced hypoxic state,
is an important improvement for the next step of the
oxiPlux development. The transition from offline to
real-time software is also a development that will be
done for this sensor.
For the BP study, all the used approaches recourse
to linear regessions to relate PTT with BP, but an al-
ternative approach could be made using non-linear re-
lations to relate that two parameters. The study and
application of other body correlation factors, related
to height, can be also usefull to obtain more accurate
results.
ACKNOWLEDGEMENTS
This work was partially supported by National Strate-
gic Reference Framework (NSRF-QREN) under
projects ”LUL”, ”Affective Mouse”, ”wiCardioResp”
and ”Do-IT”, and Seventh Framework Programme
(FP7) program under project ICT4Depression, whose
support the authors gratefully acknowledge.
REFERENCES
Daminani, F. R. (2010). Proposta de prot
´
otipo de um
ox
´
ımetro de pulso empregando tecnologia FPAA.
Master’s thesis, Universidade de S
˜
ao Paulo - Escola
de Engenharia de S
˜
ao Carlos, So Paulo.
Fung, P., Dumont, G., Ries, C., Mott, C., and Ansermino,
M. (2004). Continuous noninvasive blood pressure
measurement by pulse transit time. In Engineering
in Medicine and Biology Society, 2004. IEMBS’04.
26th Annual International Conference of the IEEE,
volume 1, pages 738–741. IEEE.
Gesche, H., Grosskurth, D., Kuchler, G., and Patzak, A.
(2011). Continuous blood pressure measurement by
using the pulse transit time: comparison to a cuff-
based method. European Journal of Applied Physi-
ology, pages 1–7.
Haahr, R. G. (2006). Reflectance Pulse Oximetry Sensor
for the Electronic Patch. Master’s thesis, Technical
University of Denmark - MIC - Department of Micro
and Nanotechnology, Denmark.
Naschitz, J., Bezobchuk, S., Mussafia-Priselac, R., Sundick,
S., Dreyfuss, D., Khorshidi, I., Karidis, A., Manor, H.,
Nagar, M., Peck, E., et al. (2004). Pulse transit time
by r-wave-gated infrared photoplethysmography: Re-
view of the literature and personal experience. Journal
of clinical monitoring and computing, 18(5):333–342.
Nonin (2011). Nonin - nonin medical inc. [online] avalil-
able at: http://www.nonin.com/ [accessed 5 september
2011].
Payne, R., Symeonides, C., Webb, D., and Maxwell, S.
(2006). Pulse transit time measured from the ecg:
an unreliable marker of beat-to-beat blood pressure.
Journal of Applied Physiology, 100(1):136.
PS (2011). Portal da saude - ministerio da saude [online]
avalilable at: http://www.portaldasaude.pt/ [accessed
5 september 2011].
Reddy, K., George, B., Mohan, N., and Kumar, V. (2009).
A Novel Calibration-Free Method of Measurement
of Oxygen Saturation in Arterial Blood. Instru-
mentation and Measurement, IEEE Transactions on,
58(5):1699–1705.
Reisner, A., Shaltis, P., McCombie, D., and Asada, H.
(2008). Utility of the photoplethysmogram in circu-
latory monitoring. Anesthesiology, 108(5):950.
Sola, A. et al. (2005). Pulse oximetry in neonatal care in
2005. A comprehensive state of the art review. In
Anales de Pediatr
´
ıa, volume 62, page 266.
WelchAllyn (2011). Welch allyn [online] avalilable
at: http://www.welchallyn.com/[accessed 5 september
2011].
WHO (2011). World health organization - the top
10 causes of death [online] - available at:
http://www.who.int/mediacentre/factsheets/fs310
/en/index.html [accessed 5 september 2011].
Wong, M., Poon, C., and Zhang, Y. (2009). An evalua-
tion of the cuffless blood pressure estimation based
on pulse transit time technique: a half year study on
normotensive subjects. Cardiovascular Engineering,
9(1):32–38.
BIODEVICES 2012 - International Conference on Biomedical Electronics and Devices
206
