
WRAPPER AND FILTER METRICS FOR PSO-BASED CLASS
BALANCE APPLIED TO PROTEIN SUBCELLULAR
LOCALIZATION
S. Garc
´
ıa-L
´
opez
1
, J. A. Jaramillo-Garz
´
on
1,3
, J. C Higuita-V
´
asquez
2
and C. G Castellanos-Dom
´
ınguez
1
1
Signal Processing and Recognition Group, Universidad Nacional de Colombia
Campus la Nubia, Km 7 v
´
ıa al Magdalena, Manizales, Colombia
2
Departamento de Ingenier
´
ıa Qu
´
ımica, Universidad Nacional de Colombia
Campus Palogrande, Cra 27 No 64-60, Manizales, Colombia
3
Grupo de M
´
aquinas Inteligentes y Reconocimiento de Patrones - MIRP, Instituto Tecnol
´
ogico Metropolitano
Cll 54A No 30-01, Medell
´
ın, Colombia
Keywords:
Class imbalance, Filter, PSO, Separability criterion, Subsampling, Wrapper.
Abstract:
Recent advances in proteomic research have generated an unprecedented amount of stored data. Given the size
of current databases, manual annotation has become an almost intractable process, paving the way to the use
of computational methods. In this context, considering that a single protein can belong to several functional
classes, a multi-label classification problem is generated. The most common way to cope with these problems
is by training a number of classifiers equal to the number of classes that will allow taking independent decisions
on the membership of proteins. Nevertheless, this methodology leads to a high degree of imbalance between
classes, magnifying the disparity already present in their size. Current balancing techniques are based on
the optimization of criteria leading to a better subset that represent the data. Moreover, most of the sample
selection criteria are based on the Wrapper type metrics. However, Wrapper metrics are computationally quite
expensive. This work presents a comparative analysis between the Wrapper and Filter metrics as the sample
selection criteria in balance techniques. In order to accomplish this task, a subsampling technique based on
the Particle Swarm Optimization method to obtain the optimal balance subset is used. The results show that
filter metrics notably improved the computational cost obtaining a similar performance when compared with
the Wrapper type metrics.
1 INTRODUCTION
One fundamental goal in proteomics and molecular
biology is to identify protein functions of various cel-
lular organelles.
The subcellular localization of proteins can pro-
vide useful information on how and in what type
of environment proteins interact with each other and
with other molecules, thus providing important clues
to reveal their functionality and understanding the in-
tricate pathways that regulate biological processes at
the cellular level (Ehrlich et al., 2002), (Glory and
Murphy, 2007), (Chou and Shen, 2010). Although
this type of information can be acquired by conduct-
ing various biochemical experiment, it is usually very
time consuming and practically cumbersome. With
the avalanche of protein sequences generated in the
post-genomic era, it is highly desirable to develop
computational methods that can be used to identify
subcellular localization sites of novel proteins (Chou
and Shen, 2010). However, since proteins with cer-
tain specific locations are more abundant, there ex-
ists a high degree of disparity in the number of sam-
ples belonging to each class (Al-Shahib et al., 2005)
and, since machine-learning classifiers with unbal-
anced data usually generate larger bias (Meyer, 2007;
Sonnenburg et al., 2007), proteins of interest get clas-
sified in the redundant category.
There are several ways to address class imbalance
problems. One of the most commonly used strate-
gies is the sampling technique, which is composed of
subsampling and oversampling. Oversampling repro-
duces samples of the minority class until they reach
the same size as the majority class, either by sam-
ple replications (random) or by the generation of syn-
thetic samples (Chawla et al., 2002). However, this
strategy induces two major problems: i) over-training
(in the case of random-sampling) and ii) noise ad-
214
Garcia López S., A. Jaramillo-Garzón J., C. Higuita-Vásquez J. and G. Castellanos-Domínguez C..
WRAPPER AND FILTER METRICS FOR PSO-BASED CLASS BALANCE APPLIED TO PROTEIN SUBCELLULAR LOCALIZATION.
DOI: 10.5220/0003782702140219
In Proceedings of the International Conference on Bioinformatics Models, Methods and Algorithms (BIOINFORMATICS-2012), pages 214-219
ISBN: 978-989-8425-90-4
Copyright
c
2012 SCITEPRESS (Science and Technology Publications, Lda.)

dition in the training set (in the synthetic case), af-
fecting the reliability of protein localization (Chawla
et al., 2004), (He and Garcia, 2008). On the other
hand, subsampling eliminates samples of the major-
ity class, reaching the same minority class size. How-
ever, subsampling might eliminate useful data in the
induction model (He and Garcia, 2008). Despite this
problem, several studies have shown that subsampling
had a better performance when compared with many
oversampling techniques (Chawla et al., 2004). To
mitigate the loss of useful data, several subsampling
techniques using different criteria for the selection of
samples based on optimization techniques have been
proposed (He and Garcia, 2008).
(Pengyi et al., 2009) shown a subsampling strat-
egy based on particle swarm optimization (PSO), a
metaheuristic optimization strategy that simulates the
social behavior of a swarm of bird. This method
showed a high effectivity and has gained strength as
a sampling technique in recent years (Pengyi et al.,
2009). Numerous criteria have been proposed to de-
fine sample selection based on Wrapper metrics, that
is, based on several statistical measurements from
the performance of the classifier (Cortes and Mohri,
2004; Garc
´
ıa and Herrera, 2008). Although these
metrics provide good criteria to obtain an appropri-
ate representative subset of the data, they are compu-
tationally expensive. Therefore, this paper adresses
the class imbalance problem in protein subcellular lo-
calization, employing several filter type metrics in or-
der to reduce the computational cost while preserv-
ing similar or superior performances compared with
Wrapper metrics.
2 METHODOLOGICAL ASPECTS
2.1 Particle Swarm Optimization
The PSO algorithm is a population based optimization
tool where the system is initialized with a set of ran-
dom solutions, seeking for an optimal subset of the
population satisfying some performance index over
generations. For each potential solution x
i
called a
particle, PSO assigns a randomized velocity v
i
so that
particles are then ”flown” through the problem space.
At each time step, the particles moves depending of
the fitness function value q
i
, that represents a quality
measure calculated by using x
i
as input. Each particle
keeps track of its own best position, which is associ-
ated with the best fitness it has achieved at that time in
a vector p
i
. Furthermore, the best obtained positions
among all the particles in the population is included
in the vector p
g
. A new velocity for particle (i) is up-
dated at each time step t by equation (1).
v
i
(t +1) = wv
i
(t) + c
1
φ
1
(p
i
(t) − x
i
(t)) (1)
+c
2
φ
2
(p
g
(t) − x
i
(t))
where c
1
and c
2
are positive constants, φ
1
and φ
2
are
uniformly distributed random numbers and w is the
inertia weight. The term v
i
is limited to the range
±V
max
. If the velocity violates this limit, it is set at its
proper limit. Changing velocity in this way enables
the particle i to search around its individual (p
i
), and
global (p
g
) best position. Based on the updated ve-
locities, each particle changes its position according
to equation (2).
x
i
(t +1) = x
i
(t) + v
i
(t +1) (2)
2.2 Filter and Wrapper Fitness
Functions
Wrapper methods use learning algorithms directly to
inform the search. They calculate the estimated ac-
curacy of the classifier for each sample subset and
its accuracy is estimated using hold out validation.
Their most noticeable advantage is their capability to
interact with the classification task, nonetheless they
present a big computational cost (Luengo et al., 2005;
Webb, 2002). On the other hand, filter methods use a
criterion function that is independent from the classi-
fication scheme, allowing for a better computational
complexity compared with wrapper approach. In the
present work, wrapper approach uses the area under
ROC curve (AUC) estimation computed after hold out
validation, while filter approach uses several separa-
bility criteria based on scatter matrices.
2.2.1 AUC Estimation from a Non-parametric
Statistical Test
The AUC is a one-dimensional metric derived from
the ROC curve for quantifying the classifier capa-
bility for ranking. The normalized Wilcoxon-Mann-
Whitney statistic gives the maximum likelihood esti-
mate of the true AUC given positive and negative ex-
amples according to equation (3) (Cortes and Mohri,
2004).
AUC
est
( f ) =
∑
n
+
i=1
∑
n
−
j=1
1
f (x
+
i
)> f (x
−
i
)
n
+
n
−
(3)
Where n+ and n− are the number of positive and neg-
ative samples in the dataset and 1
f
(x
+
i
) and 1
f
(x
−
i
)
are the correct sample classification for each positive
WRAPPER AND FILTER METRICS FOR PSO-BASED CLASS BALANCE APPLIED TO PROTEIN SUBCELLULAR
LOCALIZATION
215

and negative classes respectively. Each pair that satis-
fies f (x
+
i
) > f (x
−
i
) contributes with
1
n
+
n
−
to the over-
all AUC performance. Maximizing the AUC is there-
fore equivalent to maximizing the number of pairs sat-
isfying f (x
+
i
) > f (x
−
i
).
2.2.2 Separability Criterion based on Scatter
Matrices
Metrics based on separability estimate the overlap
between the distributions from which the data are
drawn, and favour those sample sets for which this
overlap is minimal (i.e., maximizing the separability).
A measure of the separation between two data sets, ω
1
and ω
2
can be defined as:
J
as
=
1
n
1
n
2
n
1
∑
i=1
n
2
∑
j=1
d(x
i
,y
j
) (4)
where x
i
∈ ω
1
, y
j
∈ ω
2
and d(x,y) is a distance mea-
sure between samples x and y. The average distance
between classes measured in probablistic distances is
represented in the following equation:
J
as
=
1
2
C
∑
i=1
p(ω
i
)
C
∑
j=1
p(ω
i
)J
as
(ω
i
,ω
j
) (5)
where p(ω
i
) is the prior probability of class ω
i
(estimated as p
i
=n
i
/n). This separability criterion
is independent of the final classifier employed and
can be computed from the between−class (S
b
) and
within−class (S
w
) scatter matrices respectively de-
fined in equations 8 and 6.
S
w
=
C
∑
i=1
n
i
n
b
Σ
i
(6)
S
b
=
C
∑
i=1
n
i
n
(m
i
− m)(m
i
− m)
T
(7)
Being
b
Σ
i
the covariance matrix of the i − th class, m
i
the sample mean of the i − th class and m the sample
mean of the whole dataset.
This way, J can be expressed as:
i)
J
1
= Tr
{
S
w
+ S
b
}
= Tr
{
Σ
}
(8)
The criterion J1 is simply the total variance, which
does not depend on class information. It also reduces
the scatter grade within the classes. Several other cri-
teria have been proposed to achieve this goal as fol-
lows:
ii) The population measure
J
2
= Tr
S
−1
w
S
b
(9)
iii) The ratio of the total within-class scatter
J
3
=
Tr
{
S
b
}
Tr
{
S
w
}
(10)
iv) Difference between inter/intra class scatter
J
4
= Tr
{
S
b
− S
w
}
(11)
3 EXPERIMENTAL SETUP
3.1 Database
The database is constituted by 1016 proteins be-
longing to Embryophyta taxonomy of the Uniprot
database (Jain et al., 2009) with at least one annota-
tion in the Gene Ontology Annotation project (Ash-
burner et al., 2000). Sequences predicted by compu-
tational tools and with no real experimental evidence
were discarded. The dataset is composed of eight
different classes correspondig to common subcelullar
locations. The dataset does not contain protein se-
quences with a sequence identity superior to 40% in
order to avoid bias and overtraining in the training
dataset.
Proteins were characterized according to the
schema used in (Jaramillo-Garz
´
on et al., 2010;
Garc
´
ıa-L
´
opez et al., 2011). It is composed of six
physic-chemical characteristics, 20 amino-acid fre-
quencies, 400 dimer frequencies and 12 secondary-
structure frequencies from predictions made with
Predator 2.1 software. The total set contains 438 at-
tributes.
3.2 Feature Selection
In order to obtain representative characteristics, the
feature selection was performed as a pre-processing
stage from the relevance and redundancy analysis.
Linear correlation measures were used as the selec-
tion criteria. The relevant characteristics were quan-
tified by calculating the correlation with the actual
labels for all features. The redundant features were
identified through the analysis of the feature correla-
tion matrix of dimension nxn. To reduce computa-
tional cost, a fast filter-selection algorithm proposed
in (Yu and Liu, 2004) was used.
3.3 Class Imbalance and Classification
Schemes
To balance data in learning models for protein loca-
tion, a subsampling algorithm based PSO was used as
BIOINFORMATICS 2012 - International Conference on Bioinformatics Models, Methods and Algorithms
216
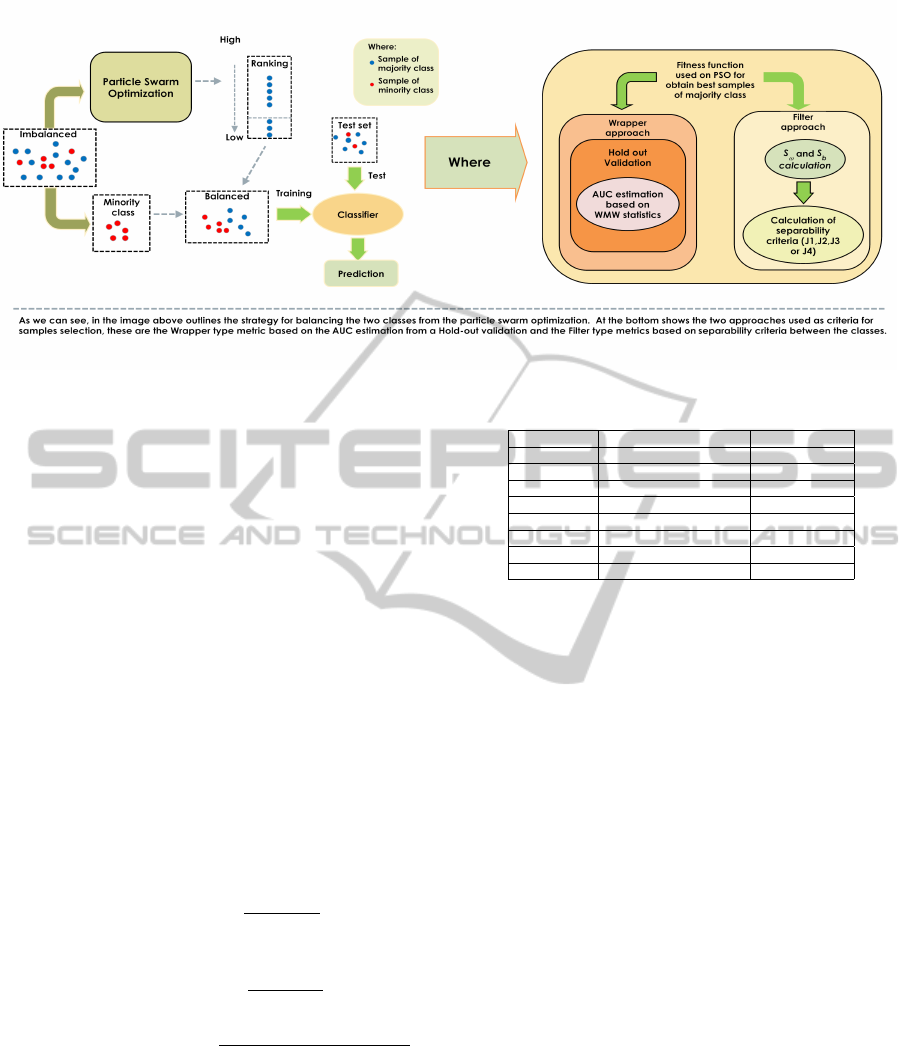
Figure 1: Methodological scheme.
the representative methodology. Given that the sub-
sampling system used on this study needs a sample
selection criterion as the fitness function, several met-
rics to determinate sample selectivities are used. In
this work, Wrapper and Filter type metrics were used
such as: AUC from the Wilcoxon-Mann-Whitney
non-parametric statistical test ((3) Wrapper type) and
metrics based on class separability from scatter ma-
trices ((8),(9), (10) ,(11) Filter type). The method-
ological block diagram is shown in Figure 1, where
the Wrapper and Filter as sample selection criteria
are illustrated. The ensemble method known as Ran-
dom Forest was chosen as the classification scheme
with 1000 iterations, it was chosen because of its low
computational cost despite being an ensemble method
and good performance in prediction task. To eval-
uate the performance of the protein location predic-
tion, a cross-validation with 10 folds was used. The
results were measured with sensitivity,specificity and
geometric mean measurements, defined as:
i) Sensitivity
Sensitivity =
T P
T P + FN
(12)
ii) Specificity
Speci f icity =
T N
T N + FP
(13)
iv) Geometric mean
Geometricmean =
p
Sensitivity ∗ Speci f icity
(14)
Table 1 shows the different classes used on this
study with its imbalance ratio and the number of sam-
ples for each class.
4 RESULTS AND DISCUSSION
Figure 2 shows the performances of the balancing al-
Table 1: Class imbalance table.
Class Minority class instances Imbalance ratio
Nucleoplasm 55 1:17
Cytoplasm 266 1:2.85
Endosome 22 1:45.18
Vacuole 274 1:2.71
Peroxisome 82 1:11.39
Endo ret 201 1:4.054
Golgi 92 1:10.43
Ribosome 115 1:7.83
gorithm using different metrics. Notably, the better
located proteins were found in the Ribosomal and Cy-
toplasmic regions. This indicate that these proteins
are highly sensitive to both the separability and the
estimation accuracy metrics used as selection crite-
ria. As shown in Figure 2 and Figure 3, the proteins
with the lowest level of prediction were located in the
Endosomal region. In addition, this region shows a
big difference in the geometric means between all the
metrics used as criterion functions. This difference
suggests that such behavior may be due to the fact that
the Endosome class contains very few proteins, thus
generating much more variability between class prob-
ability distributions. If we consider that the minority
class size represents a insignificant fraction of the to-
tal training dataset size, the sampling error will be no-
ticeable bigger. In this case, having so few samples,
its probability distribution is more spread out or dis-
persed than majority class, yielding incertain changes
in the final decision making. However, that effect
was not reflected in the trainig subset built from the
J1 metric, where this exhibits the highest geometric
mean for that region. Notably, it even outranges in
large margin the Wrapper metric results.
Figure 4 shows the results of efficiency of the
PSO-based subsampling, using each of the metrics
as a separation criterion, to see which was the com-
putational cost of the metric compared to the metric
Filter Wrapper, taking this last as a baseline to com-
pare results. As we can see , the criteria based on the
WRAPPER AND FILTER METRICS FOR PSO-BASED CLASS BALANCE APPLIED TO PROTEIN SUBCELLULAR
LOCALIZATION
217
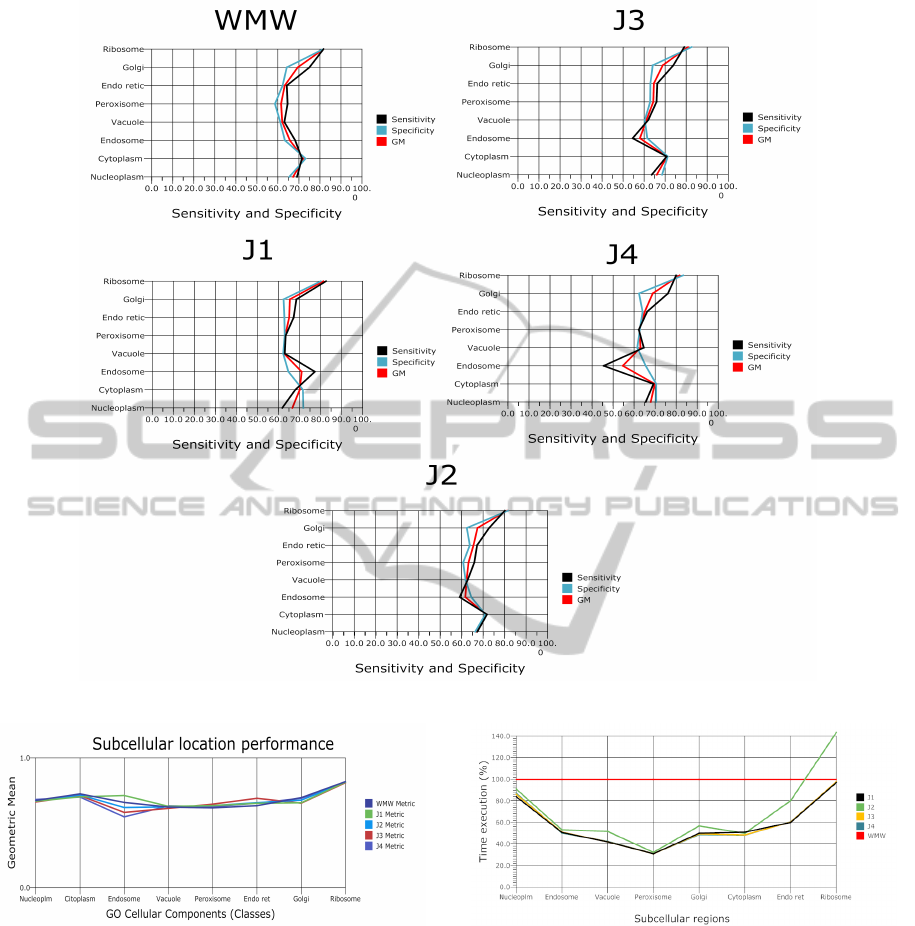
Figure 2: Performance for the evaluated metrics.
Figure 3: Geometric mean comparisons between each class.
separability metrics (Filter) executed the protein loca-
tions faster than the Wrapper criterion (WMW). The
J2 metric showed the lowest reduction time compared
to other separability criteria. Furthermore, the J2 met-
ric increased the computational time in the Ribosome
and Nucleoplasm protein location. One possible ex-
planation is the fact that both the calculation of the
inverse matrix and the matrix multiplication consume
more time to be computed. Nevertheless, the subsam-
pling with the Filter metrics shown a similar time re-
duction.
Figure 4: Efficiency.
5 CONCLUSIONS
In this paper, a comparative analysis between wrap-
per and filter type metrics as a sample selection crite-
ria for balance and further protein prediction associ-
ated to some subcellular region using methods based
on pattern recognition techniques was proposed. The
purpose was studying the influence of these metrics
over class imbalance present in subcellular location,
taking into account both performance and compute
time as evaluation judgments. In general, filter met-
BIOINFORMATICS 2012 - International Conference on Bioinformatics Models, Methods and Algorithms
218

rics offer a similar, even superior performance than
Wrapper metrics. Also, Filter type metrics allow very
drastic reduction costs. Here, a great alternative for
the evaluation of the criteria for sample selection is
suggested. This alternative reduces the computational
time required to predict protein location without de-
creasing accuracy even obtaining better performances
than with Wrapper metrics. Nevertheless, it is nec-
essary to develop a methodology that includes class
information to get a better understanding of the influ-
ence of this feature on the interaction performances
balance using filter metrics.
ACKNOWLEDGEMENTS
This work was partially funded by the Research
office (DIMA) at the Universidad Nacional de
Colombia at Manizales and the Colombian National
Research Centre (COLCIENCIAS) through grant
No.111952128388 and the ”jovenes investigadores e
innovadores - 2010 Virginia Gutierrez de Pineda” fel-
lowship.
REFERENCES
Al-Shahib, A., Breitling, R., and Gilbert, D. (2005). Feature
selection and the class imbalance problem in predict-
ing protein function from sequence. In Applied Bioin-
formatics, volume 4, page 195.
Ashburner, M., Ball, C., Blake, J., Botstein, D., Butler, H.,
Cherry, J., Davis, A., Dolinski, K., Dwight, S., and
Eppig, J. (2000). Gene ontology: tool for the uni-
fication of biology. In Nature genetics, volume 25,
page 25.
Chawla, N., Hall, L. O., Bowyer, K. W., and Kegelmeyer,
W. P. (2002). Smote: Synthetic minority oversam-
pling technique. In Journal of Artificial Intelligence
Research., volume 16, page 321.
Chawla, N., Japkowicz, N., and Kotcz, A. (2004). Editorial:
special issue on learning from imbalanced data sets. In
ACM SIGKDD Explorations Newsletter, volume 6.
Chou, K. and Shen, H. (2010). Plant-mploc: a top-down
strategy to augment the power for predicting plant pro-
tein subcellular localization. In PLoS One, volume 5.
Cortes, C. and Mohri, M. (2004). Auc optimization vs error
rate minimization. In In Advances in neural informa-
tion processing systems 16: proceedings of the 2003
conference, volume 16, page 313.
Ehrlich, J., Hansen, M., and Nelson, W. (2002). Spatiotem-
poral regulation of rac1 localization and lamellipodia
dynamics during epithelial cell-cell adhesion. In De-
velopmental Cell, volume 3.
Garc
´
ıa-L
´
opez, S., Jaramillo-Garz
´
on, J. A., and Castellanos-
Dom
´
ınguez, C. G. (2011). Estudio de m
´
etodos de
balance de clases en la predicci
´
on de ubicaciones
subcelulares de prote
´
ınas a trav
´
es de m
´
etodos de
reconocimiento de patrones. In XVI Simposio de
tratamiento de se
˜
nales, im
´
agenes y visi
´
on artificial,
STSIVA.
Garc
´
ıa, S. and Herrera, F. (2008). Evolutionary under-
sampling for classification with imbalanced data
sets:proposals and taxonomy. In Evolutionary Com-
putation.
Glory, E. and Murphy, R. (2007). Automated subcellu-
lar location determination and high-throughput mi-
croscopy. In Developmental Cell, volume 12.
He, H. and Garcia, E. (2008). Learning from imbalanced
data. In IEEE Transactions on Knowledge and Data
Engineering, page 1263.
Jain, E., Bairoch, A., Duvaud, S., Phan, I., Redaschi, N.,
Suzek, B., Martin, M., McGarvey, P., and Gasteiger,
E. (2009). Infrastructure for the life sciences: design
and implementation of the uniprot website. In BMC
bioinformatics, volume 10.
Jaramillo-Garz
´
on, J. A., Perera-Lluna, A., and Castellanos-
Dom
´
ınguez, C. G. (2010). Predictability of pro-
tein subcellular locations by pattern recognition tech-
niques. In Proceedings of the 32nd Annual Inter-
national Conference of the IEEE EMBS 2010, pages
5512–5515.
Luengo, I., Navas, E., Hern
´
andez, I., and S
´
anchez, J.
(2005). Reconocimiento automtico de emociones uti-
lizando parmetros prosdicos. In Procesamiento del
lenguaje natural, volume 35, page 1320.
Meyer, I. (2007). A practical guide to the art of rna gene
prediction. brie fings in bioinformatics. In Briefings
in bioinformatics, volume 8.
Pengyi, Y., Liang, X., Bing, Z., Zili, Z., and Albert, Z.
(2009). A particle swarm based hybrid system for im-
balanced medical data sampling. In BMC Genomics,
volume 10, page 396.
Sonnenburg, S., Schweikert, G., Philips, P., Behr, J., and
Ratsch, G. (2007). Accurate splice site prediction us-
ing support vector machines. In BMC bioinformatics,
volume 8.
Webb, A. (2002). Statistical pattern recognition. In John
Wiley and Sons Inc.
Yu, L. and Liu, H. (2004). Efficient feature selection via
analysis of relevance and redundancy. In The Journal
of Machine Learning Research, volume 5, page 1205.
WRAPPER AND FILTER METRICS FOR PSO-BASED CLASS BALANCE APPLIED TO PROTEIN SUBCELLULAR
LOCALIZATION
219
