
NEURAL ADAPTATION IN LOCAL REFLEX CONTROL OF LIMB
MOVEMENTS
Oliver P. Dewhirst
1
, Natalia Angarita-Jaimes
1
, David M. Simpson
1
, Robert Allen
1
,
Carlos D. Maciel
2
and Philip L. Newland
3
1
Institute of Sound and Vibration Research, University of Southampton, SO17 1BJ, Southampton, U.K.
2
Dep. de Eng. El´etrica - Escola de Eng. de S˜ao Carlos, Universidade de S˜ao Paulo
Av. Trabalhador S˜ao-Carlense, 400, Centro, CEP 13566-590, S˜ao Carlos-SP, Brazil
3
Centre for Biological Sciences, Building 85, University of Southampton, Highfield Campus, Southampton, SO17 1BJ, U.K.
Keywords:
Neural Adaptation, Local Reflex Limb Control, Locust, Motor Neuron.
Abstract:
Neural adaptation, a change in the response of a neuron to repetitive stimulation, is a widespread property of
neurons in many networks, including those controlling local reflex limb movements. The majority of previous
studies have investigated the steady state properties of neurons rather than considering those of their adapting
(transient) response. Bandlimited Gaussian White Noise, sinusoidal and walking stimulation signals have
therefore, for the first time, been used to investigate neural adaptation in flexor and extensor motor neurons in
the locusts local hind limb control system. Our results show that the adaptation rate of the response of two
extensor and one flexor motor neuron are the same. We also show that the adaptation rate of the Fast Extensor
Tibia motor neuron is affected by the properties of the stimulation signal.
1 INTRODUCTION
The adaptation of the response of individual or
networks of neurons to constant stimulation is a
widespread property of vertebrate and invertebrate
nervous systems (Prescott and Sejnowski, 2008). It
can be caused by a number of processes such as in-
trinsic cell mechanisms or extrinsic factors such as the
mechanical properties of sensory receptors (French,
1986) and has many functions including gain control
(Brenner et al., 2000).
Invertebrates provide the opportunity to gain
physiological insight into a system which is simpler
and more accessible than many vertebrate counter-
parts (Bassler, 1993). The current study concerns the
resistance reflexes in the network of neurons which
help to maintain postural stability in the hind leg of
the locust. The sensory, inter and motor neurons in
this local network are known to adapt their output
amplitude or spike firing rate to repetitive stimula-
tion (Field and Burrows, 1982; DiCaprio et al., 2002;
Gamble and DiCaprio, 2003). An example of adapta-
tion can be seen in the reflex response of the locusts
Fast Extensor Tibia (FETi) motor neuron to GWN
stimulation of its stretch receptor, the Femoro-tibial
Chordotonal Organ (FeCO) (Figure 1). The FeCO
monitors the position of the tibia about the femur in
the hind leg of a locust (Burrows, 1996).
Many previous studies (Newland and Kondoh,
1997; Field and Burrows, 1982; Gamble and Di-
Caprio, 2003; DiCaprio et al., 2002) focus on the
steady state (SS)(Figure 1C) response of reflex limb
control systems. These studies have used either si-
nusoidal type stimulation or Gaussian White Noise
(GWN) with system identification modelling meth-
ods to characterise neuronal responses. As the adapt-
ing or transient (TR) response may be more important
for reflex control we investigate the TR responses of
the locusts motor neurons to GWN and functionally
more relevant natural stimulation. The TR and SS re-
sponses are shown in Figure 1C between 4-8 s and
15-40 s respectively. Our aim is to determine if adap-
tation rate differs between motor neurons and if it is
affected by the properties of the stimulation signal.
The motivation for this study is to gain deeper un-
derstanding of insect neurophysiology but this work
may be of practical relevance for optimising the treat-
ment of patients with neuromuscular dysfunction. It
may also allow the features of such biological sys-
tems to be exploited to improve the design of engi-
neering control systems used in robotic applications
(bio-inspired design)(Bar-Cohen, 2006).
398
P. Dewhirst O., Angarita-Jaimes N., M. Simpson D., Allen R., D. Maciel C. and L. Newland P..
NEURAL ADAPTATION IN LOCAL REFLEX CONTROL OF LIMB MOVEMENTS.
DOI: 10.5220/0003783203980401
In Proceedings of the International Conference on Bio-inspired Systems and Signal Processing (BIOSIGNALS-2012), pages 398-401
ISBN: 978-989-8425-89-8
Copyright
c
2012 SCITEPRESS (Science and Technology Publications, Lda.)
2 METHODS
Preparation of the adult male and female locusts,
Schistocerca gregaria (Forsk˚al) follows that used pre-
viously (Newland and Kondoh, 1997). To summarise,
locusts were mounted ventral side uppermost in mod-
elling clay, a hind leg was rotated through 90
◦
and
fixed anterior face uppermost. The angle between the
femur and the abdomen, and the tibia and the femur,
was set at 60
◦
. The apodeme of the FeCO (Figure
1A) was exposed and clamped by forceps. The for-
ceps were mounted on a shaker (Ling Altec 101, LDS
Test and Measurement) and were moved by differ-
ent stimulus signals. Two bandlimited GWN signals
(27Hz and 50Hz cut off frequencies), sinusoidal (2,5
and 10Hz) and two “walking” signals were used in the
current study. The 27Hz GWN signal was generated
using a random binary generator (CG-742, NF Circuit
Design Block) and bandlimited using a low pass fil-
ter (SR-4BL, NF Circuit Design Block). The 50Hz
GWN signal and the sinusoidal and walking signals
were generated in MATLAB. The “walking” signals
were estimated from filmed recordings of the locusts
obtained from a high speed camera (Redlake Imag-
ing, Tring, UK) during walking. Apodeme position
was converted to femoro-tibial angle using previous
results (Field and Burrows, 1982). The GWN input
was scaled so that ∼99.7% of its values fell between
5 and 115
◦
. Sinusoidal stimulus signals had ampli-
tude values corresponding to a joint range between 16
and 102
◦
and walking signals between 30 and 90
◦
.
A small window was cut in the ventral thorax
to gain access to the meso- and meta- thoracic gan-
glia. The ganglia were supported by a wax coated sil-
ver platform which also served as the reference elec-
trode. Glass micro-electrodes, filled with potassium
acetate, were driven into the soma of the motor neu-
rons (Figure 1A). Intracellular recordings were made
from the posterior intermediate flexor tibiae (PIFlTi)
and the slow and fast extensor tibia (SETi and FETi)
motor neurons with the use of an Axoclamp 2A am-
plifier (Axon Instruments). Signals were digitised
(f
s
=10KHz) using the USB 2527 data acquisition
board (Measurement Computing, Norton, MA, USA)
and stored on a computer hard-drive for further anal-
ysis. An example of the response of the FETi mo-
tor neuron to 50Hz GWN stimulation of the FeCO
is shown in Figure 1C. As only synaptic inputs were
recorded in the motor neurons we quantify adapta-
tion by calculating the power in 1 s long non overlap-
ping blocks of data. The responses recorded from the
PIFlTi, SETi and FETi motor neurons to 27Hz ban-
dlimited GWN stimulation were used to investigate
whether adaptation rate varied between motor neu-
0
60
120
Angle(degs.)
-1
0
1
Amp.(mV)
0 10 20 30 40
Tibia
Femur
FeCO
(stretchsensor)
Apodeme
Electrode
Forceps
Systeminput(position)-Voltage
inputtoshakerdrivesforceps
whichmoveapodeme
Non-spiking
interneurons
Sensory
neurons
Metathoracicganglia
Motor
neurons
Brain
Abdominal
ganglia
Thoracic
ganglia
Zoomintohindleg
reflexcontrolsystem
Systemoutput(electrical)-Intracellularpost
synapticpotentialsrecordedinthesomaof
themotorneurons
Extensor
muscle
Pivot
point
Loop
structure
Time(s)
A)
B)
C)
TR SS
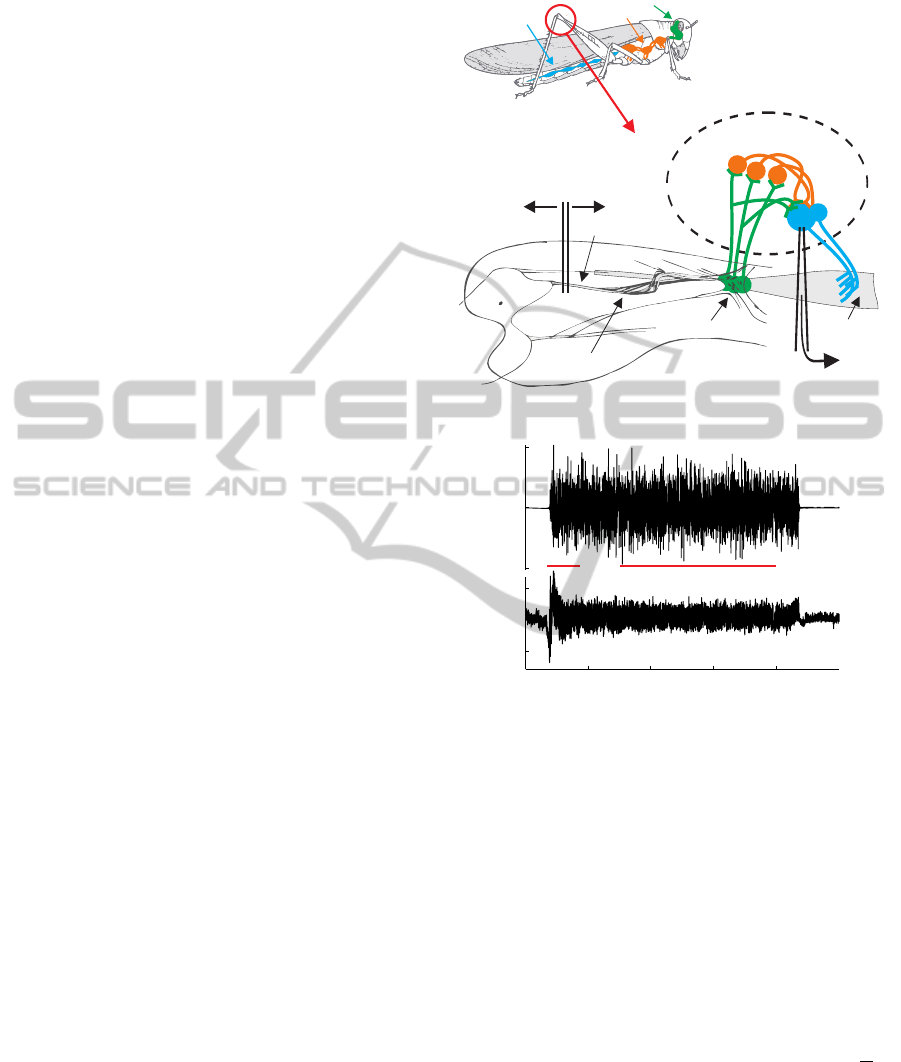
Figure 1: The locusts nervous system (A) and an example
intracellular recording from the FETimotor neuron showing
how it adapts its response to 50Hz bandlimited GWN stim-
ulation of the FeCO (B,C). The GWN input signal applied
to the FeCO is shown in (B). An example of the intracellular
post synaptic response of a FETi motor neuron to this stim-
ulus is shown in (C). Its transient (TR), adapting response
can be seen in (C) between ∼ 4 and 8 s. Its steady state
response (SS) can be seen between ∼ 15 and 40 s. Signals
were preprocessed to remove slow time varying drifts using
a high pass filter with a cut off frequency of 0.5Hz.
rons. The effect on adaptation rate was investigated
when the FETi was stimulated with 50Hz bandlim-
ited GWN, sinusoidal and walking stimulation sig-
nals. The change in neural power over time was mod-
elled using the exponential equation y(t) = A+Be
(
−t
τ
)
where t represents time and y(t) represents the neu-
rons neural power normalised by its base line power
(BLP). BLP was calculated from a 1 s window taken
from each recording before stimulation was applied.
The final SS power is represented by A, and A + B is
the peak power amplitude. Adaptation rate was quan-
tified by the time constant τ which represents the time
NEURAL ADAPTATION IN LOCAL REFLEX CONTROL OF LIMB MOVEMENTS
399

0 10 20
0
0.5
1
1.5
Time (s)
Normalised power
A)
FETi (µ)
FETi (± 2 )σ
PIFlTi (µ)
PIFlTi (± 2 )σ
SETi (µ)
SETi (± 2 )σ
0 10 20
Time (s)
B)
GWN (µ)
GWN (± 2 )σ
S2 (µ)
S2 (± 2 )σ
S5 (µ)
S5 (± 2 )σ
S10 (µ)
S10 (± 2 )σ
0 10 20
Time (s)
C)
GWN (µ)
GWN (± 2 )σ
W1 (µ)
W1 (± 2 )σ
W2 (µ)
W2 (± 2 )σ
Figure 2: Adaptation of the different motor neurons to the same 27Hz bandlimited GWN stimulation signal (A) and adaptation
of the response of the FETi motor neuron to different stimulus signals (B,C). (A) shows the mean and ± 2 std of power in the
response of PIFlTi (n=6), SETi (n=6) and FETi (n=14) motor neurons. (B,C) show how the power (mean and ± 2 std) in the
response recorded from the FETi motor neuron varies when different stimulation signal types are applied. GWN, S2, S5 and
S10 represent the 50Hz bandlimited GWN, 2Hz, 5Hz and 10Hz sinusoidal stimulation signals respectively. W1 and W2 are
the two walking stimulation signals. Five recordings for each stimulus signal type were made from FETi in different animals.
taken for the BLP normalised neural power to fall by
63.2% of B. The Nelder Mead (simplex) (Nelder and
Mead, 1965) iterative search method was used to es-
timate the time constant τ.
3 RESULTS
To investigate whether adaptation rate varies in differ-
ent motor neurons we calculated and plotted the mean
power and ± 2 standard deviations in the response of
one flexor motor neuron (PIFlTi)(n=6) and two dis-
tinct physiological types of extensor motor neuron,
fast (FETi), and slow (SETi)(n=14and 6) (Figure 2A).
Each recording was made from a different animal. To
aid comparison, power values were normalised by the
value calculated from the first window. TR and SS
sections of responses were defined using mean power
levels (Figure 2A) and visual analysis of the signals.
Thus the TR response was defined as the response
which occurred within the first 3 s after stimulus on-
set (Figure 2A). The SS response was defined as the
response which occurred after 10 s of stimulus on-
set (Figure 2A). The power of all three motor neuron
types falls to approximately 40% of their initial val-
ues within the TR section (Figure 2A). The median
difference of the mean of the power in the TR and SS
sections is significantly different from zero (Wilcoxon
signed-rank test, p < 0.05) for each motor neuron
type. Signal power remains relatively constant in the
SS section (Figure 2A, B and C). The rate of adap-
tation of the response of the PIFlTi, SETi and FETi
motor neurons to 27Hz bandlimited GWN appears to
be similar (Figure 2A, B). There was no significant
difference between the time constant values for the
different motor neurons (p=0.48, Kruskal Wallice).
To investigate if stimulus signal properties affect
adaptation rate we calculated the mean power and ±
2 standard deviationsof the responses of the FETi mo-
tor neuron to bandlimited 50Hz GWN, sinusoidal (2,
5 and 10Hz) and two walking input signals (Figure 2B
and C). For each stimulus type results were obtained
from recordings made in 5 different animals. Visual
analysis of the results suggests that adaptation rate is
similar for the differentstimulation signals (Figure 2B
and C). However, we found a significant difference
between the time constant values (p=0.01, Kruskal
Wallice); a post hoc (Dunn-Sidak) test revealed a dif-
ference between the walk 2 and the 5Hz sinusoidal
stimulation signal.
The effect that stimulation signal type had on
adaptation was probed further by investigating how
adaptation rate varied with transient response power
(TRP). Both TRP and the time constant of the expo-
nential function fitted to the power values were nor-
malised by the base line power. In general the scat-
ter plots of time constant against TRP normalised by
BLP (Figure 3) show no correlation between vari-
ables (Spearman rank correlation). The result when
10Hz sinusoidal stimulation is applied suggests that
the variables are correlated but not at the 95% signifi-
cance level (r=0.9, p=0.08)(Figure 3 S10).
4 DISCUSSION
The aim was to investigate whether adaptation rate
differs between motor neuron types and if it is af-
fected by the properties of the stimulation signal.
Adaptation rate was quantified by the time constant of
BIOSIGNALS 2012 - International Conference on Bio-inspired Systems and Signal Processing
400

0
5
10
τ (normalisedtimeconstant)
GWN
(r=0.30,p=0.68)
S2
(r=0.00,p=1.00)
S5
(r=0.50,p=0.45)
0 50
0
5
10
S10
(r=0.90,p=0.08)
0 50
TRP/BLP
W1
(r=−0.30,p=0.68)
0 50
W2
(r=0.60,p=0.35)
Figure 3: Relationship between the rate of adaptation, mea-
sured by the time constant of an exponential function fit-
ted to the power values, and the transient response power
(TRP). Both values are normalised by the base line power
(BLP) which is calculated from a 1s window taken from the
recording before stimulation is applied. GWN, S2, S5 and
S10 represent the 50Hz bandlimited GWN, 2Hz, 5Hz and
10Hz sinusoidal stimulation signals respectively. W1 and
W2 are the walking signals. Five recordings for each stim-
ulus signal type were made from FETi in different animals.
Correlation is tested using Spearman rank correlation. We
found no correlation between TRP and the time constant.
an exponential function fitted to the response power of
the motor neurons. We haveshown that the adaptation
rate of the response of two extensor (SETi and FETi)
and one flexor (PlFITi) motor neuron to 27Hz ban-
dlimited GWN stimulation of the FeCO is the same.
Our results are contrary to those found in the study by
Field and Burrows (1982). They found that the PlFITi
motor neuron showed little difference in its response
after 10 s of stimulation, whereas we found a drop in
power of approximately 40% after 3 s. Field and Bur-
rows (1982) also found that the fast and slow flexor
motor neurons exhibited different rates of adaptation
whilst we found that the fast and slow extensor mo-
tor neurons exhibited the same rate of adaptation. It
should be noted that they stimulated the FeCO using
repetitive triangular movements with a frequency of
5Hz and femoral tibial joint angles between 40
◦
and
80
◦
. This is very different from the 27Hz bandlimited
GWN used in the current study and their excursion of
± 20
◦
does not cover the full range of movement that
occurs during walking or kicking. Our results could
also occur because the extensor and flexor neurons
may share common inputs, a property well known to
occur in vertebrate studies (Luca and Erim, 2002).
We have also shown that the adaptation rate of the
FETi motor neuron can be affected by the properties
of the stimulation signal, as has been found in other
work (Fraser et al., 2006). We have used correlation
analysis to show that FETi response power decreases
to its steady state level within the same amount of
time regardless of its transient response power (both
BLP normalised). Further experiments and analysis
are required to understand how this adaptation affects
the function of the reflex response.
ACKNOWLEDGEMENTS
This work was supported by the BBSRC, EPSRC and
the Gerald Kerkut Charitable Trust.
REFERENCES
Bar-Cohen, Y. (2006). Biomimetics-using nature to inspire
human innovation. Bioinspired Biomimetics, 1:1–12.
Bassler, U. (1993). The femur-tibia control system of stick
insects – a model system for the study of the neu-
ral basis of joint control. Brain Research Reviews,
18(2):207 – 226.
Brenner, N., Bialek, W., and de Ruyter van Steveninck,
S. (2000). Adaptive rescaling maximizes information
transmission. Neuron, 26(3):695–702.
Burrows, M. (1996). The Neurobiology of an Insect Brain.
Oxford University Press, first edition.
DiCaprio, R., Wolf, H., and Buschges, A. (2002). Activity-
dependent sensitivity of proprioceptive sensory neu-
rons in the stick insect femoral chordotonal organ.
Journal of Neurophysiology, 88(5):2387–2398.
Field, L. and Burrows, M. (1982). Reflex effects of
the femoral chordotonal organ upon leg motor neu-
rones of the locust. Journal of Experimental Biology,
101(1):265–285.
Fraser, G., Hartings, J., and Simons, D. (2006). Adapta-
tion of trigeminal ganglion cells to periodic whisker
deflections. Somatosensory and Motor Research,
23(3):111–118.
French, A. (1986). The role of calcium in the rapid adap-
tation of an insect mechanoreceptor. The Journal of
Neuroscience, 6(8):2322 –2326.
Gamble, E. and DiCaprio, R. (2003). Nonspiking and spik-
ing proprioceptors in the crab: White noise analysis
of spiking cb-chordotonal organ afferents. Journal of
Neurophysiology, 89(4):1815–1825.
Luca, C. D. and Erim, Z. (2002). Common drive in motor
units of a synergistic muscle pair. Journal of Neuro-
physiology, 87(4):2200–2204.
Nelder, J. A. and Mead, R. (1965). A simplex method
for function minimization. Computer Journal, 7:308–
313.
Newland, P. and Kondoh, Y. (1997). Dynamics of neurons
controlling movements of a locust hind leg iii: Exten-
sor tibiae motor neurons. The Journal of Neurophysi-
ology, 77(5):3297–3310.
Prescott, S. and Sejnowski, T. (2008). Spike-rate coding and
spike-time coding are affected oppositely by different
adaptation mechanisms. The Journal of Neuroscience,
28(50):13649–13661.
NEURAL ADAPTATION IN LOCAL REFLEX CONTROL OF LIMB MOVEMENTS
401
