
EMPIRICAL SURVEY OF HSPA NETWORKS TO DELIVER
MEDICAL APPLICATIONS
Christopher I. Iyawe
1,2
and John Doucette
1,2
1
Department of Mechanical Engineering, University of Alberta, Edmonton, T6G 2G8, Alberta, Canada
2
TRLabs, Edmonton, Alberta, Canada
Keywords: ICT, HSPA, Homecare, eHealth, Healthcare ICT.
Abstract: Population explosion coupled with a decline in medical personnel are forcing governments in the developed
and developing nations to look at new ways to deliver healthcare to their citizens. The cost of providing
healthcare put so much pressure on the delivery system that many find it difficult to access the system. The
most affected are often the elderly and/or those who are highly immobile, particularly those who reside in
remote communities. This group is often laden with chronic illnesses and diseases requiring home care, and
ambulatory services to access the healthcare system. Such services are generally quite expensive to provide.
Developing an eHealth network to drive applications to deliver healthcare services to homes is very costly.
Such dedicated networks will also be difficult to manage. We can observe the manner in which other
industries use information and communications technology (ICT) through the public network to influence
ways services are delivered to the public, and ask why the same (i.e., use of ICT applications through the
public network) cannot be done for the healthcare system. In this paper, we assess the capability of local
HSPA public networks to deliver healthcare applications to home care clients.
1 INTRODUCTION
It has become clear that wireless communications
are almost essential to maintain an active lifestyle in
today’s developed countries. Economic, social and
cultural activities around the world are now being
driven by communications technology. The late
comer to this vast access of communication
networks is the healthcare industry (Fischer, 2010).
Most modern healthcare communications still use
19
th
century technology through the public switched
telephone network (PSTN). Although most of the
patient-related information generated in the
healthcare industry is still on paper, advances have
been made in the implementation of electronic
medical records (EMR) in many modern healthcare
clinics and hospitals (Ludwick and Doucette, 2009).
However, there is still much to be desired in the use
of information and communication technology (ICT)
to deliver healthcare services.
Many other industries have successfully used
ICT to deliver services to the home for decades. For
example, the banking industry uses ICT to deliver
account management, bill payment, loans, and other
services (Hardy, 2010). It is only natural to expect
that ICT can do the same for the healthcare industry.
Applying ICT to healthcare is a complex issue,
because healthcare delivery may involve a variety of
applications, each of which has different bandwidth
and latency requirements. For the purpose of this
study we will consider applications that are
applicable to homes, such as vital signs monitoring,
educational health services, etc.
Many healthcare applications require real-time
services, and people’s lives may depend on the
response time of the healthcare provider, which
might in turn depend on the network’s latency and
other technical characteristics for successful delivery
of such applications (Cisco, 2007). This could have
grave repercussions if the network and the
applications that run on it are not designed properly;
bandwidth and latency requirements for such
networks and applications are of utmost importance.
They have to be carefully designed and measured in
order for the healthcare industry to appreciate the
capability and the expediency of such applications.
Where these real-time services are required,
applications with even small latency can have a
disproportionately adverse effect on the user’s
overall experience.
390
I. Iyawe C. and Doucette J..
EMPIRICAL SURVEY OF HSPA NETWORKS TO DELIVER MEDICAL APPLICATIONS.
DOI: 10.5220/0003784203900396
In Proceedings of the International Conference on Health Informatics (HEALTHINF-2012), pages 390-396
ISBN: 978-989-8425-88-1
Copyright
c
2012 SCITEPRESS (Science and Technology Publications, Lda.)
1.1 Goals and Motivation
The purpose of this study is to assess the capacity of
public wireless networks, more specifically local
high speed packet access (HSPA) networks, in
relation to healthcare applications requirements as
they share channels with other types of public
traffic. This work looks at various ICT applications
with potential for use in home care, and determines
their latency and bandwidth characteristics over an
HSPA wireless access network.
We have chosen public wireless network
technology because of its wide reach in suburban
and rural areas where home care is more likely to be
a major aspect of a patient’s healthcare regimen. We
considered HSPA in particular because it is the
fastest mobile wireless network that has been widely
deployed by our regional telecommunication
companies. With fast data access, mobile
communication can provide personal or interactive
services virtually anywhere in the service area at
virtually any time.
With the introduction of HSPA in WCDMA
networks, Internet service providers (ISPs) now
have the capability of offering latency sensitive and
simultaneous voice, data and video services over
their mobile wireless networks. We have collected
empirical data over real networks, analyzed the data,
and have come up with recommendations for
applications that can be run through such networks.
This paper is organized in the following order.
The methodology used in the survey is described in
Section 2. The test setup is given in Section 3.
Survey results are presented in Section 4. Network
evaluation for medical data sets is considered in
Section 5, and the paper finishes with some
concluding remarks in Section 6.
2 METHODOLOGY
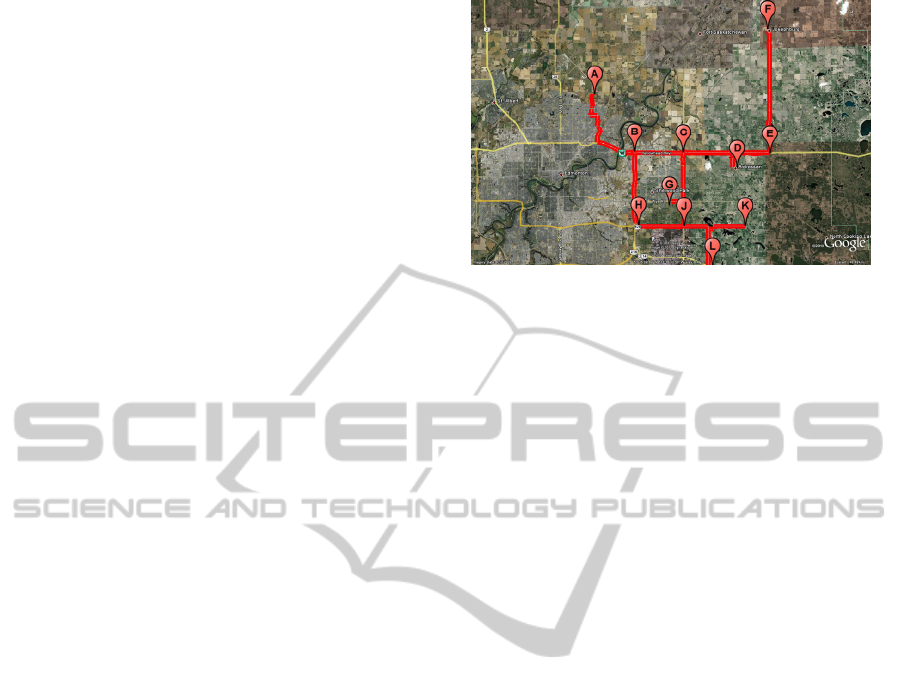
We chose Strathcona County, near Edmonton,
Alberta as our test site, as that region covers a good
mix of suburban and rural residential areas. We first
mapped out the test area as illustrated in Figure 1.
The survey area is representative of the population
density distribution in the suburban and rural areas
of Strathcona County. We drove through the
indicated route (highlighted in red) and collected
global positioning system (GPS) data, and wireless
information such as received signal strength
indication (RSSI). We also carried out bandwidth
testing at numerous points in the area to simulate
healthcare applications through the network.
Figure 1: Area of interest for Wireless measurement.
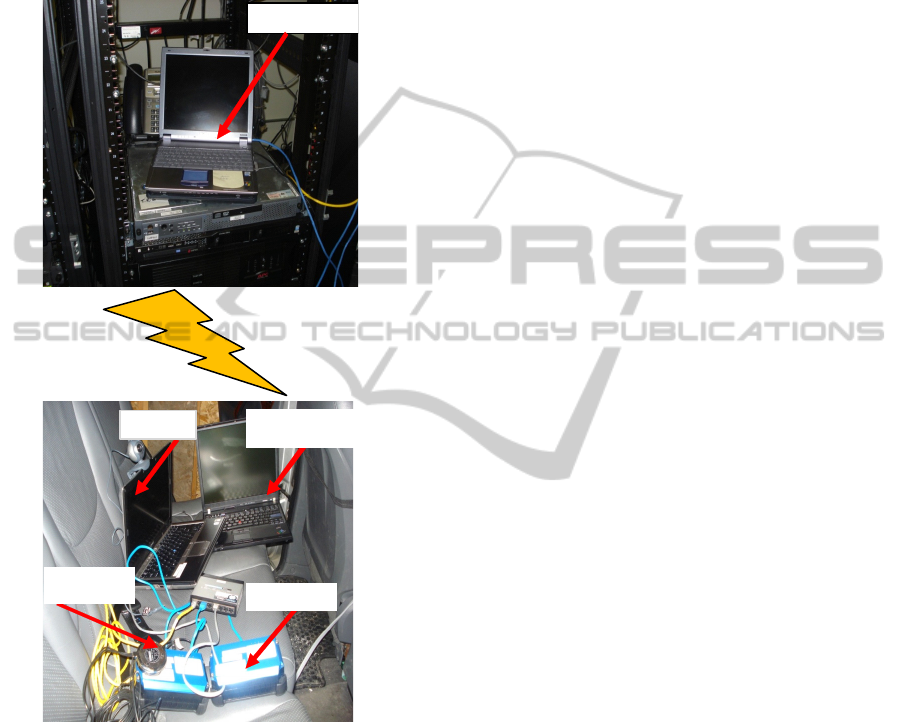
3 TEST SETUP
Figure 2 illustrates our HSPA network setup. We
connect to the radio access network (RAN) with an
access service network antenna to create the data
path between the mobile station and the core
network. Detailed network characteristics and
configurations of the core network are unknown to
us, as the local service providers do not like to
divulge this information. All data presented herein is
based on the data we were able to collect through
our own experimental apparatus.
We had the ability to measure the network
performance from two end points, in the field and in
our office in downtown Edmonton In the field, we
measured the upload speed and latency as well as the
download speed and latency through the network.
We set up a laptop computer (denoted as “Server
PC” in the figure) to act as a fixed server running
Darwin streaming server and IxChariot endpoints
(Ixia, 2010) at our Edmonton office. The Server PC
communicated with our field apparatus (the lower
half of the figure) through the HSPA network. We
deemed the Server PC to represent a doctor’s office
or hospital server and the field apparatus to represent
a patient home. The Server PC has an external IP
address to by-pass the office firewall and also to free
it from our office’s network traffic. This ensures that
our test is isolated from whatever is happening
within the office network.
The “Test PC” is the main computer in the field
apparatus (set up in the lead author’s vehicle), and
ran VLC application software and IxChariot
endpoints. VLC was used in the field to stream
video files from the Server PC. IxChariot was used
to test the upload and download speed through the
network. The Test PC was also fitted with a
Logitech QuickCam and a Polycom PVX. This
enabled us to do video conferencing with our
EMPIRICAL SURVEY OF HSPA NETWORKS TO DELIVER MEDICAL APPLICATIONS
391
office’s video conferencing system via the Server
PC. Video files of various sizes, frame rate,
resolution, and bit rates recorded in MPEG-4 format
were loaded on the Server PC. We deemed the video
files represent medical data images such as
radiographs, MRI, etc. These files were used to test
the network from Test PC in the field.
Figure 2: HSPA Network test setup.
The Test PC was also connected to a Cypress
CTM-152 cellular modem, shown in Figure 2.
Embedded in the CTM-152 is a Sierra Wireless
AirPrime MC8700 HSPA+ module that accepts an
approved data card from local ISPs. The CTM-152
is equipped with antenna (also shown in the figure)
and GPS inputs so that data could be mapped to the
corresponding GPS coordinates at the time of
collection. Low-level diagnostic information about
the network was also collected and logged in
MySQL database.
The measurement route is shown in Figure 1.
Starting at point A in northeast Edmonton, we drove
to the hamlet of Sherwood Park, which is the
suburban area bounded by rectangle B-C-H-J in
Figure 1. Then, we proceeded to point D
(Ardrossan), and ended at point F (Josephburg). At
the noted points and intersections along the route,
we became stationary and ran our battery of network
tests: IxChariot FTP-get and FTP-put, VLC video
streaming and Polycom Video Conference sessions.
These points were chosen to coincide with
community boundaries, community centres, and
places that represent the population distribution in
the area. We followed this route on two different
dates (28 May 2010 and 04 June 2010), and
simultaneously collected data for each of two main
wireless carriers in the region (we will simply refer
to them as Carrier 1 and Carrier 2). We could not
find a convenient place to stop and collect data at
point C as there was construction on the road way at
the time of our measurements.
4 RESULTS/DISCUSSION
4.1 Network Performance – Suburban
We used IxChariot, and VLC to assess the capacity
of the network of the two carriers and we measured
the performance of their networks. We configured
IxChariot to download data files from the server
using FTP-get. These measurements were done on
the networks of both carriers at pre-determined
locations. The first measurement location was at
point B in Figure 1. The RSSI recorded at this
location was -81 dBm for carrier 1. We completed
the first test by downloading a 100 kb data file in
real time. The average download speed was 0.557
Mbps. Figure 3 through Figure 5 give a graphical
view of TCP throughput, transaction rate, and
response time for our FTP-get test on Carrier 1. The
average transaction rate and response time were
0.697 per second and 1.436 seconds, respectively.
As expected, we can observe that a high throughput
tends to correspond to high transaction rates and low
response time. For example, Figure 3 shows a fall in
throughput at about 51 seconds into the test, and
there was a corresponding low transaction rate and
high response time at that time stamp in Figure 4
and Figure 5. The fall in throughput below the
application bandwidth requirement threshold may
necessitate packets drops, just as in the video
streams test. These are important facts to note about
the network when designing an eHealth application
because round trip time of an application will
depend on the network response time, which is the
Antenna
Mode
m
Server P C
Data Logger
Test PC
HEALTHINF 2012 - International Conference on Health Informatics
392
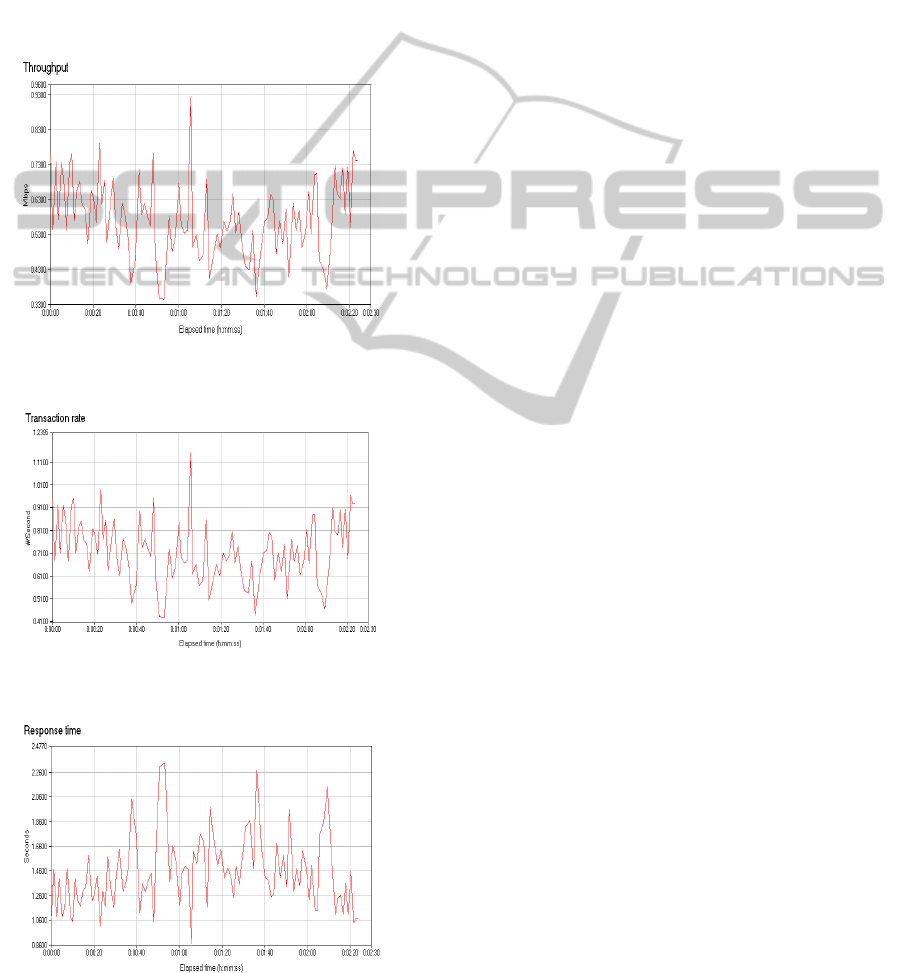
delay through the network. Also, the delay through
the network will depend on the network throughput.
The ideal for a high capacity network will be a high
throughput, high transaction rate, and low response
time. This will ensure minimal delay between a
doctor’s office and a patient’s home.
Similar values were obtained for FTP-put
throughput, transaction rate, and response time at
point B, where we uploaded a 100 kb data file from
the field to the Server PC. We deem this to represent
a patient sending personal or medical data from
home to a doctor’s office.
Figure 3: FTP-get throughput for Carrier 1 at junction of
Trans Canada 16/Hwy 216 (point B).
Figure 4: FTP-get transaction rate for Carrier 1 at junction
of Trans Canada 16/Hwy 216 (point B).
Figure 5: FTP-get response time for Carrier 1 at junction
of Trans Canada 16/Hwy 216 (point B).
We note here that although Figure 3 through
Figure 5 correspond to only a single point in our
tests, the results shown are typical of data collected
at other locations, and so for space considerations
we omit figures showing the data for those tests.
That said, we show summary data for some location
in Table 1.
The packet size for IxChariot was set at a
constant 4096 bytes, with no dynamic variation in
packet size. Real time streaming protocol (RTSP)
was used in VideoLAN (VLC) streaming of the pre-
recorded MPEG-4 video clips. These files were
created using FFmpeg on a pre-recorded video clip
varying the key parameters as detailed in Table 2.
During the test, the received video streams were
recorded and the video quality evaluated
subjectively by noting audible and visual artefacts in
the audio and video streams that are not present in
the originals.
At point H, we repeated the video streaming tests
and observed that here, we were able to successfully
stream files 1-7 on Carrier 1 without noticeable
degradation, but could only do so with files 1-4 on
Carrier 2. In fact, the video bit rate of Carrier 1 was
5000 kbps, approximately 6 times that of Carrier 2,
which was 750 kbps. We can also note that at this
location, throughput for carrier 2 was much lower
than for Carrier 1. For instance, Carrier 1 averaged
1.084 Mbps throughput for FTP-get while Carrier 2
averages 0.441 Mbps. The average transaction rate
for Carrier 1 was 1.378 per second, and the average
response time was 0.726 seconds, while the average
transaction rate for Carrier 2 was 0.551 per second,
and the average response time was 1.816 seconds.
Given Carrier 2 transaction rates this low, response
times this high and a low throughput rate, it took
almost twice as long to run this test in carrier 2 than
in carrier 1. This suggests that depending upon
choice of carrier (i.e., its network configuration,
number of active users etc.), will greatly impact the
type of eHealth application that can be deployed in
such a network. We show all video streaming
summary data in Table 3, below. In the entire
suburban area, we found out that at a minimum, we
can stream video file 3, a video recorded at 15
frames per second with a bit rate of 500 kilobits, and
screen resolution of 720 X 480. We conclude that at
least based on these findings, we can expect a home
care application including video with those
characteristics to be functional over the two HSPA
wireless networks we tested.
EMPIRICAL SURVEY OF HSPA NETWORKS TO DELIVER MEDICAL APPLICATIONS
393

Table 1: Summary of FTP-get and FTP-put data at all suburban locations.
Location Carrier
RSSI
(dBm)
FTP-get
Throughput
(Mbps)
FTP-get
Transaction
Rate (sec
-1
)
FTP-get
Response
Time (sec)
FTP-put
Throughput
(Mbps)
FTP-put
Transaction
Rate (sec
-1
)
FTP-put
Response
Time (sec)
B 1 -81 0.557 0.697 1.436 0.805 1.009 0.991
G 1 -75 0.956 1.198 0.836 0.764 0.957 1.044
H 1 -76 1.084 1.378 0.726 0.845 1.059 0.944
J 1 -91 0.890 1.114 0.897 0.777 0.973 1.028
B 2 -81 0.456 0.561 1.798 0.351 0.438 2.289
G 2 -91 0.425 0.532 1.891 0.341 0.429 2.304
H 2 -76 0.441 0.551 1.816 0.349 0.346 2.293
J 2 -91 0.417 0.522 1.915 0.348 0.435 2.297
4.2 Network Performance – Rural
As mentioned earlier, our test region includes a large
area with a higher concentration of people in the
suburban (Sherwood Park) area, and a more
moderate population density in the acreages and
rural areas, with the exception of a somewhat higher
density of people in the immediate vicinity of points
D and F in Figure 1 (the rural hamlets of Ardrossan
and Josephburg with populations just over 400 and
200, respectively). With this in mind, we chose test
points in the acreages and rural areas (points E, K,
and L) and in the two above-mentioned hamlets. For
expediency, we will discuss our findings on Carrier
1 here. We could not obtain any useful data for
carrier 2 at point E, K and L. Also, Carrier 1 has
poor signal reception at point E and L. At those
points, we could not run our battery of test. FTP-get
test executed for carrier 2 at Josephburg, but the
signal reception was so poor that FTP-put could not
execute. We summarize the above data and the other
collected data in the rural locations in Tables 4 and
5.
Table 2: Characteristics of MPEG-4 video files used.
File #
Frame Rate
(frames per
sec)
Audio
Bit Rate
(kbps)
Screen
Resolution
Video
Bit Rate
(kbps)
1 10 16 320x240 250
2 10 64 320x240 1000
3 15 64 720x480 500
4 15 64 720x480 750
5 15 64 720x480 1500
6 15 64 720x480 2000
7 15 64 720x480 5000
8 24 128 1920x1080 3000
9 24 128 1920x1080 4000
10 24 128 1920x1080 15000
5 NETWORK EVALUATION FOR
CLINICAL DATA SETS
One of the purposes of conducting this study was to
determine what sort of capability exists in local
HSPA networks (Palola et al., 2004) to
accommodate potential healthcare applications.
Table 6 shows various sizes of data files produces by
some medical applications and the average
transmission time based on our measured averages.
Medical application file sizes are well documented
in various peer-reviewed articles the file sizes used
in Table 6 were adapted from (Rafael et al., 2006).
The frequency of monitoring vital signs, the
number of patients being monitored and the number
of monitoring devices may generate large amounts
of data and traffic for the network. The extent of
monitoring and the frequency of monitoring will
depend on the medical history and medical problem
of the patient (Varshney, 2006). The results of our
measurements show that HSPA has system
resources that are sufficient to handle a shared
transport channel. Vital signs monitoring, which has
a low bandwidth requirement, may easily be
transported through this medium to a server at the
clinician or hospital system. Vital signs devices that
are real-time or near-real-time, running store and
forwarding protocols may work well with this
transport system. Specific tests may still be done to
properly size the number of users on the shared
channel. Bandwidth-hungry applications such as
radiographs can best be served by store and
forwarding systems. As shown in Table 6, it may
take some time to upload or download 100MB file
through the system.
HEALTHINF 2012 - International Conference on Health Informatics
394

Table 3: Summary video streaming results at all suburban locations.
Carrier 1 Carrier 2
Location
Best
File
Best File
Frame Rate
(fr/sec)
Best File
Screen
Resolution
Best File
Video Bit Rate
(kb/sec)
Best
File
Best File
Frame Rate
(fr/sec)
Best File
Screen
Resolution)
Best File
Video Bit Rate
(kb/sec)
B 5 15 720x480 1500 4 15 720x480 750
G 7 15 720x480 5000 - - - -
H 7 15 720x480 5000 4 15 720x480 750
J 7 15 720x480 5000 3 15 720x480 500
Table 4: Summary FTP-get and FTP-put data at all rural locations.
Location Carrier
RSSI
(dBm)
FTP-get
Throughput
(Mbps)
FTP-get
Transaction
Rate (sec
-1
)
FTP-get
Response
Time (sec)
FTP-put
Throughput
(Mbps)
FTP-put
Transaction
Rate (sec
-1
)
FTP-put
Response
Time (sec)
D 1 -90 0.899 1.127 0.888 0.820 1.027 0.973
F 1 -97 0.523 0.657 1.522 0.682 0.854 1.172
K 1 -71 0.932 1.166 0.857 0.723 0.905 1.105
L 1 -102 0.054 0.068 14.722 0.075 0.093 10.742
D 2 -91 0.163 0.204 4.902 0.098 0.123 8.160
F 2 -92 0.059 0.075 13.415 - - -
Table 5: Summary video streaming results at all rural locations.
Carrier 1 Carrier 2
Location
Best
File
Best File
Frame Rate
(fr/sec)
Best File
Screen
Resolution
Best File
Video Bit Rate
(kb/sec)
Best
File
Best File
Frame Rate
(fr/sec)
Best File
Screen
Resolution
Best File
Video Bit Rate
(kb/sec)
D 6 15 720x480 2000 None
F 3 15 720x480 500 None
K 7 15 720x480 5000 None
L none None
Table 6: Medical files upload times in select areas.
File Type File Size
Point G
(Mean TX:
0.845Mbps)
Point D
(Mean TX:
0.820Mbps)
Point F
(Mean TX
0.682Mbps)
Sonogram 2MB 18.9 sec 19.5 sec 23.5 sec
Angiogram 70MB 11.05 min 11.38 min 13.69 min
SPECT 10MB 1.58 min 1.63 min 1.96 min
MRI 30MB 4.73 min 4.88 min 5.87 min
Polycom PVX software was used to test the link
between the video conferencing system at our
downtown office and the Test PC video conference
in the field. Polycom implemented an enhanced
video (H.264) standard. We observed that at the low
bandwidth setting of 384 Kbps, the frame drop and
the video jitter were at a minimum. For example, in
Ardrossan, where RSSI was -90dBm, we recorded a
frame rate of 15 fps, a video jitter of about 7ps, an
audio jitter 14, and a packet loss of 1 for the entire 5
minutes of video calls. This was typical of most sites
on our test route.
6 CONCLUSION
We were able to characterize the RSSI in the study
area and did some channel condition testing in the
predetermined sites. The fact that HSPA is a highly
deployed technology shows the acceptance of the
technology in the wireless community, which would
easily permit a means to obtain high speed data
connection to homecare patients. With this
technology, ISPs have been able to boost their
bandwidth for better delivery of content through
their network and better user experiences with the
wireless technology. We were able to establish a
threshold for video conferencing (384Kps) given the
same channel conditions and same setting on the
Polycom PVX, that good reception and
communication is possible over the HSPA network.
Our study indicates that it is plausible to set up
patient remote monitoring using the public HSPA
wireless network; high quality medical data may be
delivered over the network with the existing network
resources. The low response times we obtained from
our measurement will work with live monitoring
EMPIRICAL SURVEY OF HSPA NETWORKS TO DELIVER MEDICAL APPLICATIONS
395

applications such as ECG, SpO
2
. With live
monitoring application, the most important service
requirement will be the response time or latency
which affects the quality of the eHealth application
over the network. The network will perform better
with a store and forward application, where medical
information is stored at the time of collection and
then later forwarded to the server at a convenient
time (e.g., when there is sufficient network
resources to do so). This provides value to the
patients and the clinicians in the sense that the
clinician can still monitor the patient and have a
sense of the patient’s wellbeing. Using the system
relieves and frees up clinical resources that would
otherwise have been tied up in the process of
gathering these medical information.
REFERENCES
Cisco, 2007. Design Best Practices for Latency
Optimization, white paper. Cisco Systems, Inc.
Fischer, R., 2010. Influencing of ICT on national and
global development, available online (accessed on 08
November 2010): www.connect-world.com/
index.php/component/k2/item/3224-influence-of-ict-
on-national-and-global-development.
Hardy, I., 2010. KPMG: 15% of Canadians have done
banking through a mobile device, available online
(accessed on 18 August 2010): mobilesyrup.com/
2010/08/18/kpmg-15-of-canadians-have-done-bank
ing-through-a-mobile-device/, 2010.
Ixia, 2010. IxChariot, available online (accessed August
18, 2010): www.ixchariot.com/, 2010
Ludwick, D. A., Doucette, J., 2009. Primary Care
Physicians’ Experience with Electronic Medical
Records: Barriers to Implementation in Fee-for-
Service Environment, International Journal of
Telemedicine and Applications. Hindawi.
Palola, M., Jurvansuu, M., Korva, J., 2004. Breaking
Down the Mobile Service Response Time,
International Conference on Networks (ICON 2004).
IEEE.
Varshney, U., 2006. Enhancing Wireless Patient
Monitoring by Integrating Stored and Live Patient
Information. Computer-Based Medical Systems
(CBMS 2006). IEEE.
Maia, R. S., von Wangenheim, A., Nobre, L. F., 2006. A
Statewide Telemedicine Network for Public Health in
Brazil. Computer-Based Medical Systems (CBMS
2006). IEEE
HEALTHINF 2012 - International Conference on Health Informatics
396
